

Key Insights
The Nuclear Power Reactor Decommissioning market is poised for substantial expansion. Driven by an aging global fleet of nuclear power plants and stringent regulatory mandates for safe and efficient decommissioning, the market is projected to reach 8170.1 million by 2023, exhibiting a Compound Annual Growth Rate (CAGR) of 4%. The market is segmented by reactor type, application, and capacity, with North America, Asia-Pacific, and Europe leading regional growth due to the concentration of older facilities. Emerging economies in Asia are anticipated to contribute significantly to future expansion. Key challenges involve high decommissioning costs, complex regulatory environments, and the demand for specialized expertise. Innovations in dismantling and waste management, coupled with a growing emphasis on sustainable practices, are shaping market dynamics. Leading players like Aecom, Orano Group, and Westinghouse Electric Company underscore the significant investment and specialized knowledge required.
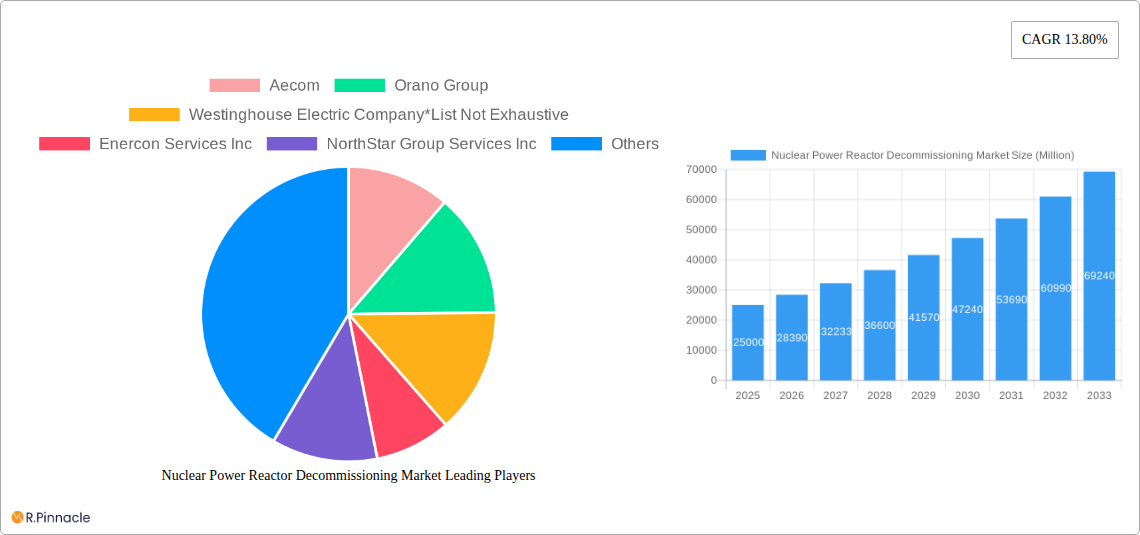
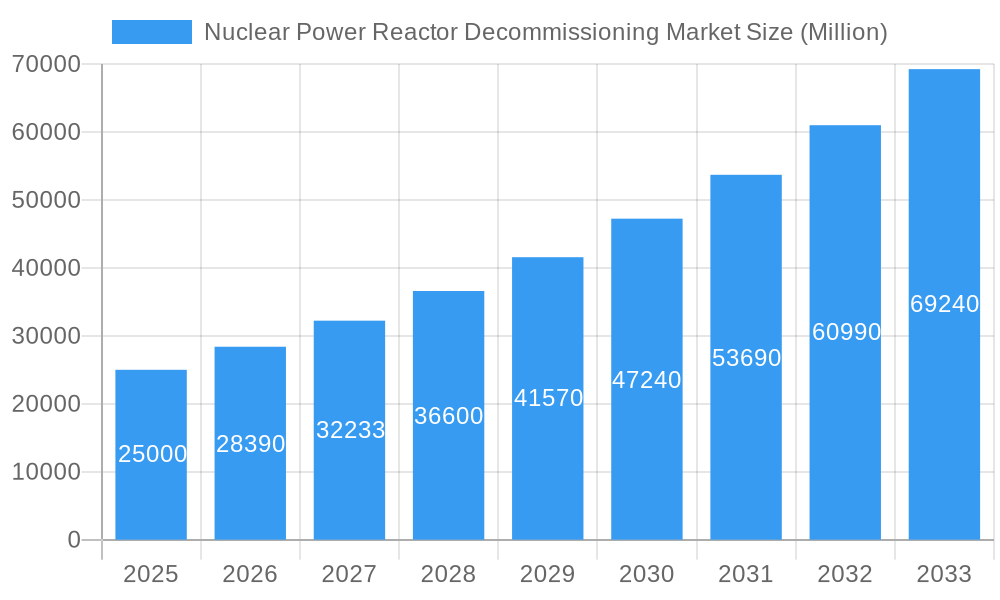
Nuclear Power Reactor Decommissioning Market Market Size (In Billion)
Continued market growth will be sustained by several key drivers. While extended operating licenses for existing plants defer immediate decommissioning, they contribute to the future pipeline of work. The advent of advanced reactor technologies, though offering long-term sustainability, will ultimately add to the global inventory of reactors requiring decommissioning. Heightened public awareness regarding environmental protection and nuclear waste management compels stricter regulatory compliance and the adoption of best practices, thereby increasing demand for specialized decommissioning services. This escalating demand, coupled with a limited pool of companies possessing the requisite expertise and infrastructure, is expected to foster market consolidation and enhance profitability for established entities. Ongoing advancements in decommissioning technologies are critical for addressing waste management and cost reduction challenges, thus influencing the market's future trajectory.
Nuclear Power Reactor Decommissioning Market Company Market Share
Nuclear Power Reactor Decommissioning Market: A Comprehensive Report (2019-2033)
This in-depth report provides a comprehensive analysis of the global Nuclear Power Reactor Decommissioning market, offering invaluable insights for industry professionals, investors, and stakeholders. The study period spans from 2019 to 2033, with 2025 serving as both the base and estimated year. The forecast period covers 2025-2033, while the historical period encompasses 2019-2024. Key players analyzed include Aecom, Orano Group, Westinghouse Electric Company, Enercon Services Inc, NorthStar Group Services Inc, GE Hitachi Nuclear Services, James Fisher & Sons PLC, Bechtel Group Inc, Fluor Corporation, Babcock International Group PLC, and Studsvik AB. This list is not exhaustive.
Nuclear Power Reactor Decommissioning Market Structure & Innovation Trends
This section delves into the competitive landscape of the nuclear power reactor decommissioning market, examining market concentration, innovation drivers, regulatory frameworks, and M&A activities. The report analyzes market share distribution among key players, revealing the degree of market concentration. Furthermore, it explores the impact of regulatory frameworks on market growth and assesses the role of innovation in shaping the industry. The analysis includes a detailed evaluation of M&A activities, including deal values and their influence on market dynamics. The report also discusses the influence of product substitutes and end-user demographics on market trends. Expected market concentration is estimated at xx% in 2025, with the top 5 players holding approximately xx% of the market share. Total M&A deal value in the last 5 years is estimated at $xx Million.
- Market Concentration: High, with a few dominant players.
- Innovation Drivers: Government regulations, technological advancements, and cost reduction strategies.
- Regulatory Frameworks: Stringent safety regulations drive technological innovation and higher costs.
- M&A Activities: Consolidation expected to continue, driven by economies of scale and expertise.
Nuclear Power Reactor Decommissioning Market Dynamics & Trends
This section provides a detailed analysis of market dynamics, encompassing growth drivers, technological disruptions, consumer preferences (i.e., regulatory bodies and power companies), and competitive dynamics. The report forecasts a CAGR of xx% during the forecast period (2025-2033), driven primarily by the aging nuclear power plant fleet and stringent regulations mandating decommissioning. The market penetration of advanced decommissioning technologies is expected to increase from xx% in 2025 to xx% by 2033. The analysis explores the impact of emerging technologies on the market, including robotic systems and advanced waste management techniques, and examines competitive strategies employed by leading players. This includes evaluating pricing strategies, technological advancements, and market expansion efforts.
Dominant Regions & Segments in Nuclear Power Reactor Decommissioning Market
This section identifies the leading regions and segments within the market. The analysis will highlight the dominant regions based on market size and growth rate. Dominant segments will be identified across reactor type (Pressurized Water Reactor, Pressurized Heavy Water Reactor, Boiling Water Reactor, High-temperature Gas-cooled Reactor, Liquid Metal Fast Breeder Reactor, Other Reactor Types), application (Commercial Power Reactor, Prototype Power Reactor, Research Reactor), and capacity (Below 100 MW, 100-1000 MW, Above 1000 MW).
- Key Drivers (by region): North America and Europe are anticipated to dominate due to a large aging nuclear power plant fleet and stringent regulatory frameworks. Asia-Pacific is projected to exhibit significant growth due to an increasing number of operational reactors reaching their end-of-life.
- Dominant Segments (by Reactor Type): Pressurized Water Reactors (PWRs) are expected to dominate due to their prevalence globally. Boiling Water Reactors (BWRs) and Pressurized Heavy Water Reactors (PHWRs) will also account for a significant market share.
- Dominant Segments (by Application): Commercial power reactors will constitute the largest segment due to the sheer number of plants requiring decommissioning.
- Dominant Segments (by Capacity): The 100-1000 MW capacity segment will likely dominate due to the significant number of reactors within this range.
Nuclear Power Reactor Decommissioning Market Product Innovations
This section summarizes recent product developments, focusing on technological trends and their market fit. Innovations include robotic systems for dismantling, advanced waste management solutions, and improved decontamination techniques. These advancements enhance efficiency, reduce costs, and improve worker safety, significantly impacting the market's competitive landscape.
Report Scope & Segmentation Analysis
This report segments the market by reactor type, application, and capacity. Growth projections and competitive dynamics are analyzed for each segment. Detailed market sizes are provided for each segment throughout the forecast period. The competitive intensity varies across segments, with some experiencing higher competition than others.
Key Drivers of Nuclear Power Reactor Decommissioning Market Growth
Growth is primarily driven by the aging global nuclear power plant fleet, stringent regulatory requirements for decommissioning, and increasing environmental concerns related to nuclear waste. Technological advancements in decommissioning techniques also contribute to market expansion.
Challenges in the Nuclear Power Reactor Decommissioning Market Sector
The market faces challenges including the high cost of decommissioning, complex regulatory frameworks, skilled labor shortages, and the potential for unforeseen technical difficulties during the decommissioning process. These factors can lead to project delays and cost overruns, impacting market growth.
Emerging Opportunities in Nuclear Power Reactor Decommissioning Market
Opportunities exist in developing advanced decommissioning technologies, expanding into emerging markets with aging nuclear power plants, and offering comprehensive decommissioning services that encompass all stages of the process.
Leading Players in the Nuclear Power Reactor Decommissioning Market Market
- Aecom
- Orano Group
- Westinghouse Electric Company
- Enercon Services Inc
- NorthStar Group Services Inc
- GE Hitachi Nuclear Services
- James Fisher & Sons PLC
- Bechtel Group Inc
- Fluor Corporation
- Babcock International Group PLC
- Studsvik AB
Key Developments in Nuclear Power Reactor Decommissioning Market Industry
- January 2023: Company X launched a new robotic system for nuclear reactor dismantling.
- June 2022: Company Y acquired Company Z, expanding its decommissioning capabilities.
- (Add further key developments with dates as available)
Future Outlook for Nuclear Power Reactor Decommissioning Market Market
The market is poised for continued growth, driven by the increasing number of aging nuclear power plants globally and advancements in decommissioning technologies. Strategic partnerships and technological innovation will be crucial for success in this sector. The market is projected to reach $xx Million by 2033.
Nuclear Power Reactor Decommissioning Market Segmentation
-
1. Reactor Type
- 1.1. Pressurized Water Reactor
- 1.2. Pressurized Heavy Water Reactor
- 1.3. Boiling Water Reactor
- 1.4. High-temperature Gas-cooled Reactor
- 1.5. Liquid Metal Fast Breeder Reactor
- 1.6. Other Reactor Types
-
2. Application
- 2.1. Commercial Power Reactor
- 2.2. Prototype Power Reactor
- 2.3. Research Reactor
-
3. Capacity
- 3.1. Below 100 MW
- 3.2. 100-1000 MW
- 3.3. Above 1000 MW
Nuclear Power Reactor Decommissioning Market Segmentation By Geography
- 1. North America
- 2. Asia Pacific
- 3. Europe
- 4. South America
- 5. Middle East and Africa
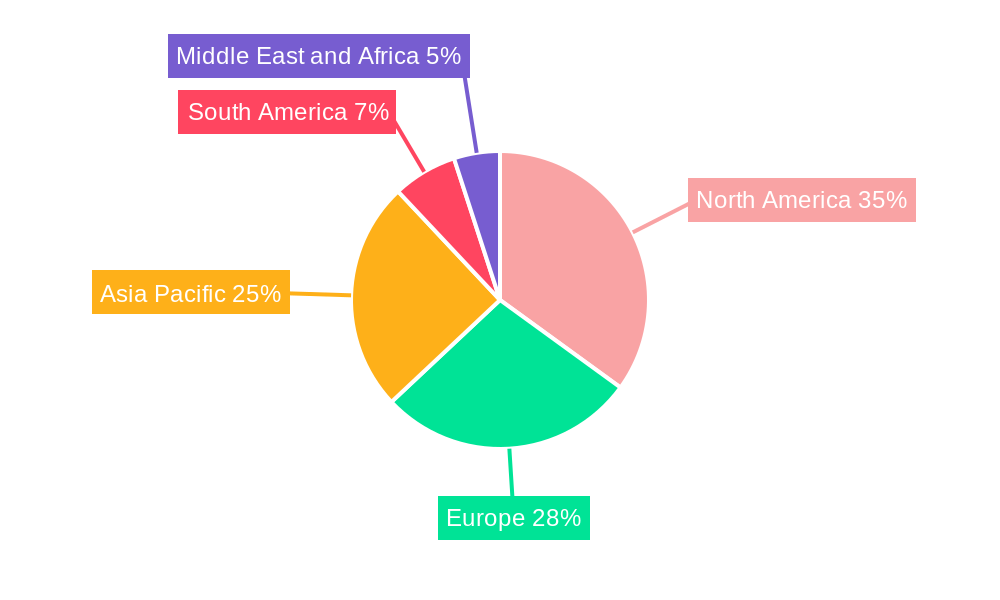
Nuclear Power Reactor Decommissioning Market Regional Market Share
Geographic Coverage of Nuclear Power Reactor Decommissioning Market
Nuclear Power Reactor Decommissioning Market REPORT HIGHLIGHTS
| Aspects | Details |
|---|---|
| Study Period | 2020-2034 |
| Base Year | 2025 |
| Estimated Year | 2026 |
| Forecast Period | 2026-2034 |
| Historical Period | 2020-2025 |
| Growth Rate | CAGR of 4% from 2020-2034 |
| Segmentation |
|
Table of Contents
- 1. Introduction
- 1.1. Research Scope
- 1.2. Market Segmentation
- 1.3. Research Objective
- 1.4. Definitions and Assumptions
- 2. Executive Summary
- 2.1. Market Snapshot
- 3. Market Dynamics
- 3.1. Market Drivers
- 3.2. Market Restrains
- 3.3. Market Trends
- 3.4. Market Opportunities
- 4. Market Factor Analysis
- 4.1. Porters Five Forces
- 4.1.1. Bargaining Power of Suppliers
- 4.1.2. Bargaining Power of Buyers
- 4.1.3. Threat of New Entrants
- 4.1.4. Threat of Substitutes
- 4.1.5. Competitive Rivalry
- 4.2. PESTEL analysis
- 4.3. BCG Analysis
- 4.3.1. Stars (High Growth, High Market Share)
- 4.3.2. Cash Cows (Low Growth, High Market Share)
- 4.3.3. Question Mark (High Growth, Low Market Share)
- 4.3.4. Dogs (Low Growth, Low Market Share)
- 4.4. Ansoff Matrix Analysis
- 4.5. Supply Chain Analysis
- 4.6. Regulatory Landscape
- 4.7. Current Market Potential and Opportunity Assessment (TAM–SAM–SOM Framework)
- 4.8. PRI Analyst Note
- 4.1. Porters Five Forces
- 5. Market Analysis, Insights and Forecast 2021-2033
- 5.1. Market Analysis, Insights and Forecast - by Reactor Type
- 5.1.1. Pressurized Water Reactor
- 5.1.2. Pressurized Heavy Water Reactor
- 5.1.3. Boiling Water Reactor
- 5.1.4. High-temperature Gas-cooled Reactor
- 5.1.5. Liquid Metal Fast Breeder Reactor
- 5.1.6. Other Reactor Types
- 5.2. Market Analysis, Insights and Forecast - by Application
- 5.2.1. Commercial Power Reactor
- 5.2.2. Prototype Power Reactor
- 5.2.3. Research Reactor
- 5.3. Market Analysis, Insights and Forecast - by Capacity
- 5.3.1. Below 100 MW
- 5.3.2. 100-1000 MW
- 5.3.3. Above 1000 MW
- 5.4. Market Analysis, Insights and Forecast - by Region
- 5.4.1. North America
- 5.4.2. Asia Pacific
- 5.4.3. Europe
- 5.4.4. South America
- 5.4.5. Middle East and Africa
- 5.1. Market Analysis, Insights and Forecast - by Reactor Type
- 6. Global Nuclear Power Reactor Decommissioning Market Analysis, Insights and Forecast, 2021-2033
- 6.1. Market Analysis, Insights and Forecast - by Reactor Type
- 6.1.1. Pressurized Water Reactor
- 6.1.2. Pressurized Heavy Water Reactor
- 6.1.3. Boiling Water Reactor
- 6.1.4. High-temperature Gas-cooled Reactor
- 6.1.5. Liquid Metal Fast Breeder Reactor
- 6.1.6. Other Reactor Types
- 6.2. Market Analysis, Insights and Forecast - by Application
- 6.2.1. Commercial Power Reactor
- 6.2.2. Prototype Power Reactor
- 6.2.3. Research Reactor
- 6.3. Market Analysis, Insights and Forecast - by Capacity
- 6.3.1. Below 100 MW
- 6.3.2. 100-1000 MW
- 6.3.3. Above 1000 MW
- 6.1. Market Analysis, Insights and Forecast - by Reactor Type
- 7. North America Nuclear Power Reactor Decommissioning Market Analysis, Insights and Forecast, 2020-2032
- 7.1. Market Analysis, Insights and Forecast - by Reactor Type
- 7.1.1. Pressurized Water Reactor
- 7.1.2. Pressurized Heavy Water Reactor
- 7.1.3. Boiling Water Reactor
- 7.1.4. High-temperature Gas-cooled Reactor
- 7.1.5. Liquid Metal Fast Breeder Reactor
- 7.1.6. Other Reactor Types
- 7.2. Market Analysis, Insights and Forecast - by Application
- 7.2.1. Commercial Power Reactor
- 7.2.2. Prototype Power Reactor
- 7.2.3. Research Reactor
- 7.3. Market Analysis, Insights and Forecast - by Capacity
- 7.3.1. Below 100 MW
- 7.3.2. 100-1000 MW
- 7.3.3. Above 1000 MW
- 7.1. Market Analysis, Insights and Forecast - by Reactor Type
- 8. Asia Pacific Nuclear Power Reactor Decommissioning Market Analysis, Insights and Forecast, 2020-2032
- 8.1. Market Analysis, Insights and Forecast - by Reactor Type
- 8.1.1. Pressurized Water Reactor
- 8.1.2. Pressurized Heavy Water Reactor
- 8.1.3. Boiling Water Reactor
- 8.1.4. High-temperature Gas-cooled Reactor
- 8.1.5. Liquid Metal Fast Breeder Reactor
- 8.1.6. Other Reactor Types
- 8.2. Market Analysis, Insights and Forecast - by Application
- 8.2.1. Commercial Power Reactor
- 8.2.2. Prototype Power Reactor
- 8.2.3. Research Reactor
- 8.3. Market Analysis, Insights and Forecast - by Capacity
- 8.3.1. Below 100 MW
- 8.3.2. 100-1000 MW
- 8.3.3. Above 1000 MW
- 8.1. Market Analysis, Insights and Forecast - by Reactor Type
- 9. Europe Nuclear Power Reactor Decommissioning Market Analysis, Insights and Forecast, 2020-2032
- 9.1. Market Analysis, Insights and Forecast - by Reactor Type
- 9.1.1. Pressurized Water Reactor
- 9.1.2. Pressurized Heavy Water Reactor
- 9.1.3. Boiling Water Reactor
- 9.1.4. High-temperature Gas-cooled Reactor
- 9.1.5. Liquid Metal Fast Breeder Reactor
- 9.1.6. Other Reactor Types
- 9.2. Market Analysis, Insights and Forecast - by Application
- 9.2.1. Commercial Power Reactor
- 9.2.2. Prototype Power Reactor
- 9.2.3. Research Reactor
- 9.3. Market Analysis, Insights and Forecast - by Capacity
- 9.3.1. Below 100 MW
- 9.3.2. 100-1000 MW
- 9.3.3. Above 1000 MW
- 9.1. Market Analysis, Insights and Forecast - by Reactor Type
- 10. South America Nuclear Power Reactor Decommissioning Market Analysis, Insights and Forecast, 2020-2032
- 10.1. Market Analysis, Insights and Forecast - by Reactor Type
- 10.1.1. Pressurized Water Reactor
- 10.1.2. Pressurized Heavy Water Reactor
- 10.1.3. Boiling Water Reactor
- 10.1.4. High-temperature Gas-cooled Reactor
- 10.1.5. Liquid Metal Fast Breeder Reactor
- 10.1.6. Other Reactor Types
- 10.2. Market Analysis, Insights and Forecast - by Application
- 10.2.1. Commercial Power Reactor
- 10.2.2. Prototype Power Reactor
- 10.2.3. Research Reactor
- 10.3. Market Analysis, Insights and Forecast - by Capacity
- 10.3.1. Below 100 MW
- 10.3.2. 100-1000 MW
- 10.3.3. Above 1000 MW
- 10.1. Market Analysis, Insights and Forecast - by Reactor Type
- 11. Middle East and Africa Nuclear Power Reactor Decommissioning Market Analysis, Insights and Forecast, 2020-2032
- 11.1. Market Analysis, Insights and Forecast - by Reactor Type
- 11.1.1. Pressurized Water Reactor
- 11.1.2. Pressurized Heavy Water Reactor
- 11.1.3. Boiling Water Reactor
- 11.1.4. High-temperature Gas-cooled Reactor
- 11.1.5. Liquid Metal Fast Breeder Reactor
- 11.1.6. Other Reactor Types
- 11.2. Market Analysis, Insights and Forecast - by Application
- 11.2.1. Commercial Power Reactor
- 11.2.2. Prototype Power Reactor
- 11.2.3. Research Reactor
- 11.3. Market Analysis, Insights and Forecast - by Capacity
- 11.3.1. Below 100 MW
- 11.3.2. 100-1000 MW
- 11.3.3. Above 1000 MW
- 11.1. Market Analysis, Insights and Forecast - by Reactor Type
- 12. Competitive Analysis
- 12.1. Company Profiles
- 12.1.1 Aecom
- 12.1.1.1. Company Overview
- 12.1.1.2. Products
- 12.1.1.3. Company Financials
- 12.1.1.4. SWOT Analysis
- 12.1.2 Orano Group
- 12.1.2.1. Company Overview
- 12.1.2.2. Products
- 12.1.2.3. Company Financials
- 12.1.2.4. SWOT Analysis
- 12.1.3 Westinghouse Electric Company*List Not Exhaustive
- 12.1.3.1. Company Overview
- 12.1.3.2. Products
- 12.1.3.3. Company Financials
- 12.1.3.4. SWOT Analysis
- 12.1.4 Enercon Services Inc
- 12.1.4.1. Company Overview
- 12.1.4.2. Products
- 12.1.4.3. Company Financials
- 12.1.4.4. SWOT Analysis
- 12.1.5 NorthStar Group Services Inc
- 12.1.5.1. Company Overview
- 12.1.5.2. Products
- 12.1.5.3. Company Financials
- 12.1.5.4. SWOT Analysis
- 12.1.6 GE Hitachi Nuclear Services
- 12.1.6.1. Company Overview
- 12.1.6.2. Products
- 12.1.6.3. Company Financials
- 12.1.6.4. SWOT Analysis
- 12.1.7 James Fisher & Sons PLC
- 12.1.7.1. Company Overview
- 12.1.7.2. Products
- 12.1.7.3. Company Financials
- 12.1.7.4. SWOT Analysis
- 12.1.8 Bechtel Group Inc
- 12.1.8.1. Company Overview
- 12.1.8.2. Products
- 12.1.8.3. Company Financials
- 12.1.8.4. SWOT Analysis
- 12.1.9 Fluor Corporation
- 12.1.9.1. Company Overview
- 12.1.9.2. Products
- 12.1.9.3. Company Financials
- 12.1.9.4. SWOT Analysis
- 12.1.10 Babcock International Group PLC
- 12.1.10.1. Company Overview
- 12.1.10.2. Products
- 12.1.10.3. Company Financials
- 12.1.10.4. SWOT Analysis
- 12.1.11 Studsvik AB
- 12.1.11.1. Company Overview
- 12.1.11.2. Products
- 12.1.11.3. Company Financials
- 12.1.11.4. SWOT Analysis
- 12.1.1 Aecom
- 12.2. Market Entropy
- 12.2.1 Company's Key Areas Served
- 12.2.2 Recent Developments
- 12.3. Company Market Share Analysis 2025
- 12.3.1 Top 5 Companies Market Share Analysis
- 12.3.2 Top 3 Companies Market Share Analysis
- 12.4. List of Potential Customers
- 13. Research Methodology
List of Figures
- Figure 1: Global Nuclear Power Reactor Decommissioning Market Revenue Breakdown (million, %) by Region 2025 & 2033
- Figure 2: North America Nuclear Power Reactor Decommissioning Market Revenue (million), by Reactor Type 2025 & 2033
- Figure 3: North America Nuclear Power Reactor Decommissioning Market Revenue Share (%), by Reactor Type 2025 & 2033
- Figure 4: North America Nuclear Power Reactor Decommissioning Market Revenue (million), by Application 2025 & 2033
- Figure 5: North America Nuclear Power Reactor Decommissioning Market Revenue Share (%), by Application 2025 & 2033
- Figure 6: North America Nuclear Power Reactor Decommissioning Market Revenue (million), by Capacity 2025 & 2033
- Figure 7: North America Nuclear Power Reactor Decommissioning Market Revenue Share (%), by Capacity 2025 & 2033
- Figure 8: North America Nuclear Power Reactor Decommissioning Market Revenue (million), by Country 2025 & 2033
- Figure 9: North America Nuclear Power Reactor Decommissioning Market Revenue Share (%), by Country 2025 & 2033
- Figure 10: Asia Pacific Nuclear Power Reactor Decommissioning Market Revenue (million), by Reactor Type 2025 & 2033
- Figure 11: Asia Pacific Nuclear Power Reactor Decommissioning Market Revenue Share (%), by Reactor Type 2025 & 2033
- Figure 12: Asia Pacific Nuclear Power Reactor Decommissioning Market Revenue (million), by Application 2025 & 2033
- Figure 13: Asia Pacific Nuclear Power Reactor Decommissioning Market Revenue Share (%), by Application 2025 & 2033
- Figure 14: Asia Pacific Nuclear Power Reactor Decommissioning Market Revenue (million), by Capacity 2025 & 2033
- Figure 15: Asia Pacific Nuclear Power Reactor Decommissioning Market Revenue Share (%), by Capacity 2025 & 2033
- Figure 16: Asia Pacific Nuclear Power Reactor Decommissioning Market Revenue (million), by Country 2025 & 2033
- Figure 17: Asia Pacific Nuclear Power Reactor Decommissioning Market Revenue Share (%), by Country 2025 & 2033
- Figure 18: Europe Nuclear Power Reactor Decommissioning Market Revenue (million), by Reactor Type 2025 & 2033
- Figure 19: Europe Nuclear Power Reactor Decommissioning Market Revenue Share (%), by Reactor Type 2025 & 2033
- Figure 20: Europe Nuclear Power Reactor Decommissioning Market Revenue (million), by Application 2025 & 2033
- Figure 21: Europe Nuclear Power Reactor Decommissioning Market Revenue Share (%), by Application 2025 & 2033
- Figure 22: Europe Nuclear Power Reactor Decommissioning Market Revenue (million), by Capacity 2025 & 2033
- Figure 23: Europe Nuclear Power Reactor Decommissioning Market Revenue Share (%), by Capacity 2025 & 2033
- Figure 24: Europe Nuclear Power Reactor Decommissioning Market Revenue (million), by Country 2025 & 2033
- Figure 25: Europe Nuclear Power Reactor Decommissioning Market Revenue Share (%), by Country 2025 & 2033
- Figure 26: South America Nuclear Power Reactor Decommissioning Market Revenue (million), by Reactor Type 2025 & 2033
- Figure 27: South America Nuclear Power Reactor Decommissioning Market Revenue Share (%), by Reactor Type 2025 & 2033
- Figure 28: South America Nuclear Power Reactor Decommissioning Market Revenue (million), by Application 2025 & 2033
- Figure 29: South America Nuclear Power Reactor Decommissioning Market Revenue Share (%), by Application 2025 & 2033
- Figure 30: South America Nuclear Power Reactor Decommissioning Market Revenue (million), by Capacity 2025 & 2033
- Figure 31: South America Nuclear Power Reactor Decommissioning Market Revenue Share (%), by Capacity 2025 & 2033
- Figure 32: South America Nuclear Power Reactor Decommissioning Market Revenue (million), by Country 2025 & 2033
- Figure 33: South America Nuclear Power Reactor Decommissioning Market Revenue Share (%), by Country 2025 & 2033
- Figure 34: Middle East and Africa Nuclear Power Reactor Decommissioning Market Revenue (million), by Reactor Type 2025 & 2033
- Figure 35: Middle East and Africa Nuclear Power Reactor Decommissioning Market Revenue Share (%), by Reactor Type 2025 & 2033
- Figure 36: Middle East and Africa Nuclear Power Reactor Decommissioning Market Revenue (million), by Application 2025 & 2033
- Figure 37: Middle East and Africa Nuclear Power Reactor Decommissioning Market Revenue Share (%), by Application 2025 & 2033
- Figure 38: Middle East and Africa Nuclear Power Reactor Decommissioning Market Revenue (million), by Capacity 2025 & 2033
- Figure 39: Middle East and Africa Nuclear Power Reactor Decommissioning Market Revenue Share (%), by Capacity 2025 & 2033
- Figure 40: Middle East and Africa Nuclear Power Reactor Decommissioning Market Revenue (million), by Country 2025 & 2033
- Figure 41: Middle East and Africa Nuclear Power Reactor Decommissioning Market Revenue Share (%), by Country 2025 & 2033
List of Tables
- Table 1: Global Nuclear Power Reactor Decommissioning Market Revenue million Forecast, by Reactor Type 2020 & 2033
- Table 2: Global Nuclear Power Reactor Decommissioning Market Revenue million Forecast, by Application 2020 & 2033
- Table 3: Global Nuclear Power Reactor Decommissioning Market Revenue million Forecast, by Capacity 2020 & 2033
- Table 4: Global Nuclear Power Reactor Decommissioning Market Revenue million Forecast, by Region 2020 & 2033
- Table 5: Global Nuclear Power Reactor Decommissioning Market Revenue million Forecast, by Reactor Type 2020 & 2033
- Table 6: Global Nuclear Power Reactor Decommissioning Market Revenue million Forecast, by Application 2020 & 2033
- Table 7: Global Nuclear Power Reactor Decommissioning Market Revenue million Forecast, by Capacity 2020 & 2033
- Table 8: Global Nuclear Power Reactor Decommissioning Market Revenue million Forecast, by Country 2020 & 2033
- Table 9: Global Nuclear Power Reactor Decommissioning Market Revenue million Forecast, by Reactor Type 2020 & 2033
- Table 10: Global Nuclear Power Reactor Decommissioning Market Revenue million Forecast, by Application 2020 & 2033
- Table 11: Global Nuclear Power Reactor Decommissioning Market Revenue million Forecast, by Capacity 2020 & 2033
- Table 12: Global Nuclear Power Reactor Decommissioning Market Revenue million Forecast, by Country 2020 & 2033
- Table 13: Global Nuclear Power Reactor Decommissioning Market Revenue million Forecast, by Reactor Type 2020 & 2033
- Table 14: Global Nuclear Power Reactor Decommissioning Market Revenue million Forecast, by Application 2020 & 2033
- Table 15: Global Nuclear Power Reactor Decommissioning Market Revenue million Forecast, by Capacity 2020 & 2033
- Table 16: Global Nuclear Power Reactor Decommissioning Market Revenue million Forecast, by Country 2020 & 2033
- Table 17: Global Nuclear Power Reactor Decommissioning Market Revenue million Forecast, by Reactor Type 2020 & 2033
- Table 18: Global Nuclear Power Reactor Decommissioning Market Revenue million Forecast, by Application 2020 & 2033
- Table 19: Global Nuclear Power Reactor Decommissioning Market Revenue million Forecast, by Capacity 2020 & 2033
- Table 20: Global Nuclear Power Reactor Decommissioning Market Revenue million Forecast, by Country 2020 & 2033
- Table 21: Global Nuclear Power Reactor Decommissioning Market Revenue million Forecast, by Reactor Type 2020 & 2033
- Table 22: Global Nuclear Power Reactor Decommissioning Market Revenue million Forecast, by Application 2020 & 2033
- Table 23: Global Nuclear Power Reactor Decommissioning Market Revenue million Forecast, by Capacity 2020 & 2033
- Table 24: Global Nuclear Power Reactor Decommissioning Market Revenue million Forecast, by Country 2020 & 2033
Frequently Asked Questions
1. What is the projected Compound Annual Growth Rate (CAGR) of the Nuclear Power Reactor Decommissioning Market?
The projected CAGR is approximately 4%.
2. Which companies are prominent players in the Nuclear Power Reactor Decommissioning Market?
Key companies in the market include Aecom, Orano Group, Westinghouse Electric Company*List Not Exhaustive, Enercon Services Inc, NorthStar Group Services Inc, GE Hitachi Nuclear Services, James Fisher & Sons PLC, Bechtel Group Inc, Fluor Corporation, Babcock International Group PLC, Studsvik AB.
3. What are the main segments of the Nuclear Power Reactor Decommissioning Market?
The market segments include Reactor Type, Application, Capacity.
4. Can you provide details about the market size?
The market size is estimated to be USD 8170.1 million as of 2022.
5. What are some drivers contributing to market growth?
4.; Presence of Strict Government Regulations to Control Air Pollution.
6. What are the notable trends driving market growth?
Commercial Reactors Segment is Expected to Dominate the Market.
7. Are there any restraints impacting market growth?
4.; Increasing Adoption of Renewable Energy.
8. Can you provide examples of recent developments in the market?
N/A
9. What pricing options are available for accessing the report?
Pricing options include single-user, multi-user, and enterprise licenses priced at USD 4750, USD 5250, and USD 8750 respectively.
10. Is the market size provided in terms of value or volume?
The market size is provided in terms of value, measured in million.
11. Are there any specific market keywords associated with the report?
Yes, the market keyword associated with the report is "Nuclear Power Reactor Decommissioning Market," which aids in identifying and referencing the specific market segment covered.
12. How do I determine which pricing option suits my needs best?
The pricing options vary based on user requirements and access needs. Individual users may opt for single-user licenses, while businesses requiring broader access may choose multi-user or enterprise licenses for cost-effective access to the report.
13. Are there any additional resources or data provided in the Nuclear Power Reactor Decommissioning Market report?
While the report offers comprehensive insights, it's advisable to review the specific contents or supplementary materials provided to ascertain if additional resources or data are available.
14. How can I stay updated on further developments or reports in the Nuclear Power Reactor Decommissioning Market?
To stay informed about further developments, trends, and reports in the Nuclear Power Reactor Decommissioning Market, consider subscribing to industry newsletters, following relevant companies and organizations, or regularly checking reputable industry news sources and publications.
Methodology
Step 1 - Identification of Relevant Samples Size from Population Database


Step 2 - Approaches for Defining Global Market Size (Value, Volume* & Price*)

Note*: In applicable scenarios
Step 3 - Data Sources
Primary Research
- Web Analytics
- Survey Reports
- Research Institute
- Latest Research Reports
- Opinion Leaders
Secondary Research
- Annual Reports
- White Paper
- Latest Press Release
- Industry Association
- Paid Database
- Investor Presentations

Step 4 - Data Triangulation
Involves using different sources of information in order to increase the validity of a study
These sources are likely to be stakeholders in a program - participants, other researchers, program staff, other community members, and so on.
Then we put all data in single framework & apply various statistical tools to find out the dynamic on the market.
During the analysis stage, feedback from the stakeholder groups would be compared to determine areas of agreement as well as areas of divergence