
Key Insights
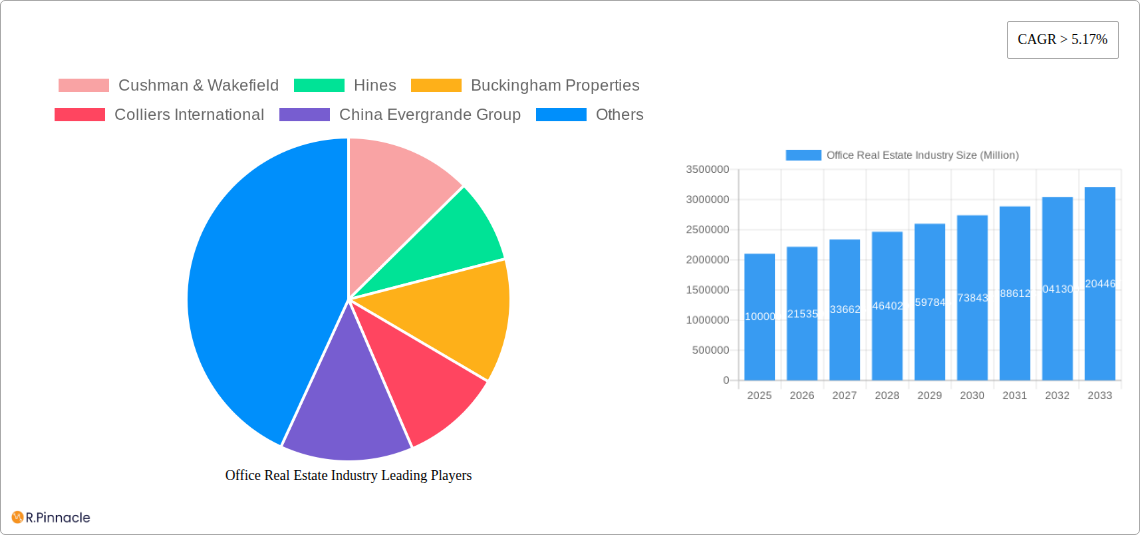
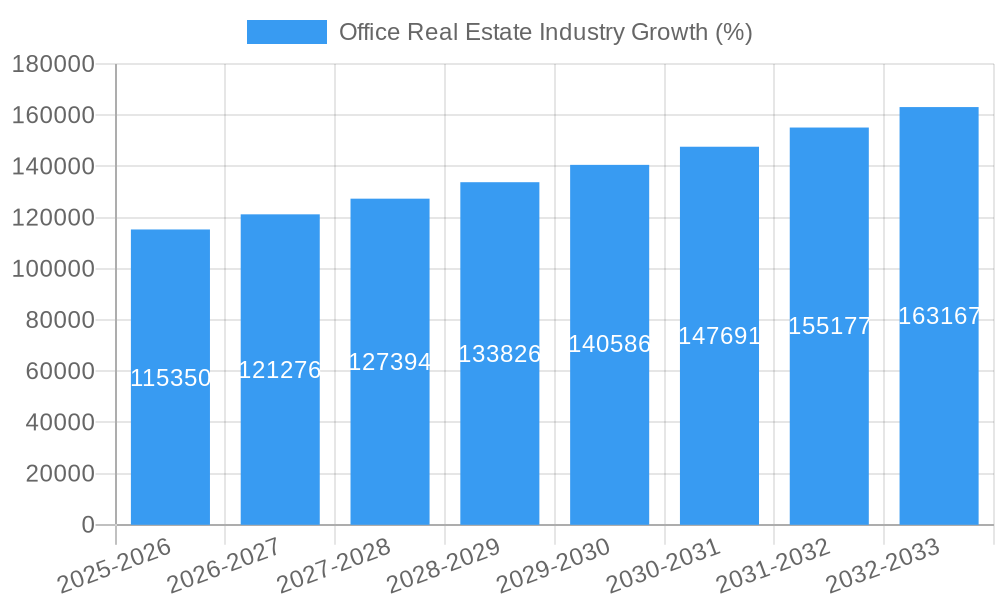
The global office real estate market, currently valued at $2.10 trillion in 2025, is projected to experience robust growth, exhibiting a Compound Annual Growth Rate (CAGR) exceeding 5.17% from 2025 to 2033. This expansion is fueled by several key factors. The increasing urbanization globally, coupled with the growth of technology companies and financial institutions, necessitates larger and more sophisticated office spaces. Furthermore, the ongoing trend towards hybrid work models, while initially impacting demand, is ultimately driving a shift towards higher-quality, amenity-rich offices designed to foster collaboration and productivity. This shift favors flexible workspace solutions and strategically located properties in vibrant urban centers or easily accessible suburban areas, leading to a dynamic reshaping of the office landscape. Competitive advantages are accruing to owners and developers who can offer adaptable spaces catering to changing tenant needs, incorporating sustainable designs and advanced technologies for enhanced efficiency and employee wellbeing. The sector's growth is also supported by ongoing investments in infrastructure and rising disposable incomes in many developing economies.
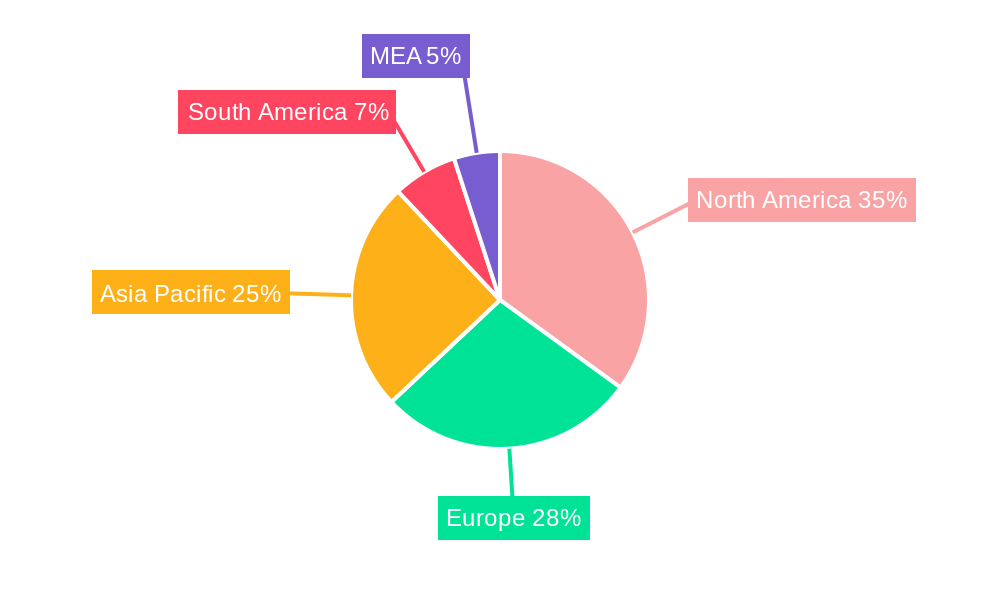
However, challenges remain. Economic downturns and uncertainties can impact corporate investment in real estate, while factors like remote work trends, and high construction costs could dampen growth in specific regions. Nevertheless, the long-term outlook remains positive, driven by a persistent need for physical office space, even in the context of remote work becoming more prevalent. Segment-wise, the office accommodation sector forms the largest part of the market, followed by office equipment and services. Corporate offices currently dominate the applications segment, but increasing government spending on infrastructure and the steady expansion of the financial sector will broaden the market’s reach and underpin future growth. North America and Asia-Pacific are expected to be the largest regional markets, with substantial growth potential also present in developing economies across Europe and the Middle East and Africa. Key players, including Cushman & Wakefield, JLL, and Hines, are well-positioned to capitalize on these trends through strategic acquisitions, portfolio diversification, and innovative service offerings.
Office Real Estate Industry Report: 2019-2033 Forecast
This comprehensive report provides an in-depth analysis of the global office real estate industry, projecting market trends from 2019 to 2033. The report leverages extensive data and analysis to offer actionable insights for industry professionals, investors, and stakeholders. With a focus on key players like Cushman & Wakefield, Hines, Buckingham Properties, Colliers International, China Evergrande Group, Delhi Land & Finance, JLL, and Skanska, this report is an essential resource for understanding the current landscape and future trajectory of this dynamic market. The report projects a market value exceeding $XX Million by 2033.
Office Real Estate Industry Market Structure & Innovation Trends
This section analyzes the market's competitive landscape, focusing on market concentration, innovation drivers, regulatory frameworks, and M&A activities. The study period covers 2019-2033, with 2025 as the base and estimated year.
Market Concentration: The office real estate market exhibits a moderately concentrated structure, with major players like Cushman & Wakefield, Hines, and JLL holding significant market share. Precise figures will be presented within the full report, showcasing market share fluctuations over the study period. The report will also incorporate an analysis of smaller players' roles and their influence on the market dynamics.
Innovation Drivers: Technological advancements, such as smart building technologies and flexible workspace solutions, are key drivers of innovation. Increased demand for sustainable and energy-efficient buildings is also significantly impacting the industry.
Regulatory Frameworks: Government regulations concerning building codes, environmental standards, and zoning laws play a crucial role in shaping market dynamics. The report will detail the impact of specific regulations across different regions.
Product Substitutes: The rise of co-working spaces and remote work arrangements presents a growing substitute for traditional office accommodation. The analysis will quantify this substitution effect and its impact on the overall market.
End-User Demographics: Shifting demographics and evolving workplace preferences (e.g., Gen Z and millennial preferences for flexible work arrangements) significantly influence the demand for various office spaces.
M&A Activities: The report analyzes significant M&A activities within the industry during the historical period (2019-2024), providing details on deal values (e.g., total value exceeding $XX Million in deals involving key players) and their impact on market consolidation. Specific examples of M&A transactions and their financial implications are presented.
Office Real Estate Industry Market Dynamics & Trends
This section explores the key market dynamics shaping the office real estate sector from 2019 to 2033. The analysis covers market growth drivers, technological disruptions, consumer preferences, and competitive dynamics.
The market is projected to experience a Compound Annual Growth Rate (CAGR) of XX% during the forecast period (2025-2033), driven by factors such as urbanization, population growth, and increasing demand for office spaces in key economic hubs. Technological disruptions, such as the adoption of PropTech solutions and the rise of remote work models, are transforming the sector and influencing market penetration rates for different types of office spaces. The report will provide detailed analysis on consumer preferences based on demographics, industry, and location. The competitive dynamics, including strategic alliances, new entrants, and market share shifts amongst key players such as Hines and JLL, are also key elements of the analysis.
Dominant Regions & Segments in Office Real Estate Industry
This section identifies the leading regions and segments within the office real estate market, focusing on key drivers for dominance. The study considers various aspects including Product Types (Office Accommodation, Office Equipment, Office Services) and Applications (Corporate Offices, Government Offices, Financial Institutions).
Dominant Regions: The report identifies [Specific Region, e.g., North America] as the leading region, primarily due to [Specific Reasons, e.g., robust economic growth, strong demand from the technology sector].
- Key Drivers for Dominance (North America):
- Strong economic growth and high levels of foreign direct investment.
- Well-developed infrastructure and business-friendly regulatory environment.
- High concentration of multinational corporations and technology companies.
- Significant investment in commercial real estate development.
Dominant Segments: The report will analyze which segments within Product Types and Applications are expected to witness the highest growth and dominate the market in the forecast period. Office Accommodation is predicted to hold the largest market share due to the consistent demand, followed by [predicted second largest segment and reasoning]. Similarly, it will analyze application segments to determine which one (Corporate offices, Government Offices, or Financial Institutions) will dominate.
Office Real Estate Industry Product Innovations
The office real estate industry is witnessing significant product innovations, driven primarily by technological advancements. Smart building technologies, such as automated lighting and HVAC systems, are enhancing energy efficiency and operational efficiency. Flexible workspace solutions, including co-working spaces and modular office designs, cater to the evolving needs of businesses. These innovations are improving the tenant experience and enhancing the competitive advantage of office buildings.
Report Scope & Segmentation Analysis
This report comprehensively segments the office real estate market across various parameters.
Product Types:
- Office Accommodation: This segment includes traditional office spaces, co-working spaces, and flexible office solutions. Growth projections and market size estimates for this segment will be detailed.
- Office Equipment: This segment encompasses furniture, technology infrastructure, and other equipment essential for office functionality. Competitive dynamics will be included.
- Office Services: This includes property management, cleaning, security, and other related services.
Applications:
- Corporate Offices: The market size, growth projection, and competitive dynamics for this major segment will be detailed.
- Government Offices: This segment will be analyzed for market size, growth projection, and challenges specific to this segment.
- Financial Institutions: The report will detail the size of this segment, its anticipated growth and competitive landscape.
Key Drivers of Office Real Estate Industry Growth
Several factors fuel the growth of the office real estate industry. Strong economic growth and rising urbanization lead to increased demand for office space. Technological advancements, including smart building technologies and flexible workspace solutions, enhance the appeal of office buildings. Favorable government policies and investments in infrastructure further contribute to market expansion.
Challenges in the Office Real Estate Industry Sector
The office real estate industry faces several challenges. Stringent building codes and environmental regulations can increase development costs. Supply chain disruptions can impact the availability of construction materials, causing delays and cost overruns. Increased competition and the rise of alternative workspace solutions (e.g., remote work) put pressure on occupancy rates and rental yields. For example, a 10% increase in construction material costs could lead to a XX Million dollar impact on development projects (estimated).
Emerging Opportunities in Office Real Estate Industry
The industry presents several promising opportunities. The growing adoption of sustainable building practices creates opportunities for environmentally conscious developments. The increasing demand for flexible and co-working spaces presents niche market opportunities. Technological advancements, such as AI-powered property management systems and smart building technologies, offer significant value creation opportunities.
Leading Players in the Office Real Estate Industry Market
- Cushman & Wakefield
- Hines
- Buckingham Properties
- Colliers International
- China Evergrande Group
- Delhi Land & Finance
- JLL
- Skanska
Key Developments in Office Real Estate Industry
- [Date]: [Company] launches a new smart building technology, impacting energy efficiency.
- [Date]: [Company A] and [Company B] merge, resulting in a significant market share increase.
- [Date]: A new government regulation on sustainable building practices impacts development costs. (More developments will be listed in the complete report)
Future Outlook for Office Real Estate Industry Market
The future of the office real estate industry looks promising, driven by continued urbanization, technological innovation, and increasing demand for flexible workspace solutions. The market is expected to witness sustained growth, particularly in emerging economies. Strategic investments in sustainable building practices and technological upgrades will be crucial for success. The market will continue to consolidate as larger players acquire smaller firms.
Office Real Estate Industry Segmentation
- 1. Production Analysis
- 2. Consumption Analysis
- 3. Import Market Analysis (Value & Volume)
- 4. Export Market Analysis (Value & Volume)
- 5. Price Trend Analysis
Office Real Estate Industry Segmentation By Geography
-
1. North America
- 1.1. United States
- 1.2. Canada
- 1.3. Mexico
-
2. Europe
- 2.1. United Kingdom
- 2.2. France
- 2.3. Germany
- 2.4. Rest of Europe
-
3. Asia Pacific
- 3.1. China
- 3.2. India
- 3.3. Japan
- 3.4. South Korea
- 3.5. Rest of Asia Pacific
- 4. Middle East
-
5. United Arab Emirates
- 5.1. Saudi Arabia
- 5.2. South Africa
- 5.3. Rest of Middle East
-
6. Latin America
- 6.1. Brazil
- 6.2. Argentina
- 6.3. Rest of Latin America
- 7. Rest of the World
Office Real Estate Industry REPORT HIGHLIGHTS
| Aspects | Details |
|---|---|
| Study Period | 2019-2033 |
| Base Year | 2024 |
| Estimated Year | 2025 |
| Forecast Period | 2025-2033 |
| Historical Period | 2019-2024 |
| Growth Rate | CAGR of > 5.17% from 2019-2033 |
| Segmentation |
|
Table of Contents
- 1. Introduction
- 1.1. Research Scope
- 1.2. Market Segmentation
- 1.3. Research Methodology
- 1.4. Definitions and Assumptions
- 2. Executive Summary
- 2.1. Introduction
- 3. Market Dynamics
- 3.1. Introduction
- 3.2. Market Drivers
- 3.2.1. Office Leasing Volume is Witnessing Significant Growth; Increasing Rental Prices of Office Spaces
- 3.3. Market Restrains
- 3.3.1. Remote Work and Hybrid Models; High vacancy rates can be a significant challenge in the office market
- 3.4. Market Trends
- 3.4.1. Rise in Demand for Coworking Spaces
- 4. Market Factor Analysis
- 4.1. Porters Five Forces
- 4.2. Supply/Value Chain
- 4.3. PESTEL analysis
- 4.4. Market Entropy
- 4.5. Patent/Trademark Analysis
- 5. Global Office Real Estate Industry Analysis, Insights and Forecast, 2019-2031
- 5.1. Market Analysis, Insights and Forecast - by Production Analysis
- 5.2. Market Analysis, Insights and Forecast - by Consumption Analysis
- 5.3. Market Analysis, Insights and Forecast - by Import Market Analysis (Value & Volume)
- 5.4. Market Analysis, Insights and Forecast - by Export Market Analysis (Value & Volume)
- 5.5. Market Analysis, Insights and Forecast - by Price Trend Analysis
- 5.6. Market Analysis, Insights and Forecast - by Region
- 5.6.1. North America
- 5.6.2. Europe
- 5.6.3. Asia Pacific
- 5.6.4. Middle East
- 5.6.5. United Arab Emirates
- 5.6.6. Latin America
- 5.6.7. Rest of the World
- 5.1. Market Analysis, Insights and Forecast - by Production Analysis
- 6. North America Office Real Estate Industry Analysis, Insights and Forecast, 2019-2031
- 6.1. Market Analysis, Insights and Forecast - by Production Analysis
- 6.2. Market Analysis, Insights and Forecast - by Consumption Analysis
- 6.3. Market Analysis, Insights and Forecast - by Import Market Analysis (Value & Volume)
- 6.4. Market Analysis, Insights and Forecast - by Export Market Analysis (Value & Volume)
- 6.5. Market Analysis, Insights and Forecast - by Price Trend Analysis
- 6.1. Market Analysis, Insights and Forecast - by Production Analysis
- 7. Europe Office Real Estate Industry Analysis, Insights and Forecast, 2019-2031
- 7.1. Market Analysis, Insights and Forecast - by Production Analysis
- 7.2. Market Analysis, Insights and Forecast - by Consumption Analysis
- 7.3. Market Analysis, Insights and Forecast - by Import Market Analysis (Value & Volume)
- 7.4. Market Analysis, Insights and Forecast - by Export Market Analysis (Value & Volume)
- 7.5. Market Analysis, Insights and Forecast - by Price Trend Analysis
- 7.1. Market Analysis, Insights and Forecast - by Production Analysis
- 8. Asia Pacific Office Real Estate Industry Analysis, Insights and Forecast, 2019-2031
- 8.1. Market Analysis, Insights and Forecast - by Production Analysis
- 8.2. Market Analysis, Insights and Forecast - by Consumption Analysis
- 8.3. Market Analysis, Insights and Forecast - by Import Market Analysis (Value & Volume)
- 8.4. Market Analysis, Insights and Forecast - by Export Market Analysis (Value & Volume)
- 8.5. Market Analysis, Insights and Forecast - by Price Trend Analysis
- 8.1. Market Analysis, Insights and Forecast - by Production Analysis
- 9. Middle East Office Real Estate Industry Analysis, Insights and Forecast, 2019-2031
- 9.1. Market Analysis, Insights and Forecast - by Production Analysis
- 9.2. Market Analysis, Insights and Forecast - by Consumption Analysis
- 9.3. Market Analysis, Insights and Forecast - by Import Market Analysis (Value & Volume)
- 9.4. Market Analysis, Insights and Forecast - by Export Market Analysis (Value & Volume)
- 9.5. Market Analysis, Insights and Forecast - by Price Trend Analysis
- 9.1. Market Analysis, Insights and Forecast - by Production Analysis
- 10. United Arab Emirates Office Real Estate Industry Analysis, Insights and Forecast, 2019-2031
- 10.1. Market Analysis, Insights and Forecast - by Production Analysis
- 10.2. Market Analysis, Insights and Forecast - by Consumption Analysis
- 10.3. Market Analysis, Insights and Forecast - by Import Market Analysis (Value & Volume)
- 10.4. Market Analysis, Insights and Forecast - by Export Market Analysis (Value & Volume)
- 10.5. Market Analysis, Insights and Forecast - by Price Trend Analysis
- 10.1. Market Analysis, Insights and Forecast - by Production Analysis
- 11. Latin America Office Real Estate Industry Analysis, Insights and Forecast, 2019-2031
- 11.1. Market Analysis, Insights and Forecast - by Production Analysis
- 11.2. Market Analysis, Insights and Forecast - by Consumption Analysis
- 11.3. Market Analysis, Insights and Forecast - by Import Market Analysis (Value & Volume)
- 11.4. Market Analysis, Insights and Forecast - by Export Market Analysis (Value & Volume)
- 11.5. Market Analysis, Insights and Forecast - by Price Trend Analysis
- 11.1. Market Analysis, Insights and Forecast - by Production Analysis
- 12. Rest of the World Office Real Estate Industry Analysis, Insights and Forecast, 2019-2031
- 12.1. Market Analysis, Insights and Forecast - by Production Analysis
- 12.2. Market Analysis, Insights and Forecast - by Consumption Analysis
- 12.3. Market Analysis, Insights and Forecast - by Import Market Analysis (Value & Volume)
- 12.4. Market Analysis, Insights and Forecast - by Export Market Analysis (Value & Volume)
- 12.5. Market Analysis, Insights and Forecast - by Price Trend Analysis
- 12.1. Market Analysis, Insights and Forecast - by Production Analysis
- 13. North America Office Real Estate Industry Analysis, Insights and Forecast, 2019-2031
- 13.1. Market Analysis, Insights and Forecast - By Country/Sub-region
- 13.1.1 United States
- 13.1.2 Canada
- 13.1.3 Mexico
- 14. Europe Office Real Estate Industry Analysis, Insights and Forecast, 2019-2031
- 14.1. Market Analysis, Insights and Forecast - By Country/Sub-region
- 14.1.1 United Kingdom
- 14.1.2 France
- 14.1.3 Germany
- 14.1.4 Rest of Europe
- 15. Asia Pacific Office Real Estate Industry Analysis, Insights and Forecast, 2019-2031
- 15.1. Market Analysis, Insights and Forecast - By Country/Sub-region
- 15.1.1 China
- 15.1.2 India
- 15.1.3 Japan
- 15.1.4 South Korea
- 15.1.5 Rest of Asia Pacific
- 16. South America Office Real Estate Industry Analysis, Insights and Forecast, 2019-2031
- 16.1. Market Analysis, Insights and Forecast - By Country/Sub-region
- 16.1.1 Brazil
- 16.1.2 Argentina
- 16.1.3 Rest of South America
- 17. MEA Office Real Estate Industry Analysis, Insights and Forecast, 2019-2031
- 17.1. Market Analysis, Insights and Forecast - By Country/Sub-region
- 17.1.1 United Arab Emirates
- 17.1.2 Saudi Arabia
- 17.1.3 South Africa
- 17.1.4 Rest of Middle East and Africa
- 18. Competitive Analysis
- 18.1. Global Market Share Analysis 2024
- 18.2. Company Profiles
- 18.2.1 Cushman & Wakefield
- 18.2.1.1. Overview
- 18.2.1.2. Products
- 18.2.1.3. SWOT Analysis
- 18.2.1.4. Recent Developments
- 18.2.1.5. Financials (Based on Availability)
- 18.2.2 Hines
- 18.2.2.1. Overview
- 18.2.2.2. Products
- 18.2.2.3. SWOT Analysis
- 18.2.2.4. Recent Developments
- 18.2.2.5. Financials (Based on Availability)
- 18.2.3 Buckingham Properties
- 18.2.3.1. Overview
- 18.2.3.2. Products
- 18.2.3.3. SWOT Analysis
- 18.2.3.4. Recent Developments
- 18.2.3.5. Financials (Based on Availability)
- 18.2.4 Colliers International
- 18.2.4.1. Overview
- 18.2.4.2. Products
- 18.2.4.3. SWOT Analysis
- 18.2.4.4. Recent Developments
- 18.2.4.5. Financials (Based on Availability)
- 18.2.5 China Evergrande Group
- 18.2.5.1. Overview
- 18.2.5.2. Products
- 18.2.5.3. SWOT Analysis
- 18.2.5.4. Recent Developments
- 18.2.5.5. Financials (Based on Availability)
- 18.2.6 Delhi Land & Finance
- 18.2.6.1. Overview
- 18.2.6.2. Products
- 18.2.6.3. SWOT Analysis
- 18.2.6.4. Recent Developments
- 18.2.6.5. Financials (Based on Availability)
- 18.2.7 JLL
- 18.2.7.1. Overview
- 18.2.7.2. Products
- 18.2.7.3. SWOT Analysis
- 18.2.7.4. Recent Developments
- 18.2.7.5. Financials (Based on Availability)
- 18.2.8 Skanska
- 18.2.8.1. Overview
- 18.2.8.2. Products
- 18.2.8.3. SWOT Analysis
- 18.2.8.4. Recent Developments
- 18.2.8.5. Financials (Based on Availability)
- 18.2.1 Cushman & Wakefield
List of Figures
- Figure 1: Global Office Real Estate Industry Revenue Breakdown (Million, %) by Region 2024 & 2032
- Figure 2: North America Office Real Estate Industry Revenue (Million), by Country 2024 & 2032
- Figure 3: North America Office Real Estate Industry Revenue Share (%), by Country 2024 & 2032
- Figure 4: Europe Office Real Estate Industry Revenue (Million), by Country 2024 & 2032
- Figure 5: Europe Office Real Estate Industry Revenue Share (%), by Country 2024 & 2032
- Figure 6: Asia Pacific Office Real Estate Industry Revenue (Million), by Country 2024 & 2032
- Figure 7: Asia Pacific Office Real Estate Industry Revenue Share (%), by Country 2024 & 2032
- Figure 8: South America Office Real Estate Industry Revenue (Million), by Country 2024 & 2032
- Figure 9: South America Office Real Estate Industry Revenue Share (%), by Country 2024 & 2032
- Figure 10: MEA Office Real Estate Industry Revenue (Million), by Country 2024 & 2032
- Figure 11: MEA Office Real Estate Industry Revenue Share (%), by Country 2024 & 2032
- Figure 12: North America Office Real Estate Industry Revenue (Million), by Production Analysis 2024 & 2032
- Figure 13: North America Office Real Estate Industry Revenue Share (%), by Production Analysis 2024 & 2032
- Figure 14: North America Office Real Estate Industry Revenue (Million), by Consumption Analysis 2024 & 2032
- Figure 15: North America Office Real Estate Industry Revenue Share (%), by Consumption Analysis 2024 & 2032
- Figure 16: North America Office Real Estate Industry Revenue (Million), by Import Market Analysis (Value & Volume) 2024 & 2032
- Figure 17: North America Office Real Estate Industry Revenue Share (%), by Import Market Analysis (Value & Volume) 2024 & 2032
- Figure 18: North America Office Real Estate Industry Revenue (Million), by Export Market Analysis (Value & Volume) 2024 & 2032
- Figure 19: North America Office Real Estate Industry Revenue Share (%), by Export Market Analysis (Value & Volume) 2024 & 2032
- Figure 20: North America Office Real Estate Industry Revenue (Million), by Price Trend Analysis 2024 & 2032
- Figure 21: North America Office Real Estate Industry Revenue Share (%), by Price Trend Analysis 2024 & 2032
- Figure 22: North America Office Real Estate Industry Revenue (Million), by Country 2024 & 2032
- Figure 23: North America Office Real Estate Industry Revenue Share (%), by Country 2024 & 2032
- Figure 24: Europe Office Real Estate Industry Revenue (Million), by Production Analysis 2024 & 2032
- Figure 25: Europe Office Real Estate Industry Revenue Share (%), by Production Analysis 2024 & 2032
- Figure 26: Europe Office Real Estate Industry Revenue (Million), by Consumption Analysis 2024 & 2032
- Figure 27: Europe Office Real Estate Industry Revenue Share (%), by Consumption Analysis 2024 & 2032
- Figure 28: Europe Office Real Estate Industry Revenue (Million), by Import Market Analysis (Value & Volume) 2024 & 2032
- Figure 29: Europe Office Real Estate Industry Revenue Share (%), by Import Market Analysis (Value & Volume) 2024 & 2032
- Figure 30: Europe Office Real Estate Industry Revenue (Million), by Export Market Analysis (Value & Volume) 2024 & 2032
- Figure 31: Europe Office Real Estate Industry Revenue Share (%), by Export Market Analysis (Value & Volume) 2024 & 2032
- Figure 32: Europe Office Real Estate Industry Revenue (Million), by Price Trend Analysis 2024 & 2032
- Figure 33: Europe Office Real Estate Industry Revenue Share (%), by Price Trend Analysis 2024 & 2032
- Figure 34: Europe Office Real Estate Industry Revenue (Million), by Country 2024 & 2032
- Figure 35: Europe Office Real Estate Industry Revenue Share (%), by Country 2024 & 2032
- Figure 36: Asia Pacific Office Real Estate Industry Revenue (Million), by Production Analysis 2024 & 2032
- Figure 37: Asia Pacific Office Real Estate Industry Revenue Share (%), by Production Analysis 2024 & 2032
- Figure 38: Asia Pacific Office Real Estate Industry Revenue (Million), by Consumption Analysis 2024 & 2032
- Figure 39: Asia Pacific Office Real Estate Industry Revenue Share (%), by Consumption Analysis 2024 & 2032
- Figure 40: Asia Pacific Office Real Estate Industry Revenue (Million), by Import Market Analysis (Value & Volume) 2024 & 2032
- Figure 41: Asia Pacific Office Real Estate Industry Revenue Share (%), by Import Market Analysis (Value & Volume) 2024 & 2032
- Figure 42: Asia Pacific Office Real Estate Industry Revenue (Million), by Export Market Analysis (Value & Volume) 2024 & 2032
- Figure 43: Asia Pacific Office Real Estate Industry Revenue Share (%), by Export Market Analysis (Value & Volume) 2024 & 2032
- Figure 44: Asia Pacific Office Real Estate Industry Revenue (Million), by Price Trend Analysis 2024 & 2032
- Figure 45: Asia Pacific Office Real Estate Industry Revenue Share (%), by Price Trend Analysis 2024 & 2032
- Figure 46: Asia Pacific Office Real Estate Industry Revenue (Million), by Country 2024 & 2032
- Figure 47: Asia Pacific Office Real Estate Industry Revenue Share (%), by Country 2024 & 2032
- Figure 48: Middle East Office Real Estate Industry Revenue (Million), by Production Analysis 2024 & 2032
- Figure 49: Middle East Office Real Estate Industry Revenue Share (%), by Production Analysis 2024 & 2032
- Figure 50: Middle East Office Real Estate Industry Revenue (Million), by Consumption Analysis 2024 & 2032
- Figure 51: Middle East Office Real Estate Industry Revenue Share (%), by Consumption Analysis 2024 & 2032
- Figure 52: Middle East Office Real Estate Industry Revenue (Million), by Import Market Analysis (Value & Volume) 2024 & 2032
- Figure 53: Middle East Office Real Estate Industry Revenue Share (%), by Import Market Analysis (Value & Volume) 2024 & 2032
- Figure 54: Middle East Office Real Estate Industry Revenue (Million), by Export Market Analysis (Value & Volume) 2024 & 2032
- Figure 55: Middle East Office Real Estate Industry Revenue Share (%), by Export Market Analysis (Value & Volume) 2024 & 2032
- Figure 56: Middle East Office Real Estate Industry Revenue (Million), by Price Trend Analysis 2024 & 2032
- Figure 57: Middle East Office Real Estate Industry Revenue Share (%), by Price Trend Analysis 2024 & 2032
- Figure 58: Middle East Office Real Estate Industry Revenue (Million), by Country 2024 & 2032
- Figure 59: Middle East Office Real Estate Industry Revenue Share (%), by Country 2024 & 2032
- Figure 60: United Arab Emirates Office Real Estate Industry Revenue (Million), by Production Analysis 2024 & 2032
- Figure 61: United Arab Emirates Office Real Estate Industry Revenue Share (%), by Production Analysis 2024 & 2032
- Figure 62: United Arab Emirates Office Real Estate Industry Revenue (Million), by Consumption Analysis 2024 & 2032
- Figure 63: United Arab Emirates Office Real Estate Industry Revenue Share (%), by Consumption Analysis 2024 & 2032
- Figure 64: United Arab Emirates Office Real Estate Industry Revenue (Million), by Import Market Analysis (Value & Volume) 2024 & 2032
- Figure 65: United Arab Emirates Office Real Estate Industry Revenue Share (%), by Import Market Analysis (Value & Volume) 2024 & 2032
- Figure 66: United Arab Emirates Office Real Estate Industry Revenue (Million), by Export Market Analysis (Value & Volume) 2024 & 2032
- Figure 67: United Arab Emirates Office Real Estate Industry Revenue Share (%), by Export Market Analysis (Value & Volume) 2024 & 2032
- Figure 68: United Arab Emirates Office Real Estate Industry Revenue (Million), by Price Trend Analysis 2024 & 2032
- Figure 69: United Arab Emirates Office Real Estate Industry Revenue Share (%), by Price Trend Analysis 2024 & 2032
- Figure 70: United Arab Emirates Office Real Estate Industry Revenue (Million), by Country 2024 & 2032
- Figure 71: United Arab Emirates Office Real Estate Industry Revenue Share (%), by Country 2024 & 2032
- Figure 72: Latin America Office Real Estate Industry Revenue (Million), by Production Analysis 2024 & 2032
- Figure 73: Latin America Office Real Estate Industry Revenue Share (%), by Production Analysis 2024 & 2032
- Figure 74: Latin America Office Real Estate Industry Revenue (Million), by Consumption Analysis 2024 & 2032
- Figure 75: Latin America Office Real Estate Industry Revenue Share (%), by Consumption Analysis 2024 & 2032
- Figure 76: Latin America Office Real Estate Industry Revenue (Million), by Import Market Analysis (Value & Volume) 2024 & 2032
- Figure 77: Latin America Office Real Estate Industry Revenue Share (%), by Import Market Analysis (Value & Volume) 2024 & 2032
- Figure 78: Latin America Office Real Estate Industry Revenue (Million), by Export Market Analysis (Value & Volume) 2024 & 2032
- Figure 79: Latin America Office Real Estate Industry Revenue Share (%), by Export Market Analysis (Value & Volume) 2024 & 2032
- Figure 80: Latin America Office Real Estate Industry Revenue (Million), by Price Trend Analysis 2024 & 2032
- Figure 81: Latin America Office Real Estate Industry Revenue Share (%), by Price Trend Analysis 2024 & 2032
- Figure 82: Latin America Office Real Estate Industry Revenue (Million), by Country 2024 & 2032
- Figure 83: Latin America Office Real Estate Industry Revenue Share (%), by Country 2024 & 2032
- Figure 84: Rest of the World Office Real Estate Industry Revenue (Million), by Production Analysis 2024 & 2032
- Figure 85: Rest of the World Office Real Estate Industry Revenue Share (%), by Production Analysis 2024 & 2032
- Figure 86: Rest of the World Office Real Estate Industry Revenue (Million), by Consumption Analysis 2024 & 2032
- Figure 87: Rest of the World Office Real Estate Industry Revenue Share (%), by Consumption Analysis 2024 & 2032
- Figure 88: Rest of the World Office Real Estate Industry Revenue (Million), by Import Market Analysis (Value & Volume) 2024 & 2032
- Figure 89: Rest of the World Office Real Estate Industry Revenue Share (%), by Import Market Analysis (Value & Volume) 2024 & 2032
- Figure 90: Rest of the World Office Real Estate Industry Revenue (Million), by Export Market Analysis (Value & Volume) 2024 & 2032
- Figure 91: Rest of the World Office Real Estate Industry Revenue Share (%), by Export Market Analysis (Value & Volume) 2024 & 2032
- Figure 92: Rest of the World Office Real Estate Industry Revenue (Million), by Price Trend Analysis 2024 & 2032
- Figure 93: Rest of the World Office Real Estate Industry Revenue Share (%), by Price Trend Analysis 2024 & 2032
- Figure 94: Rest of the World Office Real Estate Industry Revenue (Million), by Country 2024 & 2032
- Figure 95: Rest of the World Office Real Estate Industry Revenue Share (%), by Country 2024 & 2032
List of Tables
- Table 1: Global Office Real Estate Industry Revenue Million Forecast, by Region 2019 & 2032
- Table 2: Global Office Real Estate Industry Revenue Million Forecast, by Production Analysis 2019 & 2032
- Table 3: Global Office Real Estate Industry Revenue Million Forecast, by Consumption Analysis 2019 & 2032
- Table 4: Global Office Real Estate Industry Revenue Million Forecast, by Import Market Analysis (Value & Volume) 2019 & 2032
- Table 5: Global Office Real Estate Industry Revenue Million Forecast, by Export Market Analysis (Value & Volume) 2019 & 2032
- Table 6: Global Office Real Estate Industry Revenue Million Forecast, by Price Trend Analysis 2019 & 2032
- Table 7: Global Office Real Estate Industry Revenue Million Forecast, by Region 2019 & 2032
- Table 8: Global Office Real Estate Industry Revenue Million Forecast, by Country 2019 & 2032
- Table 9: United States Office Real Estate Industry Revenue (Million) Forecast, by Application 2019 & 2032
- Table 10: Canada Office Real Estate Industry Revenue (Million) Forecast, by Application 2019 & 2032
- Table 11: Mexico Office Real Estate Industry Revenue (Million) Forecast, by Application 2019 & 2032
- Table 12: Global Office Real Estate Industry Revenue Million Forecast, by Country 2019 & 2032
- Table 13: United Kingdom Office Real Estate Industry Revenue (Million) Forecast, by Application 2019 & 2032
- Table 14: France Office Real Estate Industry Revenue (Million) Forecast, by Application 2019 & 2032
- Table 15: Germany Office Real Estate Industry Revenue (Million) Forecast, by Application 2019 & 2032
- Table 16: Rest of Europe Office Real Estate Industry Revenue (Million) Forecast, by Application 2019 & 2032
- Table 17: Global Office Real Estate Industry Revenue Million Forecast, by Country 2019 & 2032
- Table 18: China Office Real Estate Industry Revenue (Million) Forecast, by Application 2019 & 2032
- Table 19: India Office Real Estate Industry Revenue (Million) Forecast, by Application 2019 & 2032
- Table 20: Japan Office Real Estate Industry Revenue (Million) Forecast, by Application 2019 & 2032
- Table 21: South Korea Office Real Estate Industry Revenue (Million) Forecast, by Application 2019 & 2032
- Table 22: Rest of Asia Pacific Office Real Estate Industry Revenue (Million) Forecast, by Application 2019 & 2032
- Table 23: Global Office Real Estate Industry Revenue Million Forecast, by Country 2019 & 2032
- Table 24: Brazil Office Real Estate Industry Revenue (Million) Forecast, by Application 2019 & 2032
- Table 25: Argentina Office Real Estate Industry Revenue (Million) Forecast, by Application 2019 & 2032
- Table 26: Rest of South America Office Real Estate Industry Revenue (Million) Forecast, by Application 2019 & 2032
- Table 27: Global Office Real Estate Industry Revenue Million Forecast, by Country 2019 & 2032
- Table 28: United Arab Emirates Office Real Estate Industry Revenue (Million) Forecast, by Application 2019 & 2032
- Table 29: Saudi Arabia Office Real Estate Industry Revenue (Million) Forecast, by Application 2019 & 2032
- Table 30: South Africa Office Real Estate Industry Revenue (Million) Forecast, by Application 2019 & 2032
- Table 31: Rest of Middle East and Africa Office Real Estate Industry Revenue (Million) Forecast, by Application 2019 & 2032
- Table 32: Global Office Real Estate Industry Revenue Million Forecast, by Production Analysis 2019 & 2032
- Table 33: Global Office Real Estate Industry Revenue Million Forecast, by Consumption Analysis 2019 & 2032
- Table 34: Global Office Real Estate Industry Revenue Million Forecast, by Import Market Analysis (Value & Volume) 2019 & 2032
- Table 35: Global Office Real Estate Industry Revenue Million Forecast, by Export Market Analysis (Value & Volume) 2019 & 2032
- Table 36: Global Office Real Estate Industry Revenue Million Forecast, by Price Trend Analysis 2019 & 2032
- Table 37: Global Office Real Estate Industry Revenue Million Forecast, by Country 2019 & 2032
- Table 38: United States Office Real Estate Industry Revenue (Million) Forecast, by Application 2019 & 2032
- Table 39: Canada Office Real Estate Industry Revenue (Million) Forecast, by Application 2019 & 2032
- Table 40: Mexico Office Real Estate Industry Revenue (Million) Forecast, by Application 2019 & 2032
- Table 41: Global Office Real Estate Industry Revenue Million Forecast, by Production Analysis 2019 & 2032
- Table 42: Global Office Real Estate Industry Revenue Million Forecast, by Consumption Analysis 2019 & 2032
- Table 43: Global Office Real Estate Industry Revenue Million Forecast, by Import Market Analysis (Value & Volume) 2019 & 2032
- Table 44: Global Office Real Estate Industry Revenue Million Forecast, by Export Market Analysis (Value & Volume) 2019 & 2032
- Table 45: Global Office Real Estate Industry Revenue Million Forecast, by Price Trend Analysis 2019 & 2032
- Table 46: Global Office Real Estate Industry Revenue Million Forecast, by Country 2019 & 2032
- Table 47: United Kingdom Office Real Estate Industry Revenue (Million) Forecast, by Application 2019 & 2032
- Table 48: France Office Real Estate Industry Revenue (Million) Forecast, by Application 2019 & 2032
- Table 49: Germany Office Real Estate Industry Revenue (Million) Forecast, by Application 2019 & 2032
- Table 50: Rest of Europe Office Real Estate Industry Revenue (Million) Forecast, by Application 2019 & 2032
- Table 51: Global Office Real Estate Industry Revenue Million Forecast, by Production Analysis 2019 & 2032
- Table 52: Global Office Real Estate Industry Revenue Million Forecast, by Consumption Analysis 2019 & 2032
- Table 53: Global Office Real Estate Industry Revenue Million Forecast, by Import Market Analysis (Value & Volume) 2019 & 2032
- Table 54: Global Office Real Estate Industry Revenue Million Forecast, by Export Market Analysis (Value & Volume) 2019 & 2032
- Table 55: Global Office Real Estate Industry Revenue Million Forecast, by Price Trend Analysis 2019 & 2032
- Table 56: Global Office Real Estate Industry Revenue Million Forecast, by Country 2019 & 2032
- Table 57: China Office Real Estate Industry Revenue (Million) Forecast, by Application 2019 & 2032
- Table 58: India Office Real Estate Industry Revenue (Million) Forecast, by Application 2019 & 2032
- Table 59: Japan Office Real Estate Industry Revenue (Million) Forecast, by Application 2019 & 2032
- Table 60: South Korea Office Real Estate Industry Revenue (Million) Forecast, by Application 2019 & 2032
- Table 61: Rest of Asia Pacific Office Real Estate Industry Revenue (Million) Forecast, by Application 2019 & 2032
- Table 62: Global Office Real Estate Industry Revenue Million Forecast, by Production Analysis 2019 & 2032
- Table 63: Global Office Real Estate Industry Revenue Million Forecast, by Consumption Analysis 2019 & 2032
- Table 64: Global Office Real Estate Industry Revenue Million Forecast, by Import Market Analysis (Value & Volume) 2019 & 2032
- Table 65: Global Office Real Estate Industry Revenue Million Forecast, by Export Market Analysis (Value & Volume) 2019 & 2032
- Table 66: Global Office Real Estate Industry Revenue Million Forecast, by Price Trend Analysis 2019 & 2032
- Table 67: Global Office Real Estate Industry Revenue Million Forecast, by Country 2019 & 2032
- Table 68: Global Office Real Estate Industry Revenue Million Forecast, by Production Analysis 2019 & 2032
- Table 69: Global Office Real Estate Industry Revenue Million Forecast, by Consumption Analysis 2019 & 2032
- Table 70: Global Office Real Estate Industry Revenue Million Forecast, by Import Market Analysis (Value & Volume) 2019 & 2032
- Table 71: Global Office Real Estate Industry Revenue Million Forecast, by Export Market Analysis (Value & Volume) 2019 & 2032
- Table 72: Global Office Real Estate Industry Revenue Million Forecast, by Price Trend Analysis 2019 & 2032
- Table 73: Global Office Real Estate Industry Revenue Million Forecast, by Country 2019 & 2032
- Table 74: Saudi Arabia Office Real Estate Industry Revenue (Million) Forecast, by Application 2019 & 2032
- Table 75: South Africa Office Real Estate Industry Revenue (Million) Forecast, by Application 2019 & 2032
- Table 76: Rest of Middle East Office Real Estate Industry Revenue (Million) Forecast, by Application 2019 & 2032
- Table 77: Global Office Real Estate Industry Revenue Million Forecast, by Production Analysis 2019 & 2032
- Table 78: Global Office Real Estate Industry Revenue Million Forecast, by Consumption Analysis 2019 & 2032
- Table 79: Global Office Real Estate Industry Revenue Million Forecast, by Import Market Analysis (Value & Volume) 2019 & 2032
- Table 80: Global Office Real Estate Industry Revenue Million Forecast, by Export Market Analysis (Value & Volume) 2019 & 2032
- Table 81: Global Office Real Estate Industry Revenue Million Forecast, by Price Trend Analysis 2019 & 2032
- Table 82: Global Office Real Estate Industry Revenue Million Forecast, by Country 2019 & 2032
- Table 83: Brazil Office Real Estate Industry Revenue (Million) Forecast, by Application 2019 & 2032
- Table 84: Argentina Office Real Estate Industry Revenue (Million) Forecast, by Application 2019 & 2032
- Table 85: Rest of Latin America Office Real Estate Industry Revenue (Million) Forecast, by Application 2019 & 2032
- Table 86: Global Office Real Estate Industry Revenue Million Forecast, by Production Analysis 2019 & 2032
- Table 87: Global Office Real Estate Industry Revenue Million Forecast, by Consumption Analysis 2019 & 2032
- Table 88: Global Office Real Estate Industry Revenue Million Forecast, by Import Market Analysis (Value & Volume) 2019 & 2032
- Table 89: Global Office Real Estate Industry Revenue Million Forecast, by Export Market Analysis (Value & Volume) 2019 & 2032
- Table 90: Global Office Real Estate Industry Revenue Million Forecast, by Price Trend Analysis 2019 & 2032
- Table 91: Global Office Real Estate Industry Revenue Million Forecast, by Country 2019 & 2032
Frequently Asked Questions
1. What is the projected Compound Annual Growth Rate (CAGR) of the Office Real Estate Industry?
The projected CAGR is approximately > 5.17%.
2. Which companies are prominent players in the Office Real Estate Industry?
Key companies in the market include Cushman & Wakefield, Hines, Buckingham Properties, Colliers International, China Evergrande Group, Delhi Land & Finance, JLL, Skanska.
3. What are the main segments of the Office Real Estate Industry?
The market segments include Production Analysis, Consumption Analysis, Import Market Analysis (Value & Volume), Export Market Analysis (Value & Volume), Price Trend Analysis.
4. Can you provide details about the market size?
The market size is estimated to be USD 2.10 Million as of 2022.
5. What are some drivers contributing to market growth?
Office Leasing Volume is Witnessing Significant Growth; Increasing Rental Prices of Office Spaces.
6. What are the notable trends driving market growth?
Rise in Demand for Coworking Spaces.
7. Are there any restraints impacting market growth?
Remote Work and Hybrid Models; High vacancy rates can be a significant challenge in the office market.
8. Can you provide examples of recent developments in the market?
N/A
9. What pricing options are available for accessing the report?
Pricing options include single-user, multi-user, and enterprise licenses priced at USD 4750, USD 5250, and USD 8750 respectively.
10. Is the market size provided in terms of value or volume?
The market size is provided in terms of value, measured in Million.
11. Are there any specific market keywords associated with the report?
Yes, the market keyword associated with the report is "Office Real Estate Industry," which aids in identifying and referencing the specific market segment covered.
12. How do I determine which pricing option suits my needs best?
The pricing options vary based on user requirements and access needs. Individual users may opt for single-user licenses, while businesses requiring broader access may choose multi-user or enterprise licenses for cost-effective access to the report.
13. Are there any additional resources or data provided in the Office Real Estate Industry report?
While the report offers comprehensive insights, it's advisable to review the specific contents or supplementary materials provided to ascertain if additional resources or data are available.
14. How can I stay updated on further developments or reports in the Office Real Estate Industry?
To stay informed about further developments, trends, and reports in the Office Real Estate Industry, consider subscribing to industry newsletters, following relevant companies and organizations, or regularly checking reputable industry news sources and publications.
Methodology
Step 1 - Identification of Relevant Samples Size from Population Database


Step 2 - Approaches for Defining Global Market Size (Value, Volume* & Price*)

Note*: In applicable scenarios
Step 3 - Data Sources
Primary Research
- Web Analytics
- Survey Reports
- Research Institute
- Latest Research Reports
- Opinion Leaders
Secondary Research
- Annual Reports
- White Paper
- Latest Press Release
- Industry Association
- Paid Database
- Investor Presentations

Step 4 - Data Triangulation
Involves using different sources of information in order to increase the validity of a study
These sources are likely to be stakeholders in a program - participants, other researchers, program staff, other community members, and so on.
Then we put all data in single framework & apply various statistical tools to find out the dynamic on the market.
During the analysis stage, feedback from the stakeholder groups would be compared to determine areas of agreement as well as areas of divergence


