

Key Insights
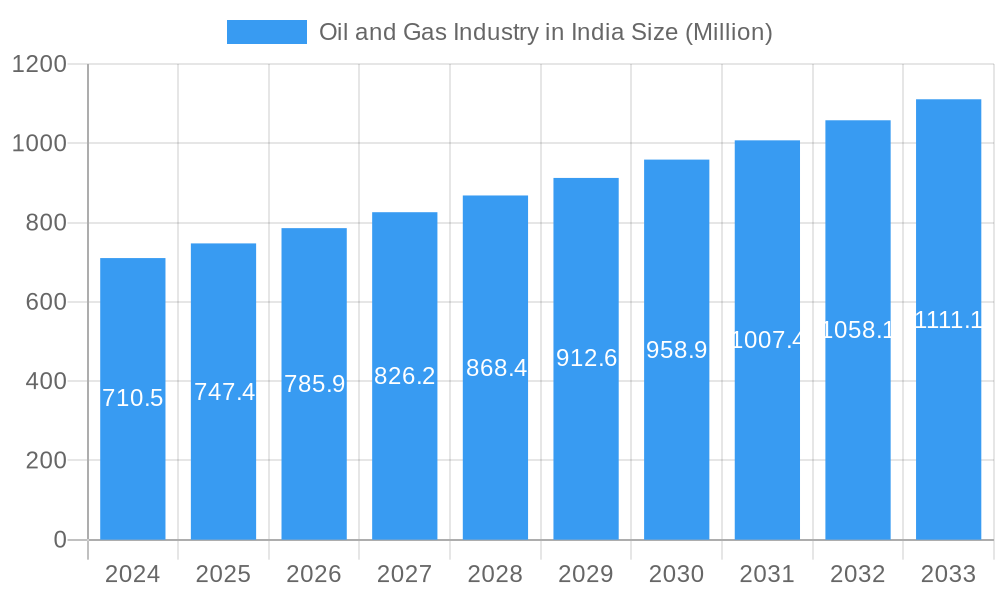
The Indian Oil and Gas Industry is poised for significant expansion, driven by robust demand and strategic government initiatives aimed at energy security and economic growth. In 2024, the market size is estimated at approximately 710.5 million (USD million), with a projected Compound Annual Growth Rate (CAGR) of 5.23% over the forecast period of 2025-2033. This growth is underpinned by increasing per capita energy consumption, a burgeoning industrial sector, and the government's focus on expanding refining capacities and petrochemical production. Key drivers include rising domestic energy needs, the development of new exploration blocks, and investments in infrastructure for transportation, storage, and Liquefied Natural Gas (LNG) terminals. The upstream segment, encompassing onshore and offshore exploration and production, will see enhanced activity as companies strive to boost domestic output. Simultaneously, the downstream sector, comprising refineries and petrochemical plants, is set for modernization and expansion to meet the growing demand for refined products and downstream chemicals. Midstream operations, particularly the expansion of pipeline networks and storage facilities, are crucial for efficient energy distribution and are thus expected to witness substantial investment.
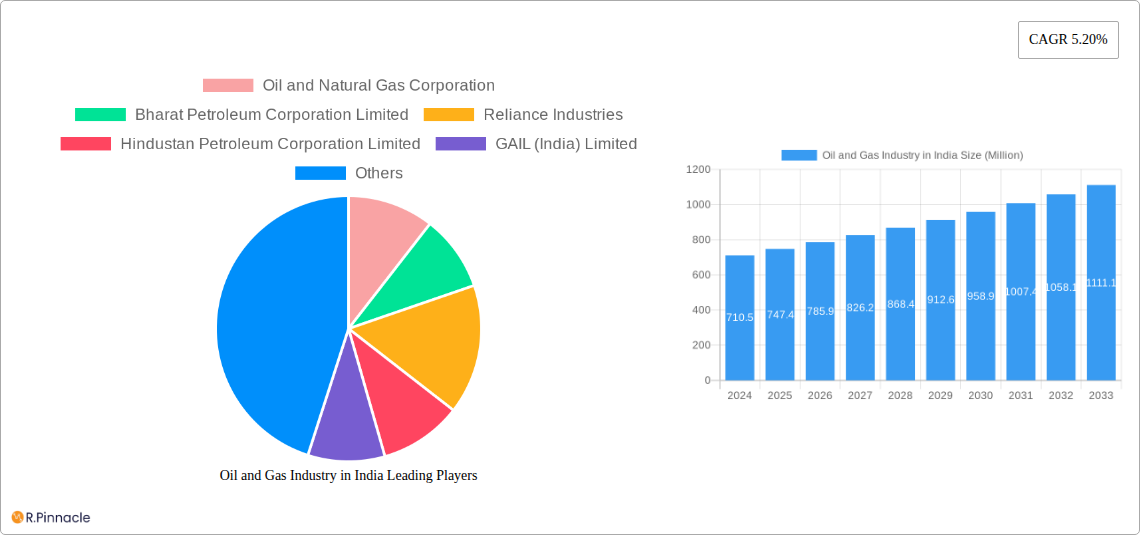
Oil and Gas Industry in India Market Size (In Million)
The Indian Oil and Gas Industry's trajectory is further shaped by evolving global energy dynamics and domestic policy shifts. While strong demand forms a primary growth catalyst, the industry also faces challenges such as price volatility of crude oil, increasing competition from renewable energy sources, and the imperative to adopt cleaner technologies to mitigate environmental impact. Regulatory frameworks, designed to encourage foreign investment and domestic participation, are also influencing the market landscape. Major players like Indian Oil Corporation Limited, Bharat Petroleum Corporation Limited, and Reliance Industries are actively involved in capacity expansion, technological upgrades, and strategic collaborations to capitalize on the market's potential. The geographical distribution of operations spans across various regions within India, with a particular emphasis on enhancing capabilities in established industrial hubs and exploring new frontiers for resource discovery. The industry's ability to navigate these complex factors will determine its sustained growth and contribution to India's economic development.
Oil and Gas Industry in India Company Market Share
India Oil and Gas Industry Market Analysis: Growth, Trends, and Opportunities (2019-2033)
Report Description: Gain unparalleled insights into the dynamic Indian oil and gas industry with this comprehensive market analysis. Spanning the historical period of 2019-2024 and projecting future growth through 2033, this report leverages high-ranking keywords for maximum search visibility. It delivers actionable intelligence for industry professionals, investors, and stakeholders, meticulously detailing market structure, growth drivers, dominant regions, product innovations, key players, and future outlook.
This in-depth study, using a base year of 2025 and an estimated year of 2025, meticulously dissects the Indian oil and gas market, providing granular analysis of the upstream, downstream, and midstream segments. Explore critical industry developments, including significant investments by Indian Oil Corporation Ltd. and expansion plans by Adani Total Gas Ltd (ATGL). Understand the competitive landscape featuring giants like Oil and Natural Gas Corporation, Bharat Petroleum Corporation Limited, Reliance Industries, Hindustan Petroleum Corporation Limited, GAIL (India) Limited, Oil India Limited, Cairn India, and Punj Lloyd Limited.
Whether you are seeking to understand India's energy security, petroleum refining trends, natural gas infrastructure development, or petrochemical market growth, this report is an indispensable resource. Discover the latest innovation trends, regulatory frameworks, and M&A activities shaping the Indian energy sector. Unlock strategic opportunities and navigate the challenges within this vital industry.
Oil and Gas Industry in India Market Structure & Innovation Trends
The Indian oil and gas industry exhibits a moderately concentrated market structure, dominated by a few key public sector undertakings and increasingly by private players. Innovation drivers are primarily centered around efficiency improvements in exploration and production, advancements in refining technologies to meet stringent fuel quality norms, and the development of cleaner energy solutions. Regulatory frameworks, while evolving, continue to play a significant role in shaping market dynamics, including pricing mechanisms, licensing, and environmental compliance. The threat of product substitutes, particularly from renewable energy sources, is growing, influencing strategic long-term planning. End-user demographics are diverse, ranging from industrial consumers and transportation sectors to residential use of cooking gas. Mergers and acquisition (M&A) activities have been selective, often focused on acquiring specific capabilities or market access. For instance, the acquisition of smaller exploration blocks by larger entities or consolidation within the downstream distribution network to achieve economies of scale. The overall market share of the top five companies is estimated to be around 65-70%. M&A deal values have fluctuated, with significant transactions in the downstream and midstream sectors, potentially reaching several hundred million dollars for substantial asset acquisitions.
Oil and Gas Industry in India Market Dynamics & Trends
The Indian oil and gas industry is experiencing robust growth, driven by a burgeoning economy, increasing population, and rising energy demand across various sectors. The market is projected to witness a Compound Annual Growth Rate (CAGR) of approximately 5-7% over the forecast period. Technological disruptions are profoundly reshaping the industry, with a strong emphasis on digitalization, AI, and advanced analytics for enhanced exploration success rates, optimized refinery operations, and predictive maintenance in pipelines. Innovations in enhanced oil recovery (EOR) techniques are crucial for maximizing yields from mature fields. Furthermore, the push towards cleaner fuels and the expansion of natural gas infrastructure, including City Gas Distribution (CGD) networks, are significant trends. Consumer preferences are shifting towards cleaner and more convenient energy sources, evident in the growing adoption of piped natural gas and LPG. The competitive dynamics are intensifying, with both public sector undertakings (PSUs) and private players vying for market share. PSUs like Indian Oil Corporation Limited, ONGC, and BPCL continue to hold substantial market presence, while private entities such as Reliance Industries and Adani Total Gas are aggressively expanding their footprint, particularly in the downstream and CGD segments. The government's focus on reducing import dependence and promoting domestic production is a key factor influencing market penetration of various energy sources. The downstream sector, encompassing refining and petrochemicals, is witnessing substantial investments aimed at increasing capacity and upgrading facilities to produce higher-value products. The midstream sector, vital for transportation and storage, is also expanding with new pipeline projects and LNG terminal developments to support the growing demand for natural gas. This evolving landscape presents both opportunities and challenges for market participants aiming to capitalize on India's expanding energy needs. The increasing adoption of electric vehicles is a nascent but growing trend that could impact long-term fuel demand in the transportation sector, prompting strategic diversification by some companies.
Dominant Regions & Segments in Oil and Gas Industry in India
The Indian oil and gas industry's dominance is shaped by a confluence of geological factors, existing infrastructure, government policies, and market demand.
Upstream:
- Onshore Deployment: Regions with significant proven hydrocarbon reserves, particularly in the Western offshore basins and Assam-Arakan basin, continue to be dominant for onshore exploration and production. The exploration efforts are increasingly focused on unconventional resources like shale gas and coalbed methane.
- Offshore Deployment: The Western Offshore region, encompassing fields like Mumbai High, remains the bedrock of India's offshore oil and gas production. The Eastern Offshore, with discoveries in the Krishna Godavari and Cauvery basins, is also a crucial contributor and a focus for future growth.
- Key Drivers: Favorable geological conditions, proximity to refining centers, government incentives for exploration, and technological advancements in deep-water exploration contribute to the dominance of these regions.
Downstream:
- Refineries: Major refining hubs are strategically located along the coastlines to facilitate crude oil imports and product exports, and also in close proximity to major consumption centers. States like Gujarat, Maharashtra, and Tamil Nadu house a significant number of large-scale refineries.
- Petrochemical Plants: The development of integrated refinery-cum-petrochemical complexes is a key trend, driving growth in this segment. These are often co-located with major refining facilities to leverage feedstock availability and infrastructure.
- Key Drivers: High domestic demand for refined products and petrochemical intermediates, government policies supporting refinery upgrades and capacity expansion, and access to ports for crude oil import are pivotal.
Midstream:
- Transportation: The extensive network of oil and gas pipelines crisscrossing the country is crucial. Major pipeline corridors connect production sites to refineries, demand centers, and import terminals.
- Storage: Storage infrastructure, including tank farms at refineries, import terminals, and strategic reserves, is vital for ensuring energy security and managing supply-demand fluctuations.
- LNG Terminals: Coastal regions, particularly in Gujarat and Maharashtra, are dominant for Liquefied Natural Gas (LNG) terminals due to their role in importing natural gas and supplying it to the growing CGD network and industrial consumers.
- Key Drivers: The need for efficient and secure transportation of hydrocarbons, government initiatives to expand natural gas usage, and the strategic importance of import terminals for meeting energy demands drive the dominance of these midstream operations.
The interplay of these factors, coupled with ongoing investments and policy support, dictates the regional and segmental dominance within India's oil and gas landscape.
Oil and Gas Industry in India Product Innovations
Product innovations in the Indian oil and gas sector are increasingly focused on improving fuel efficiency, reducing emissions, and developing value-added petrochemical derivatives. Advances in refining technologies enable the production of cleaner fuels like BS-VI compliant gasoline and diesel, meeting stringent environmental norms. In the petrochemical sphere, there is a growing emphasis on developing specialized polymers and chemicals for high-growth sectors like automotive, packaging, and construction. The exploration and production segment is witnessing innovations in materials science for drilling equipment and enhanced recovery techniques to optimize hydrocarbon extraction from existing reserves. These innovations offer competitive advantages by improving operational efficiency, meeting evolving regulatory requirements, and catering to niche market demands.
Report Scope & Segmentation Analysis
This report provides a comprehensive analysis of the Indian oil and gas industry, segmented across key operational areas.
Upstream: This segment encompasses exploration, development, and production of crude oil and natural gas. It is further divided by Location of Deployment, including Onshore operations characterized by significant existing infrastructure and ongoing exploration in mature basins, and Offshore operations, focusing on deeper waters and complex geological formations. Growth projections for the upstream segment are tied to new discoveries and enhanced recovery techniques, with a market size estimated to reach approximately USD 30-40 billion by 2033.
Downstream: This segment covers refining of crude oil into various petroleum products and the production of petrochemicals. Key sub-segments include Refineries, which are undergoing modernization and capacity expansion to meet rising fuel demand and environmental standards, and Petrochemical Plants, which are increasingly integrated with refineries to produce a wide range of chemicals. The downstream market is projected to grow significantly, driven by fuel demand and the burgeoning petrochemical industry, with an estimated market size of USD 150-180 billion by 2033.
Midstream: This segment focuses on the transportation, storage, and distribution of oil and gas. It includes Transportation via pipelines and tankers, Storage facilities like tank farms and strategic reserves, and LNG Terminals crucial for natural gas imports. The midstream segment is critical for ensuring energy security and efficient supply chain management, with projected market growth driven by pipeline expansion and the increasing role of natural gas, estimated at USD 20-25 billion by 2033.
Key Drivers of Oil and Gas Industry in India Growth
The Indian oil and gas industry's growth is propelled by several interconnected factors. Firstly, increasing energy demand from a rapidly growing economy and a large, young population is a primary driver. Secondly, government initiatives aimed at boosting domestic production, enhancing energy security, and promoting cleaner fuels play a crucial role. Policies like the National Gas Grid expansion and incentives for upstream exploration are significant. Thirdly, technological advancements in exploration, extraction, and refining are improving efficiency and reducing costs. Finally, infrastructure development, including new pipelines, LNG terminals, and refinery upgrades, is essential for meeting the growing demand and improving supply chain logistics.
Challenges in the Oil and Gas Industry in India Sector
Despite robust growth prospects, the Indian oil and gas sector faces several challenges. Regulatory hurdles and policy uncertainties can sometimes impede project execution and investment. Price volatility of crude oil in the global market significantly impacts profitability and import costs. Supply chain disruptions, both domestic and international, can affect the availability of equipment and raw materials. Environmental concerns and the transition to cleaner energy sources pose a long-term challenge, requiring substantial investment in new technologies and infrastructure. Land acquisition issues for pipeline projects and infrastructure development can also cause delays. The competitive pressure from international markets and the need for continuous technological upgrades also present hurdles.
Emerging Opportunities in Oil and Gas Industry in India
Emerging opportunities in the Indian oil and gas sector are diverse and promising. The expansion of the City Gas Distribution (CGD) network presents a significant opportunity for natural gas penetration into residential, commercial, and industrial sectors. Investments in petrochemical complexes to cater to the growing demand for polymers and specialty chemicals offer substantial growth potential. The increasing focus on hydrogen as a future fuel, particularly green hydrogen, opens new avenues for research, development, and infrastructure creation. Upgrading existing refining infrastructure to produce cleaner fuels and higher-value products is another key opportunity. Furthermore, the push for digitalization and advanced analytics across the value chain offers avenues for improving operational efficiency and decision-making.
Leading Players in the Oil and Gas Industry in India Market
- Oil and Natural Gas Corporation
- Bharat Petroleum Corporation Limited
- Reliance Industries
- Hindustan Petroleum Corporation Limited
- GAIL (India) Limited
- Indian Oil Corporation Limited
- Oil India Limited
- Cairn India
- Punj Lloyd Limited
Key Developments in Oil and Gas Industry in India Industry
- March 2023: Indian Oil Corporation Ltd. announced a significant investment of USD 742 million to establish a new petrochemical complex in Paradip, Odisha, aiming to bolster its downstream capabilities and cater to the growing demand for petrochemical products.
- January 2022: Adani Total Gas Ltd (ATGL), a joint venture between the Adani Group and TotalEnergies, secured licenses to expand its City Gas Distribution (CGD) network into 14 new geographical areas, marking an investment of USD 243 million and signaling a strong push towards increasing natural gas availability across India.
Future Outlook for Oil and Gas Industry in India Market
The future outlook for the Indian oil and gas industry is characterized by sustained growth, driven by India's robust economic expansion and increasing energy consumption. The strategic push towards natural gas as a cleaner transition fuel, coupled with significant investments in expanding the CGD network and LNG infrastructure, will be a major growth accelerator. The downstream sector is poised for expansion with new refinery projects and petrochemical complex developments aimed at meeting domestic demand and reducing import dependence. While the transition to renewable energy sources will gradually influence demand patterns, the oil and gas industry will remain critical for India's energy security in the medium to long term. Embracing digitalization, investing in cleaner technologies, and focusing on product innovation will be key for companies to maintain competitiveness and capitalize on future market potential. The industry is expected to witness further consolidation and strategic partnerships to enhance operational efficiencies and explore new growth avenues.
Oil and Gas Industry in India Segmentation
-
1. Sector
-
1.1. Upstream
-
1.1.1. Location of Deployment
- 1.1.1.1. Onshore
- 1.1.1.2. Offshore
-
1.1.1. Location of Deployment
-
1.2. Downstream
- 1.2.1. Refineries
- 1.2.2. Petrochemical Plants
-
1.3. Midstream
- 1.3.1. Transportation
- 1.3.2. Storage
- 1.3.3. LNG Terminals
-
1.1. Upstream
Oil and Gas Industry in India Segmentation By Geography
-
1. North America
- 1.1. United States
- 1.2. Canada
- 1.3. Mexico
-
2. South America
- 2.1. Brazil
- 2.2. Argentina
- 2.3. Rest of South America
-
3. Europe
- 3.1. United Kingdom
- 3.2. Germany
- 3.3. France
- 3.4. Italy
- 3.5. Spain
- 3.6. Russia
- 3.7. Benelux
- 3.8. Nordics
- 3.9. Rest of Europe
-
4. Middle East & Africa
- 4.1. Turkey
- 4.2. Israel
- 4.3. GCC
- 4.4. North Africa
- 4.5. South Africa
- 4.6. Rest of Middle East & Africa
-
5. Asia Pacific
- 5.1. China
- 5.2. India
- 5.3. Japan
- 5.4. South Korea
- 5.5. ASEAN
- 5.6. Oceania
- 5.7. Rest of Asia Pacific
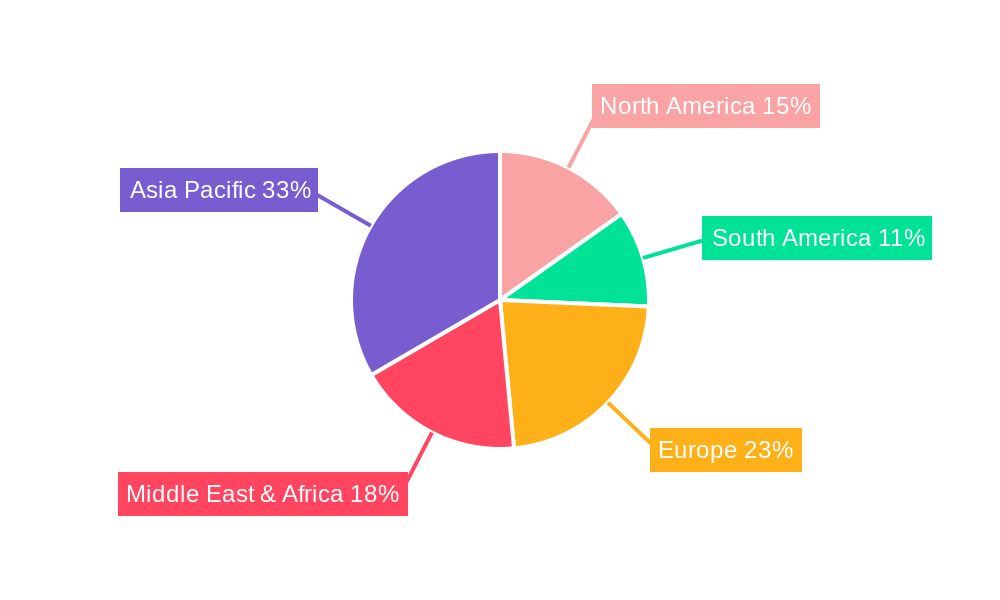
Oil and Gas Industry in India Regional Market Share
Geographic Coverage of Oil and Gas Industry in India
Oil and Gas Industry in India REPORT HIGHLIGHTS
| Aspects | Details |
|---|---|
| Study Period | 2020-2034 |
| Base Year | 2025 |
| Estimated Year | 2026 |
| Forecast Period | 2026-2034 |
| Historical Period | 2020-2025 |
| Growth Rate | CAGR of 5.02% from 2020-2034 |
| Segmentation |
|
Table of Contents
- 1. Introduction
- 1.1. Research Scope
- 1.2. Market Segmentation
- 1.3. Research Objective
- 1.4. Definitions and Assumptions
- 2. Executive Summary
- 2.1. Market Snapshot
- 3. Market Dynamics
- 3.1. Market Drivers
- 3.2. Market Restrains
- 3.3. Market Trends
- 3.4. Market Opportunities
- 4. Market Factor Analysis
- 4.1. Porters Five Forces
- 4.1.1. Bargaining Power of Suppliers
- 4.1.2. Bargaining Power of Buyers
- 4.1.3. Threat of New Entrants
- 4.1.4. Threat of Substitutes
- 4.1.5. Competitive Rivalry
- 4.2. PESTEL analysis
- 4.3. BCG Analysis
- 4.3.1. Stars (High Growth, High Market Share)
- 4.3.2. Cash Cows (Low Growth, High Market Share)
- 4.3.3. Question Mark (High Growth, Low Market Share)
- 4.3.4. Dogs (Low Growth, Low Market Share)
- 4.4. Ansoff Matrix Analysis
- 4.5. Supply Chain Analysis
- 4.6. Regulatory Landscape
- 4.7. Current Market Potential and Opportunity Assessment (TAM–SAM–SOM Framework)
- 4.8. PRI Analyst Note
- 4.1. Porters Five Forces
- 5. Market Analysis, Insights and Forecast 2021-2033
- 5.1. Market Analysis, Insights and Forecast - by Sector
- 5.1.1. Upstream
- 5.1.1.1. Location of Deployment
- 5.1.1.1.1. Onshore
- 5.1.1.1.2. Offshore
- 5.1.1.1. Location of Deployment
- 5.1.2. Downstream
- 5.1.2.1. Refineries
- 5.1.2.2. Petrochemical Plants
- 5.1.3. Midstream
- 5.1.3.1. Transportation
- 5.1.3.2. Storage
- 5.1.3.3. LNG Terminals
- 5.1.1. Upstream
- 5.2. Market Analysis, Insights and Forecast - by Region
- 5.2.1. North America
- 5.2.2. South America
- 5.2.3. Europe
- 5.2.4. Middle East & Africa
- 5.2.5. Asia Pacific
- 5.1. Market Analysis, Insights and Forecast - by Sector
- 6. Global Oil and Gas Industry in India Analysis, Insights and Forecast, 2021-2033
- 6.1. Market Analysis, Insights and Forecast - by Sector
- 6.1.1. Upstream
- 6.1.1.1. Location of Deployment
- 6.1.1.1.1. Onshore
- 6.1.1.1.2. Offshore
- 6.1.1.1. Location of Deployment
- 6.1.2. Downstream
- 6.1.2.1. Refineries
- 6.1.2.2. Petrochemical Plants
- 6.1.3. Midstream
- 6.1.3.1. Transportation
- 6.1.3.2. Storage
- 6.1.3.3. LNG Terminals
- 6.1.1. Upstream
- 6.1. Market Analysis, Insights and Forecast - by Sector
- 7. North America Oil and Gas Industry in India Analysis, Insights and Forecast, 2020-2032
- 7.1. Market Analysis, Insights and Forecast - by Sector
- 7.1.1. Upstream
- 7.1.1.1. Location of Deployment
- 7.1.1.1.1. Onshore
- 7.1.1.1.2. Offshore
- 7.1.1.1. Location of Deployment
- 7.1.2. Downstream
- 7.1.2.1. Refineries
- 7.1.2.2. Petrochemical Plants
- 7.1.3. Midstream
- 7.1.3.1. Transportation
- 7.1.3.2. Storage
- 7.1.3.3. LNG Terminals
- 7.1.1. Upstream
- 7.1. Market Analysis, Insights and Forecast - by Sector
- 8. South America Oil and Gas Industry in India Analysis, Insights and Forecast, 2020-2032
- 8.1. Market Analysis, Insights and Forecast - by Sector
- 8.1.1. Upstream
- 8.1.1.1. Location of Deployment
- 8.1.1.1.1. Onshore
- 8.1.1.1.2. Offshore
- 8.1.1.1. Location of Deployment
- 8.1.2. Downstream
- 8.1.2.1. Refineries
- 8.1.2.2. Petrochemical Plants
- 8.1.3. Midstream
- 8.1.3.1. Transportation
- 8.1.3.2. Storage
- 8.1.3.3. LNG Terminals
- 8.1.1. Upstream
- 8.1. Market Analysis, Insights and Forecast - by Sector
- 9. Europe Oil and Gas Industry in India Analysis, Insights and Forecast, 2020-2032
- 9.1. Market Analysis, Insights and Forecast - by Sector
- 9.1.1. Upstream
- 9.1.1.1. Location of Deployment
- 9.1.1.1.1. Onshore
- 9.1.1.1.2. Offshore
- 9.1.1.1. Location of Deployment
- 9.1.2. Downstream
- 9.1.2.1. Refineries
- 9.1.2.2. Petrochemical Plants
- 9.1.3. Midstream
- 9.1.3.1. Transportation
- 9.1.3.2. Storage
- 9.1.3.3. LNG Terminals
- 9.1.1. Upstream
- 9.1. Market Analysis, Insights and Forecast - by Sector
- 10. Middle East & Africa Oil and Gas Industry in India Analysis, Insights and Forecast, 2020-2032
- 10.1. Market Analysis, Insights and Forecast - by Sector
- 10.1.1. Upstream
- 10.1.1.1. Location of Deployment
- 10.1.1.1.1. Onshore
- 10.1.1.1.2. Offshore
- 10.1.1.1. Location of Deployment
- 10.1.2. Downstream
- 10.1.2.1. Refineries
- 10.1.2.2. Petrochemical Plants
- 10.1.3. Midstream
- 10.1.3.1. Transportation
- 10.1.3.2. Storage
- 10.1.3.3. LNG Terminals
- 10.1.1. Upstream
- 10.1. Market Analysis, Insights and Forecast - by Sector
- 11. Asia Pacific Oil and Gas Industry in India Analysis, Insights and Forecast, 2020-2032
- 11.1. Market Analysis, Insights and Forecast - by Sector
- 11.1.1. Upstream
- 11.1.1.1. Location of Deployment
- 11.1.1.1.1. Onshore
- 11.1.1.1.2. Offshore
- 11.1.1.1. Location of Deployment
- 11.1.2. Downstream
- 11.1.2.1. Refineries
- 11.1.2.2. Petrochemical Plants
- 11.1.3. Midstream
- 11.1.3.1. Transportation
- 11.1.3.2. Storage
- 11.1.3.3. LNG Terminals
- 11.1.1. Upstream
- 11.1. Market Analysis, Insights and Forecast - by Sector
- 12. Competitive Analysis
- 12.1. Company Profiles
- 12.1.1 Oil and Natural Gas Corporation
- 12.1.1.1. Company Overview
- 12.1.1.2. Products
- 12.1.1.3. Company Financials
- 12.1.1.4. SWOT Analysis
- 12.1.2 Bharat Petroleum Corporation Limited
- 12.1.2.1. Company Overview
- 12.1.2.2. Products
- 12.1.2.3. Company Financials
- 12.1.2.4. SWOT Analysis
- 12.1.3 Reliance Industries
- 12.1.3.1. Company Overview
- 12.1.3.2. Products
- 12.1.3.3. Company Financials
- 12.1.3.4. SWOT Analysis
- 12.1.4 Hindustan Petroleum Corporation Limited
- 12.1.4.1. Company Overview
- 12.1.4.2. Products
- 12.1.4.3. Company Financials
- 12.1.4.4. SWOT Analysis
- 12.1.5 GAIL (India) Limited
- 12.1.5.1. Company Overview
- 12.1.5.2. Products
- 12.1.5.3. Company Financials
- 12.1.5.4. SWOT Analysis
- 12.1.6 Indian Oil Corporation Limited
- 12.1.6.1. Company Overview
- 12.1.6.2. Products
- 12.1.6.3. Company Financials
- 12.1.6.4. SWOT Analysis
- 12.1.7 Oil India Limited
- 12.1.7.1. Company Overview
- 12.1.7.2. Products
- 12.1.7.3. Company Financials
- 12.1.7.4. SWOT Analysis
- 12.1.8 Cairn India
- 12.1.8.1. Company Overview
- 12.1.8.2. Products
- 12.1.8.3. Company Financials
- 12.1.8.4. SWOT Analysis
- 12.1.9 Punj Lloyd Limited
- 12.1.9.1. Company Overview
- 12.1.9.2. Products
- 12.1.9.3. Company Financials
- 12.1.9.4. SWOT Analysis
- 12.1.1 Oil and Natural Gas Corporation
- 12.2. Market Entropy
- 12.2.1 Company's Key Areas Served
- 12.2.2 Recent Developments
- 12.3. Company Market Share Analysis 2025
- 12.3.1 Top 5 Companies Market Share Analysis
- 12.3.2 Top 3 Companies Market Share Analysis
- 12.4. List of Potential Customers
- 13. Research Methodology
List of Figures
- Figure 1: Global Oil and Gas Industry in India Revenue Breakdown (million, %) by Region 2025 & 2033
- Figure 2: Global Oil and Gas Industry in India Volume Breakdown (Billion, %) by Region 2025 & 2033
- Figure 3: North America Oil and Gas Industry in India Revenue (million), by Sector 2025 & 2033
- Figure 4: North America Oil and Gas Industry in India Volume (Billion), by Sector 2025 & 2033
- Figure 5: North America Oil and Gas Industry in India Revenue Share (%), by Sector 2025 & 2033
- Figure 6: North America Oil and Gas Industry in India Volume Share (%), by Sector 2025 & 2033
- Figure 7: North America Oil and Gas Industry in India Revenue (million), by Country 2025 & 2033
- Figure 8: North America Oil and Gas Industry in India Volume (Billion), by Country 2025 & 2033
- Figure 9: North America Oil and Gas Industry in India Revenue Share (%), by Country 2025 & 2033
- Figure 10: North America Oil and Gas Industry in India Volume Share (%), by Country 2025 & 2033
- Figure 11: South America Oil and Gas Industry in India Revenue (million), by Sector 2025 & 2033
- Figure 12: South America Oil and Gas Industry in India Volume (Billion), by Sector 2025 & 2033
- Figure 13: South America Oil and Gas Industry in India Revenue Share (%), by Sector 2025 & 2033
- Figure 14: South America Oil and Gas Industry in India Volume Share (%), by Sector 2025 & 2033
- Figure 15: South America Oil and Gas Industry in India Revenue (million), by Country 2025 & 2033
- Figure 16: South America Oil and Gas Industry in India Volume (Billion), by Country 2025 & 2033
- Figure 17: South America Oil and Gas Industry in India Revenue Share (%), by Country 2025 & 2033
- Figure 18: South America Oil and Gas Industry in India Volume Share (%), by Country 2025 & 2033
- Figure 19: Europe Oil and Gas Industry in India Revenue (million), by Sector 2025 & 2033
- Figure 20: Europe Oil and Gas Industry in India Volume (Billion), by Sector 2025 & 2033
- Figure 21: Europe Oil and Gas Industry in India Revenue Share (%), by Sector 2025 & 2033
- Figure 22: Europe Oil and Gas Industry in India Volume Share (%), by Sector 2025 & 2033
- Figure 23: Europe Oil and Gas Industry in India Revenue (million), by Country 2025 & 2033
- Figure 24: Europe Oil and Gas Industry in India Volume (Billion), by Country 2025 & 2033
- Figure 25: Europe Oil and Gas Industry in India Revenue Share (%), by Country 2025 & 2033
- Figure 26: Europe Oil and Gas Industry in India Volume Share (%), by Country 2025 & 2033
- Figure 27: Middle East & Africa Oil and Gas Industry in India Revenue (million), by Sector 2025 & 2033
- Figure 28: Middle East & Africa Oil and Gas Industry in India Volume (Billion), by Sector 2025 & 2033
- Figure 29: Middle East & Africa Oil and Gas Industry in India Revenue Share (%), by Sector 2025 & 2033
- Figure 30: Middle East & Africa Oil and Gas Industry in India Volume Share (%), by Sector 2025 & 2033
- Figure 31: Middle East & Africa Oil and Gas Industry in India Revenue (million), by Country 2025 & 2033
- Figure 32: Middle East & Africa Oil and Gas Industry in India Volume (Billion), by Country 2025 & 2033
- Figure 33: Middle East & Africa Oil and Gas Industry in India Revenue Share (%), by Country 2025 & 2033
- Figure 34: Middle East & Africa Oil and Gas Industry in India Volume Share (%), by Country 2025 & 2033
- Figure 35: Asia Pacific Oil and Gas Industry in India Revenue (million), by Sector 2025 & 2033
- Figure 36: Asia Pacific Oil and Gas Industry in India Volume (Billion), by Sector 2025 & 2033
- Figure 37: Asia Pacific Oil and Gas Industry in India Revenue Share (%), by Sector 2025 & 2033
- Figure 38: Asia Pacific Oil and Gas Industry in India Volume Share (%), by Sector 2025 & 2033
- Figure 39: Asia Pacific Oil and Gas Industry in India Revenue (million), by Country 2025 & 2033
- Figure 40: Asia Pacific Oil and Gas Industry in India Volume (Billion), by Country 2025 & 2033
- Figure 41: Asia Pacific Oil and Gas Industry in India Revenue Share (%), by Country 2025 & 2033
- Figure 42: Asia Pacific Oil and Gas Industry in India Volume Share (%), by Country 2025 & 2033
List of Tables
- Table 1: Global Oil and Gas Industry in India Revenue million Forecast, by Sector 2020 & 2033
- Table 2: Global Oil and Gas Industry in India Volume Billion Forecast, by Sector 2020 & 2033
- Table 3: Global Oil and Gas Industry in India Revenue million Forecast, by Region 2020 & 2033
- Table 4: Global Oil and Gas Industry in India Volume Billion Forecast, by Region 2020 & 2033
- Table 5: Global Oil and Gas Industry in India Revenue million Forecast, by Sector 2020 & 2033
- Table 6: Global Oil and Gas Industry in India Volume Billion Forecast, by Sector 2020 & 2033
- Table 7: Global Oil and Gas Industry in India Revenue million Forecast, by Country 2020 & 2033
- Table 8: Global Oil and Gas Industry in India Volume Billion Forecast, by Country 2020 & 2033
- Table 9: United States Oil and Gas Industry in India Revenue (million) Forecast, by Application 2020 & 2033
- Table 10: United States Oil and Gas Industry in India Volume (Billion) Forecast, by Application 2020 & 2033
- Table 11: Canada Oil and Gas Industry in India Revenue (million) Forecast, by Application 2020 & 2033
- Table 12: Canada Oil and Gas Industry in India Volume (Billion) Forecast, by Application 2020 & 2033
- Table 13: Mexico Oil and Gas Industry in India Revenue (million) Forecast, by Application 2020 & 2033
- Table 14: Mexico Oil and Gas Industry in India Volume (Billion) Forecast, by Application 2020 & 2033
- Table 15: Global Oil and Gas Industry in India Revenue million Forecast, by Sector 2020 & 2033
- Table 16: Global Oil and Gas Industry in India Volume Billion Forecast, by Sector 2020 & 2033
- Table 17: Global Oil and Gas Industry in India Revenue million Forecast, by Country 2020 & 2033
- Table 18: Global Oil and Gas Industry in India Volume Billion Forecast, by Country 2020 & 2033
- Table 19: Brazil Oil and Gas Industry in India Revenue (million) Forecast, by Application 2020 & 2033
- Table 20: Brazil Oil and Gas Industry in India Volume (Billion) Forecast, by Application 2020 & 2033
- Table 21: Argentina Oil and Gas Industry in India Revenue (million) Forecast, by Application 2020 & 2033
- Table 22: Argentina Oil and Gas Industry in India Volume (Billion) Forecast, by Application 2020 & 2033
- Table 23: Rest of South America Oil and Gas Industry in India Revenue (million) Forecast, by Application 2020 & 2033
- Table 24: Rest of South America Oil and Gas Industry in India Volume (Billion) Forecast, by Application 2020 & 2033
- Table 25: Global Oil and Gas Industry in India Revenue million Forecast, by Sector 2020 & 2033
- Table 26: Global Oil and Gas Industry in India Volume Billion Forecast, by Sector 2020 & 2033
- Table 27: Global Oil and Gas Industry in India Revenue million Forecast, by Country 2020 & 2033
- Table 28: Global Oil and Gas Industry in India Volume Billion Forecast, by Country 2020 & 2033
- Table 29: United Kingdom Oil and Gas Industry in India Revenue (million) Forecast, by Application 2020 & 2033
- Table 30: United Kingdom Oil and Gas Industry in India Volume (Billion) Forecast, by Application 2020 & 2033
- Table 31: Germany Oil and Gas Industry in India Revenue (million) Forecast, by Application 2020 & 2033
- Table 32: Germany Oil and Gas Industry in India Volume (Billion) Forecast, by Application 2020 & 2033
- Table 33: France Oil and Gas Industry in India Revenue (million) Forecast, by Application 2020 & 2033
- Table 34: France Oil and Gas Industry in India Volume (Billion) Forecast, by Application 2020 & 2033
- Table 35: Italy Oil and Gas Industry in India Revenue (million) Forecast, by Application 2020 & 2033
- Table 36: Italy Oil and Gas Industry in India Volume (Billion) Forecast, by Application 2020 & 2033
- Table 37: Spain Oil and Gas Industry in India Revenue (million) Forecast, by Application 2020 & 2033
- Table 38: Spain Oil and Gas Industry in India Volume (Billion) Forecast, by Application 2020 & 2033
- Table 39: Russia Oil and Gas Industry in India Revenue (million) Forecast, by Application 2020 & 2033
- Table 40: Russia Oil and Gas Industry in India Volume (Billion) Forecast, by Application 2020 & 2033
- Table 41: Benelux Oil and Gas Industry in India Revenue (million) Forecast, by Application 2020 & 2033
- Table 42: Benelux Oil and Gas Industry in India Volume (Billion) Forecast, by Application 2020 & 2033
- Table 43: Nordics Oil and Gas Industry in India Revenue (million) Forecast, by Application 2020 & 2033
- Table 44: Nordics Oil and Gas Industry in India Volume (Billion) Forecast, by Application 2020 & 2033
- Table 45: Rest of Europe Oil and Gas Industry in India Revenue (million) Forecast, by Application 2020 & 2033
- Table 46: Rest of Europe Oil and Gas Industry in India Volume (Billion) Forecast, by Application 2020 & 2033
- Table 47: Global Oil and Gas Industry in India Revenue million Forecast, by Sector 2020 & 2033
- Table 48: Global Oil and Gas Industry in India Volume Billion Forecast, by Sector 2020 & 2033
- Table 49: Global Oil and Gas Industry in India Revenue million Forecast, by Country 2020 & 2033
- Table 50: Global Oil and Gas Industry in India Volume Billion Forecast, by Country 2020 & 2033
- Table 51: Turkey Oil and Gas Industry in India Revenue (million) Forecast, by Application 2020 & 2033
- Table 52: Turkey Oil and Gas Industry in India Volume (Billion) Forecast, by Application 2020 & 2033
- Table 53: Israel Oil and Gas Industry in India Revenue (million) Forecast, by Application 2020 & 2033
- Table 54: Israel Oil and Gas Industry in India Volume (Billion) Forecast, by Application 2020 & 2033
- Table 55: GCC Oil and Gas Industry in India Revenue (million) Forecast, by Application 2020 & 2033
- Table 56: GCC Oil and Gas Industry in India Volume (Billion) Forecast, by Application 2020 & 2033
- Table 57: North Africa Oil and Gas Industry in India Revenue (million) Forecast, by Application 2020 & 2033
- Table 58: North Africa Oil and Gas Industry in India Volume (Billion) Forecast, by Application 2020 & 2033
- Table 59: South Africa Oil and Gas Industry in India Revenue (million) Forecast, by Application 2020 & 2033
- Table 60: South Africa Oil and Gas Industry in India Volume (Billion) Forecast, by Application 2020 & 2033
- Table 61: Rest of Middle East & Africa Oil and Gas Industry in India Revenue (million) Forecast, by Application 2020 & 2033
- Table 62: Rest of Middle East & Africa Oil and Gas Industry in India Volume (Billion) Forecast, by Application 2020 & 2033
- Table 63: Global Oil and Gas Industry in India Revenue million Forecast, by Sector 2020 & 2033
- Table 64: Global Oil and Gas Industry in India Volume Billion Forecast, by Sector 2020 & 2033
- Table 65: Global Oil and Gas Industry in India Revenue million Forecast, by Country 2020 & 2033
- Table 66: Global Oil and Gas Industry in India Volume Billion Forecast, by Country 2020 & 2033
- Table 67: China Oil and Gas Industry in India Revenue (million) Forecast, by Application 2020 & 2033
- Table 68: China Oil and Gas Industry in India Volume (Billion) Forecast, by Application 2020 & 2033
- Table 69: India Oil and Gas Industry in India Revenue (million) Forecast, by Application 2020 & 2033
- Table 70: India Oil and Gas Industry in India Volume (Billion) Forecast, by Application 2020 & 2033
- Table 71: Japan Oil and Gas Industry in India Revenue (million) Forecast, by Application 2020 & 2033
- Table 72: Japan Oil and Gas Industry in India Volume (Billion) Forecast, by Application 2020 & 2033
- Table 73: South Korea Oil and Gas Industry in India Revenue (million) Forecast, by Application 2020 & 2033
- Table 74: South Korea Oil and Gas Industry in India Volume (Billion) Forecast, by Application 2020 & 2033
- Table 75: ASEAN Oil and Gas Industry in India Revenue (million) Forecast, by Application 2020 & 2033
- Table 76: ASEAN Oil and Gas Industry in India Volume (Billion) Forecast, by Application 2020 & 2033
- Table 77: Oceania Oil and Gas Industry in India Revenue (million) Forecast, by Application 2020 & 2033
- Table 78: Oceania Oil and Gas Industry in India Volume (Billion) Forecast, by Application 2020 & 2033
- Table 79: Rest of Asia Pacific Oil and Gas Industry in India Revenue (million) Forecast, by Application 2020 & 2033
- Table 80: Rest of Asia Pacific Oil and Gas Industry in India Volume (Billion) Forecast, by Application 2020 & 2033
Frequently Asked Questions
1. What is the projected Compound Annual Growth Rate (CAGR) of the Oil and Gas Industry in India?
The projected CAGR is approximately 5.02%.
2. Which companies are prominent players in the Oil and Gas Industry in India?
Key companies in the market include Oil and Natural Gas Corporation, Bharat Petroleum Corporation Limited, Reliance Industries, Hindustan Petroleum Corporation Limited, GAIL (India) Limited, Indian Oil Corporation Limited, Oil India Limited, Cairn India, Punj Lloyd Limited.
3. What are the main segments of the Oil and Gas Industry in India?
The market segments include Sector.
4. Can you provide details about the market size?
The market size is estimated to be USD 747.66 million as of 2022.
5. What are some drivers contributing to market growth?
4.; Increasing Investment in the Upstream Sector4.; Supportive Government Policies.
6. What are the notable trends driving market growth?
The Downstream Sector is Expected to Witness Significant Growth.
7. Are there any restraints impacting market growth?
4.; Increasing Demand to Diversify the Power Generation Mix by Introducing Renewable Energy Sources.
8. Can you provide examples of recent developments in the market?
In March 2023, Indian Oil Corporation Ltd. announced that the company would invest USD 742 million in building a petrochemical complex at Paradip in the state of Odisha.
9. What pricing options are available for accessing the report?
Pricing options include single-user, multi-user, and enterprise licenses priced at USD 3800, USD 4500, and USD 5800 respectively.
10. Is the market size provided in terms of value or volume?
The market size is provided in terms of value, measured in million and volume, measured in Billion.
11. Are there any specific market keywords associated with the report?
Yes, the market keyword associated with the report is "Oil and Gas Industry in India," which aids in identifying and referencing the specific market segment covered.
12. How do I determine which pricing option suits my needs best?
The pricing options vary based on user requirements and access needs. Individual users may opt for single-user licenses, while businesses requiring broader access may choose multi-user or enterprise licenses for cost-effective access to the report.
13. Are there any additional resources or data provided in the Oil and Gas Industry in India report?
While the report offers comprehensive insights, it's advisable to review the specific contents or supplementary materials provided to ascertain if additional resources or data are available.
14. How can I stay updated on further developments or reports in the Oil and Gas Industry in India?
To stay informed about further developments, trends, and reports in the Oil and Gas Industry in India, consider subscribing to industry newsletters, following relevant companies and organizations, or regularly checking reputable industry news sources and publications.
Methodology
Step 1 - Identification of Relevant Samples Size from Population Database


Step 2 - Approaches for Defining Global Market Size (Value, Volume* & Price*)

Note*: In applicable scenarios
Step 3 - Data Sources
Primary Research
- Web Analytics
- Survey Reports
- Research Institute
- Latest Research Reports
- Opinion Leaders
Secondary Research
- Annual Reports
- White Paper
- Latest Press Release
- Industry Association
- Paid Database
- Investor Presentations

Step 4 - Data Triangulation
Involves using different sources of information in order to increase the validity of a study
These sources are likely to be stakeholders in a program - participants, other researchers, program staff, other community members, and so on.
Then we put all data in single framework & apply various statistical tools to find out the dynamic on the market.
During the analysis stage, feedback from the stakeholder groups would be compared to determine areas of agreement as well as areas of divergence