

Key Insights
The global oil and gas pump market is poised for significant expansion, driven by escalating energy consumption and sustained exploration and production initiatives. The market is projected to achieve a Compound Annual Growth Rate (CAGR) of 8.8%, reaching a market size of $14.27 billion by 2025. This growth is propelled by the increasing demand for efficient and dependable pumping solutions across upstream, midstream, and downstream oil and gas operations. Key growth enablers include advancements in pump technology, such as the development of more efficient dynamic and positive displacement pumps, and the growing integration of automation and digitalization in the sector, fostering the adoption of smart, data-driven pump systems. However, market expansion may be influenced by volatile oil prices, stringent environmental regulations, and geopolitical uncertainties impacting investment strategies.
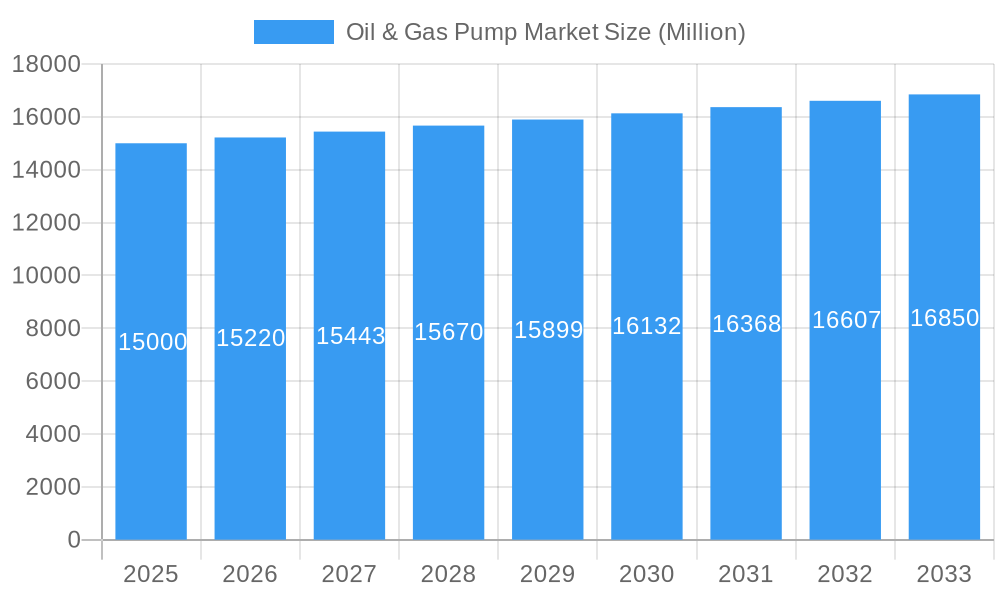
Oil & Gas Pump Market Market Size (In Billion)
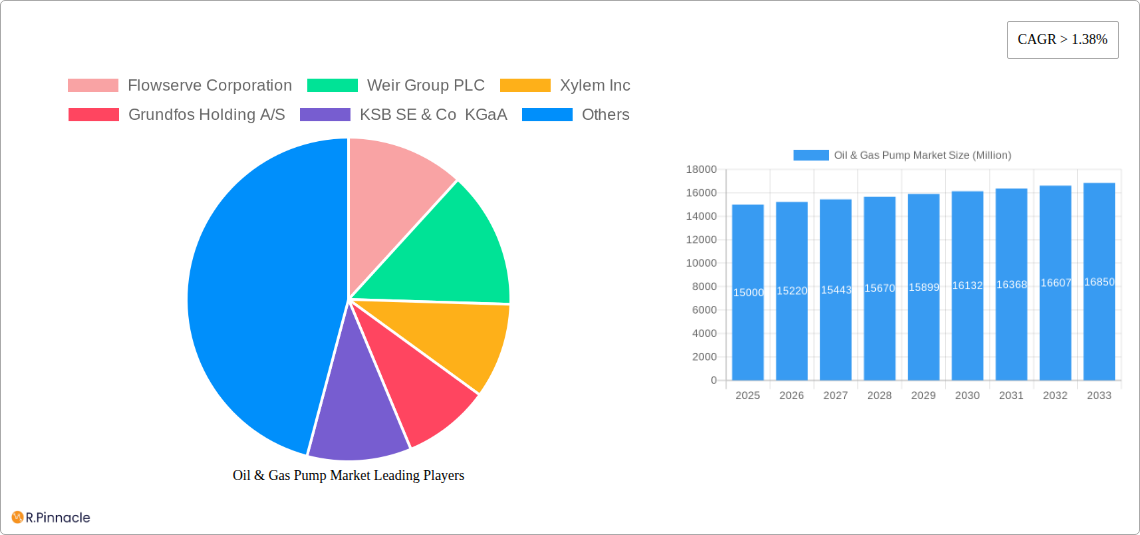
Dynamic pumps currently lead the market share due to their suitability for high-volume applications. Geographically, North America and Asia-Pacific are expected to be the dominant regions, attributed to substantial oil and gas reserves and considerable investment in infrastructure development. Key market participants, including Flowserve, Weir Group, Xylem, and Grundfos, are instrumental in shaping market trends through continuous innovation, strategic alliances, and global expansion.
Oil & Gas Pump Market Company Market Share
The competitive environment features both established industry leaders and specialized pump manufacturers. Competition centers on delivering advanced pump technologies that enhance operational efficiency, reliability, and cost-effectiveness. The increasing adoption of sophisticated monitoring and control systems further intensifies competition, driving companies to offer integrated asset management solutions. Future market growth will be contingent upon sustained energy demand, technological innovation, and supportive government policies concerning environmental protection and carbon emissions. Success will be determined by the ability to adapt to technological advancements, provide comprehensive service offerings, and proactively address environmental challenges through a focus on research and development for energy-efficient and sustainable pumping solutions.
This comprehensive report offers an in-depth analysis of the Oil & Gas Pump Market, providing critical insights for industry professionals, investors, and strategic decision-makers. Covering the period from 2019 to 2033, with a specific focus on 2025, this report details market dynamics, competitive landscapes, and future growth potential. Utilizing extensive data and expert analysis, this report serves as an indispensable resource for navigating the complexities of this dynamic industry.
Oil & Gas Pump Market Structure & Innovation Trends
The Oil & Gas Pump market is characterized by a moderately concentrated structure, with several major players holding significant market share. Flowserve Corporation, Weir Group PLC, Xylem Inc, and Baker Hughes Co. represent some of the key players. In 2024, the top five companies held an estimated 35% market share. The market exhibits continuous innovation driven by the need for enhanced efficiency, durability, and reduced environmental impact. Regulatory frameworks, particularly those focused on emissions and safety, significantly influence market dynamics. Product substitutes, such as alternative energy technologies, pose a growing threat, yet the consistent demand for fossil fuels continues to drive market growth. End-user demographics, largely comprised of upstream, midstream, and downstream oil and gas companies, exhibit varying needs and preferences. Significant M&A activity has been observed in the recent past; in 2023, the total value of M&A deals exceeded $xx Million, driven by the desire for consolidation and expansion.
- Market Concentration: Top 5 players hold ~35% market share (2024).
- Innovation Drivers: Enhanced efficiency, durability, reduced emissions.
- Regulatory Framework: Stringent safety and environmental regulations.
- Product Substitutes: Growth of renewable energy sources.
- End-User Demographics: Upstream, midstream, and downstream oil & gas companies.
- M&A Activity: Total deal value exceeded $xx Million in 2023.
Oil & Gas Pump Market Dynamics & Trends
The Oil & Gas Pump market is experiencing robust growth, driven by increasing global energy demand, exploration activities, and infrastructure development. Technological advancements, such as the adoption of smart pumps and digitalization, are significantly impacting market dynamics. Consumer preferences are shifting towards energy-efficient and environmentally friendly solutions. The competitive landscape is fiercely contested, with companies vying for market share through innovation, strategic partnerships, and mergers & acquisitions. The market is expected to exhibit a Compound Annual Growth Rate (CAGR) of xx% during the forecast period (2025-2033), reaching a market value of $xx Million by 2033. Market penetration of advanced pump technologies is projected to reach xx% by 2030.
Dominant Regions & Segments in Oil & Gas Pump Market
The North American region currently holds the dominant position in the Oil & Gas Pump market, driven by substantial oil and gas production and ongoing investments in infrastructure. However, the Asia-Pacific region is experiencing rapid growth, fueled by rising energy demand and significant expansion of oil & gas exploration and production activities.
Leading Segments:
- Type: Positive displacement pumps are expected to witness significant growth due to their ability to handle high viscosity fluids and maintain consistent flow rates, especially in upstream applications.
- Application: The upstream segment dominates the market, driven by higher demand for pumps in drilling and production processes.
Key Drivers by Region:
- North America: Strong oil & gas production, investment in infrastructure, stringent environmental regulations driving innovation.
- Asia-Pacific: Rapid economic growth, rising energy demand, significant investments in oil & gas exploration and production.
Oil & Gas Pump Market Product Innovations
Recent innovations in oil & gas pumps focus on enhancing efficiency, reliability, and reducing environmental impact. Smart pumps, incorporating advanced sensors and control systems, provide real-time monitoring and optimize performance. The integration of digital technologies enables predictive maintenance and minimizes downtime. These innovations offer significant competitive advantages by improving operational efficiency and reducing total cost of ownership. New materials and designs are being implemented to improve durability and extend the lifespan of pumps, particularly in harsh operating environments.
Report Scope & Segmentation Analysis
This report segments the Oil & Gas Pump market by type (Dynamic Pumps, Positive Displacement Pumps) and application (Upstream, Midstream, Downstream). Each segment is analyzed based on market size, growth projections, and competitive dynamics.
- Dynamic Pumps: This segment is projected to maintain a significant market share driven by its wide applicability and cost-effectiveness.
- Positive Displacement Pumps: This segment shows high growth potential in specialized applications due to its higher precision and efficiency.
- Upstream: This application accounts for the largest market share, reflecting the high demand for pumps in oil and gas extraction.
- Midstream: This segment displays steady growth, in line with the expansion of pipeline networks and storage facilities.
- Downstream: This segment is influenced by refining activities and presents opportunities for specialized pump technologies.
Key Drivers of Oil & Gas Pump Market Growth
The Oil & Gas Pump market is driven by several key factors, including rising global energy demand, increased investment in oil & gas exploration and production, and the development of new oil & gas fields. Technological advancements leading to higher efficiency and reliability of pumps also contribute significantly to market growth. Stringent environmental regulations are pushing the adoption of environmentally friendly pump technologies.
Challenges in the Oil & Gas Pump Market Sector
The Oil & Gas Pump market faces several challenges, including fluctuating oil and gas prices, the volatility of raw material costs, and intense competition among manufacturers. Supply chain disruptions and stringent environmental regulations can also hinder market growth. The adoption of renewable energy sources poses a long-term challenge for the market. These factors result in reduced profit margins and increased operational costs for manufacturers.
Emerging Opportunities in Oil & Gas Pump Market
Emerging opportunities exist in the development and adoption of energy-efficient pumps, smart pumps, and pumps designed for harsh operating environments such as deepwater applications. Expansion into new geographical regions with growing oil & gas exploration and production activities also presents significant opportunities. Increased focus on predictive maintenance and digitalization of pump operations offers growth potential.
Leading Players in the Oil & Gas Pump Market Market
Key Developments in Oil & Gas Pump Market Industry
- Jan 2023: Xylem Inc. launched a new line of energy-efficient pumps.
- Apr 2024: Weir Group PLC announced a strategic partnership to expand its global reach.
- Oct 2024: Flowserve Corporation acquired a smaller pump manufacturer to expand its product portfolio. (Further details on specific acquisitions and their values are unavailable and require further research).
Future Outlook for Oil & Gas Pump Market Market
The Oil & Gas Pump market is poised for continued growth, driven by ongoing investments in oil & gas infrastructure and increasing global energy demand. Technological advancements in pump design and digitalization will further propel market expansion. The adoption of sustainable practices and environmentally friendly solutions will be a crucial aspect of future market development. Strategic partnerships and collaborations will play a key role in shaping the competitive landscape.
Oil & Gas Pump Market Segmentation
-
1. Type
- 1.1. Dynamic Pumps
- 1.2. Positive Displacement Pumps
-
2. Application
- 2.1. Upstream
- 2.2. Midstream
- 2.3. Downstream
Oil & Gas Pump Market Segmentation By Geography
- 1. North America
- 2. Europe
- 3. Asia Pacific
- 4. South America
- 5. Middle East and Africa
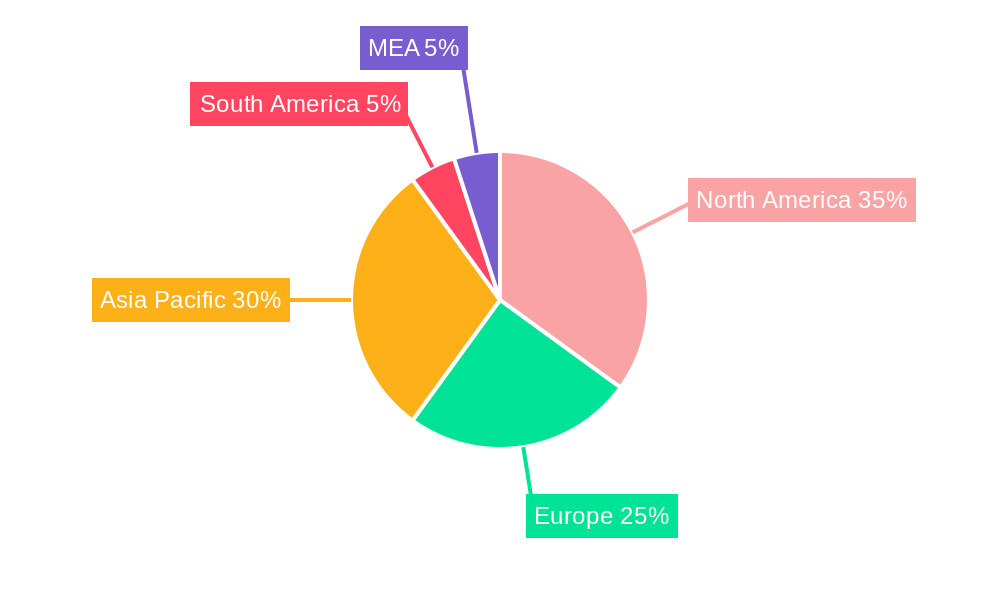
Oil & Gas Pump Market Regional Market Share
Geographic Coverage of Oil & Gas Pump Market
Oil & Gas Pump Market REPORT HIGHLIGHTS
| Aspects | Details |
|---|---|
| Study Period | 2020-2034 |
| Base Year | 2025 |
| Estimated Year | 2026 |
| Forecast Period | 2026-2034 |
| Historical Period | 2020-2025 |
| Growth Rate | CAGR of 8.8% from 2020-2034 |
| Segmentation |
|
Table of Contents
- 1. Introduction
- 1.1. Research Scope
- 1.2. Market Segmentation
- 1.3. Research Objective
- 1.4. Definitions and Assumptions
- 2. Executive Summary
- 2.1. Market Snapshot
- 3. Market Dynamics
- 3.1. Market Drivers
- 3.2. Market Restrains
- 3.3. Market Trends
- 3.4. Market Opportunities
- 4. Market Factor Analysis
- 4.1. Porters Five Forces
- 4.1.1. Bargaining Power of Suppliers
- 4.1.2. Bargaining Power of Buyers
- 4.1.3. Threat of New Entrants
- 4.1.4. Threat of Substitutes
- 4.1.5. Competitive Rivalry
- 4.2. PESTEL analysis
- 4.3. BCG Analysis
- 4.3.1. Stars (High Growth, High Market Share)
- 4.3.2. Cash Cows (Low Growth, High Market Share)
- 4.3.3. Question Mark (High Growth, Low Market Share)
- 4.3.4. Dogs (Low Growth, Low Market Share)
- 4.4. Ansoff Matrix Analysis
- 4.5. Supply Chain Analysis
- 4.6. Regulatory Landscape
- 4.7. Current Market Potential and Opportunity Assessment (TAM–SAM–SOM Framework)
- 4.8. PRI Analyst Note
- 4.1. Porters Five Forces
- 5. Market Analysis, Insights and Forecast 2021-2033
- 5.1. Market Analysis, Insights and Forecast - by Type
- 5.1.1. Dynamic Pumps
- 5.1.2. Positive Displacement Pumps
- 5.2. Market Analysis, Insights and Forecast - by Application
- 5.2.1. Upstream
- 5.2.2. Midstream
- 5.2.3. Downstream
- 5.3. Market Analysis, Insights and Forecast - by Region
- 5.3.1. North America
- 5.3.2. Europe
- 5.3.3. Asia Pacific
- 5.3.4. South America
- 5.3.5. Middle East and Africa
- 5.1. Market Analysis, Insights and Forecast - by Type
- 6. Global Oil & Gas Pump Market Analysis, Insights and Forecast, 2021-2033
- 6.1. Market Analysis, Insights and Forecast - by Type
- 6.1.1. Dynamic Pumps
- 6.1.2. Positive Displacement Pumps
- 6.2. Market Analysis, Insights and Forecast - by Application
- 6.2.1. Upstream
- 6.2.2. Midstream
- 6.2.3. Downstream
- 6.1. Market Analysis, Insights and Forecast - by Type
- 7. North America Oil & Gas Pump Market Analysis, Insights and Forecast, 2020-2032
- 7.1. Market Analysis, Insights and Forecast - by Type
- 7.1.1. Dynamic Pumps
- 7.1.2. Positive Displacement Pumps
- 7.2. Market Analysis, Insights and Forecast - by Application
- 7.2.1. Upstream
- 7.2.2. Midstream
- 7.2.3. Downstream
- 7.1. Market Analysis, Insights and Forecast - by Type
- 8. Europe Oil & Gas Pump Market Analysis, Insights and Forecast, 2020-2032
- 8.1. Market Analysis, Insights and Forecast - by Type
- 8.1.1. Dynamic Pumps
- 8.1.2. Positive Displacement Pumps
- 8.2. Market Analysis, Insights and Forecast - by Application
- 8.2.1. Upstream
- 8.2.2. Midstream
- 8.2.3. Downstream
- 8.1. Market Analysis, Insights and Forecast - by Type
- 9. Asia Pacific Oil & Gas Pump Market Analysis, Insights and Forecast, 2020-2032
- 9.1. Market Analysis, Insights and Forecast - by Type
- 9.1.1. Dynamic Pumps
- 9.1.2. Positive Displacement Pumps
- 9.2. Market Analysis, Insights and Forecast - by Application
- 9.2.1. Upstream
- 9.2.2. Midstream
- 9.2.3. Downstream
- 9.1. Market Analysis, Insights and Forecast - by Type
- 10. South America Oil & Gas Pump Market Analysis, Insights and Forecast, 2020-2032
- 10.1. Market Analysis, Insights and Forecast - by Type
- 10.1.1. Dynamic Pumps
- 10.1.2. Positive Displacement Pumps
- 10.2. Market Analysis, Insights and Forecast - by Application
- 10.2.1. Upstream
- 10.2.2. Midstream
- 10.2.3. Downstream
- 10.1. Market Analysis, Insights and Forecast - by Type
- 11. Middle East and Africa Oil & Gas Pump Market Analysis, Insights and Forecast, 2020-2032
- 11.1. Market Analysis, Insights and Forecast - by Type
- 11.1.1. Dynamic Pumps
- 11.1.2. Positive Displacement Pumps
- 11.2. Market Analysis, Insights and Forecast - by Application
- 11.2.1. Upstream
- 11.2.2. Midstream
- 11.2.3. Downstream
- 11.1. Market Analysis, Insights and Forecast - by Type
- 12. Competitive Analysis
- 12.1. Company Profiles
- 12.1.1 Flowserve Corporation
- 12.1.1.1. Company Overview
- 12.1.1.2. Products
- 12.1.1.3. Company Financials
- 12.1.1.4. SWOT Analysis
- 12.1.2 Weir Group PLC
- 12.1.2.1. Company Overview
- 12.1.2.2. Products
- 12.1.2.3. Company Financials
- 12.1.2.4. SWOT Analysis
- 12.1.3 Xylem Inc
- 12.1.3.1. Company Overview
- 12.1.3.2. Products
- 12.1.3.3. Company Financials
- 12.1.3.4. SWOT Analysis
- 12.1.4 Grundfos Holding A/S
- 12.1.4.1. Company Overview
- 12.1.4.2. Products
- 12.1.4.3. Company Financials
- 12.1.4.4. SWOT Analysis
- 12.1.5 KSB SE & Co KGaA
- 12.1.5.1. Company Overview
- 12.1.5.2. Products
- 12.1.5.3. Company Financials
- 12.1.5.4. SWOT Analysis
- 12.1.6 ITT Inc
- 12.1.6.1. Company Overview
- 12.1.6.2. Products
- 12.1.6.3. Company Financials
- 12.1.6.4. SWOT Analysis
- 12.1.7 Baker Hughes Co
- 12.1.7.1. Company Overview
- 12.1.7.2. Products
- 12.1.7.3. Company Financials
- 12.1.7.4. SWOT Analysis
- 12.1.8 Sulzer AG
- 12.1.8.1. Company Overview
- 12.1.8.2. Products
- 12.1.8.3. Company Financials
- 12.1.8.4. SWOT Analysis
- 12.1.9 Alfa Laval AB
- 12.1.9.1. Company Overview
- 12.1.9.2. Products
- 12.1.9.3. Company Financials
- 12.1.9.4. SWOT Analysis
- 12.1.10 Gardner Denver Holdings Inc
- 12.1.10.1. Company Overview
- 12.1.10.2. Products
- 12.1.10.3. Company Financials
- 12.1.10.4. SWOT Analysis
- 12.1.1 Flowserve Corporation
- 12.2. Market Entropy
- 12.2.1 Company's Key Areas Served
- 12.2.2 Recent Developments
- 12.3. Company Market Share Analysis 2025
- 12.3.1 Top 5 Companies Market Share Analysis
- 12.3.2 Top 3 Companies Market Share Analysis
- 12.4. List of Potential Customers
- 13. Research Methodology
List of Figures
- Figure 1: Global Oil & Gas Pump Market Revenue Breakdown (billion, %) by Region 2025 & 2033
- Figure 2: Global Oil & Gas Pump Market Volume Breakdown (K Units, %) by Region 2025 & 2033
- Figure 3: North America Oil & Gas Pump Market Revenue (billion), by Type 2025 & 2033
- Figure 4: North America Oil & Gas Pump Market Volume (K Units), by Type 2025 & 2033
- Figure 5: North America Oil & Gas Pump Market Revenue Share (%), by Type 2025 & 2033
- Figure 6: North America Oil & Gas Pump Market Volume Share (%), by Type 2025 & 2033
- Figure 7: North America Oil & Gas Pump Market Revenue (billion), by Application 2025 & 2033
- Figure 8: North America Oil & Gas Pump Market Volume (K Units), by Application 2025 & 2033
- Figure 9: North America Oil & Gas Pump Market Revenue Share (%), by Application 2025 & 2033
- Figure 10: North America Oil & Gas Pump Market Volume Share (%), by Application 2025 & 2033
- Figure 11: North America Oil & Gas Pump Market Revenue (billion), by Country 2025 & 2033
- Figure 12: North America Oil & Gas Pump Market Volume (K Units), by Country 2025 & 2033
- Figure 13: North America Oil & Gas Pump Market Revenue Share (%), by Country 2025 & 2033
- Figure 14: North America Oil & Gas Pump Market Volume Share (%), by Country 2025 & 2033
- Figure 15: Europe Oil & Gas Pump Market Revenue (billion), by Type 2025 & 2033
- Figure 16: Europe Oil & Gas Pump Market Volume (K Units), by Type 2025 & 2033
- Figure 17: Europe Oil & Gas Pump Market Revenue Share (%), by Type 2025 & 2033
- Figure 18: Europe Oil & Gas Pump Market Volume Share (%), by Type 2025 & 2033
- Figure 19: Europe Oil & Gas Pump Market Revenue (billion), by Application 2025 & 2033
- Figure 20: Europe Oil & Gas Pump Market Volume (K Units), by Application 2025 & 2033
- Figure 21: Europe Oil & Gas Pump Market Revenue Share (%), by Application 2025 & 2033
- Figure 22: Europe Oil & Gas Pump Market Volume Share (%), by Application 2025 & 2033
- Figure 23: Europe Oil & Gas Pump Market Revenue (billion), by Country 2025 & 2033
- Figure 24: Europe Oil & Gas Pump Market Volume (K Units), by Country 2025 & 2033
- Figure 25: Europe Oil & Gas Pump Market Revenue Share (%), by Country 2025 & 2033
- Figure 26: Europe Oil & Gas Pump Market Volume Share (%), by Country 2025 & 2033
- Figure 27: Asia Pacific Oil & Gas Pump Market Revenue (billion), by Type 2025 & 2033
- Figure 28: Asia Pacific Oil & Gas Pump Market Volume (K Units), by Type 2025 & 2033
- Figure 29: Asia Pacific Oil & Gas Pump Market Revenue Share (%), by Type 2025 & 2033
- Figure 30: Asia Pacific Oil & Gas Pump Market Volume Share (%), by Type 2025 & 2033
- Figure 31: Asia Pacific Oil & Gas Pump Market Revenue (billion), by Application 2025 & 2033
- Figure 32: Asia Pacific Oil & Gas Pump Market Volume (K Units), by Application 2025 & 2033
- Figure 33: Asia Pacific Oil & Gas Pump Market Revenue Share (%), by Application 2025 & 2033
- Figure 34: Asia Pacific Oil & Gas Pump Market Volume Share (%), by Application 2025 & 2033
- Figure 35: Asia Pacific Oil & Gas Pump Market Revenue (billion), by Country 2025 & 2033
- Figure 36: Asia Pacific Oil & Gas Pump Market Volume (K Units), by Country 2025 & 2033
- Figure 37: Asia Pacific Oil & Gas Pump Market Revenue Share (%), by Country 2025 & 2033
- Figure 38: Asia Pacific Oil & Gas Pump Market Volume Share (%), by Country 2025 & 2033
- Figure 39: South America Oil & Gas Pump Market Revenue (billion), by Type 2025 & 2033
- Figure 40: South America Oil & Gas Pump Market Volume (K Units), by Type 2025 & 2033
- Figure 41: South America Oil & Gas Pump Market Revenue Share (%), by Type 2025 & 2033
- Figure 42: South America Oil & Gas Pump Market Volume Share (%), by Type 2025 & 2033
- Figure 43: South America Oil & Gas Pump Market Revenue (billion), by Application 2025 & 2033
- Figure 44: South America Oil & Gas Pump Market Volume (K Units), by Application 2025 & 2033
- Figure 45: South America Oil & Gas Pump Market Revenue Share (%), by Application 2025 & 2033
- Figure 46: South America Oil & Gas Pump Market Volume Share (%), by Application 2025 & 2033
- Figure 47: South America Oil & Gas Pump Market Revenue (billion), by Country 2025 & 2033
- Figure 48: South America Oil & Gas Pump Market Volume (K Units), by Country 2025 & 2033
- Figure 49: South America Oil & Gas Pump Market Revenue Share (%), by Country 2025 & 2033
- Figure 50: South America Oil & Gas Pump Market Volume Share (%), by Country 2025 & 2033
- Figure 51: Middle East and Africa Oil & Gas Pump Market Revenue (billion), by Type 2025 & 2033
- Figure 52: Middle East and Africa Oil & Gas Pump Market Volume (K Units), by Type 2025 & 2033
- Figure 53: Middle East and Africa Oil & Gas Pump Market Revenue Share (%), by Type 2025 & 2033
- Figure 54: Middle East and Africa Oil & Gas Pump Market Volume Share (%), by Type 2025 & 2033
- Figure 55: Middle East and Africa Oil & Gas Pump Market Revenue (billion), by Application 2025 & 2033
- Figure 56: Middle East and Africa Oil & Gas Pump Market Volume (K Units), by Application 2025 & 2033
- Figure 57: Middle East and Africa Oil & Gas Pump Market Revenue Share (%), by Application 2025 & 2033
- Figure 58: Middle East and Africa Oil & Gas Pump Market Volume Share (%), by Application 2025 & 2033
- Figure 59: Middle East and Africa Oil & Gas Pump Market Revenue (billion), by Country 2025 & 2033
- Figure 60: Middle East and Africa Oil & Gas Pump Market Volume (K Units), by Country 2025 & 2033
- Figure 61: Middle East and Africa Oil & Gas Pump Market Revenue Share (%), by Country 2025 & 2033
- Figure 62: Middle East and Africa Oil & Gas Pump Market Volume Share (%), by Country 2025 & 2033
List of Tables
- Table 1: Global Oil & Gas Pump Market Revenue billion Forecast, by Type 2020 & 2033
- Table 2: Global Oil & Gas Pump Market Volume K Units Forecast, by Type 2020 & 2033
- Table 3: Global Oil & Gas Pump Market Revenue billion Forecast, by Application 2020 & 2033
- Table 4: Global Oil & Gas Pump Market Volume K Units Forecast, by Application 2020 & 2033
- Table 5: Global Oil & Gas Pump Market Revenue billion Forecast, by Region 2020 & 2033
- Table 6: Global Oil & Gas Pump Market Volume K Units Forecast, by Region 2020 & 2033
- Table 7: Global Oil & Gas Pump Market Revenue billion Forecast, by Type 2020 & 2033
- Table 8: Global Oil & Gas Pump Market Volume K Units Forecast, by Type 2020 & 2033
- Table 9: Global Oil & Gas Pump Market Revenue billion Forecast, by Application 2020 & 2033
- Table 10: Global Oil & Gas Pump Market Volume K Units Forecast, by Application 2020 & 2033
- Table 11: Global Oil & Gas Pump Market Revenue billion Forecast, by Country 2020 & 2033
- Table 12: Global Oil & Gas Pump Market Volume K Units Forecast, by Country 2020 & 2033
- Table 13: Global Oil & Gas Pump Market Revenue billion Forecast, by Type 2020 & 2033
- Table 14: Global Oil & Gas Pump Market Volume K Units Forecast, by Type 2020 & 2033
- Table 15: Global Oil & Gas Pump Market Revenue billion Forecast, by Application 2020 & 2033
- Table 16: Global Oil & Gas Pump Market Volume K Units Forecast, by Application 2020 & 2033
- Table 17: Global Oil & Gas Pump Market Revenue billion Forecast, by Country 2020 & 2033
- Table 18: Global Oil & Gas Pump Market Volume K Units Forecast, by Country 2020 & 2033
- Table 19: Global Oil & Gas Pump Market Revenue billion Forecast, by Type 2020 & 2033
- Table 20: Global Oil & Gas Pump Market Volume K Units Forecast, by Type 2020 & 2033
- Table 21: Global Oil & Gas Pump Market Revenue billion Forecast, by Application 2020 & 2033
- Table 22: Global Oil & Gas Pump Market Volume K Units Forecast, by Application 2020 & 2033
- Table 23: Global Oil & Gas Pump Market Revenue billion Forecast, by Country 2020 & 2033
- Table 24: Global Oil & Gas Pump Market Volume K Units Forecast, by Country 2020 & 2033
- Table 25: Global Oil & Gas Pump Market Revenue billion Forecast, by Type 2020 & 2033
- Table 26: Global Oil & Gas Pump Market Volume K Units Forecast, by Type 2020 & 2033
- Table 27: Global Oil & Gas Pump Market Revenue billion Forecast, by Application 2020 & 2033
- Table 28: Global Oil & Gas Pump Market Volume K Units Forecast, by Application 2020 & 2033
- Table 29: Global Oil & Gas Pump Market Revenue billion Forecast, by Country 2020 & 2033
- Table 30: Global Oil & Gas Pump Market Volume K Units Forecast, by Country 2020 & 2033
- Table 31: Global Oil & Gas Pump Market Revenue billion Forecast, by Type 2020 & 2033
- Table 32: Global Oil & Gas Pump Market Volume K Units Forecast, by Type 2020 & 2033
- Table 33: Global Oil & Gas Pump Market Revenue billion Forecast, by Application 2020 & 2033
- Table 34: Global Oil & Gas Pump Market Volume K Units Forecast, by Application 2020 & 2033
- Table 35: Global Oil & Gas Pump Market Revenue billion Forecast, by Country 2020 & 2033
- Table 36: Global Oil & Gas Pump Market Volume K Units Forecast, by Country 2020 & 2033
Frequently Asked Questions
1. What is the projected Compound Annual Growth Rate (CAGR) of the Oil & Gas Pump Market?
The projected CAGR is approximately 8.8%.
2. Which companies are prominent players in the Oil & Gas Pump Market?
Key companies in the market include Flowserve Corporation, Weir Group PLC, Xylem Inc, Grundfos Holding A/S, KSB SE & Co KGaA, ITT Inc, Baker Hughes Co, Sulzer AG, Alfa Laval AB, Gardner Denver Holdings Inc.
3. What are the main segments of the Oil & Gas Pump Market?
The market segments include Type, Application.
4. Can you provide details about the market size?
The market size is estimated to be USD 14.27 billion as of 2022.
5. What are some drivers contributing to market growth?
4.; Increasing Investments in Offshore Wind Power Projects4.; Supportive Government Policies.
6. What are the notable trends driving market growth?
Increasing Demand for Dynamic Pumps (Centrifugal pumps) from Refineries.
7. Are there any restraints impacting market growth?
4.; Increasing Adopting of Alternative Clean Energy Sources (Ex: Solar. Hydro).
8. Can you provide examples of recent developments in the market?
N/A
9. What pricing options are available for accessing the report?
Pricing options include single-user, multi-user, and enterprise licenses priced at USD 4750, USD 5250, and USD 8750 respectively.
10. Is the market size provided in terms of value or volume?
The market size is provided in terms of value, measured in billion and volume, measured in K Units.
11. Are there any specific market keywords associated with the report?
Yes, the market keyword associated with the report is "Oil & Gas Pump Market," which aids in identifying and referencing the specific market segment covered.
12. How do I determine which pricing option suits my needs best?
The pricing options vary based on user requirements and access needs. Individual users may opt for single-user licenses, while businesses requiring broader access may choose multi-user or enterprise licenses for cost-effective access to the report.
13. Are there any additional resources or data provided in the Oil & Gas Pump Market report?
While the report offers comprehensive insights, it's advisable to review the specific contents or supplementary materials provided to ascertain if additional resources or data are available.
14. How can I stay updated on further developments or reports in the Oil & Gas Pump Market?
To stay informed about further developments, trends, and reports in the Oil & Gas Pump Market, consider subscribing to industry newsletters, following relevant companies and organizations, or regularly checking reputable industry news sources and publications.
Methodology
Step 1 - Identification of Relevant Samples Size from Population Database


Step 2 - Approaches for Defining Global Market Size (Value, Volume* & Price*)

Note*: In applicable scenarios
Step 3 - Data Sources
Primary Research
- Web Analytics
- Survey Reports
- Research Institute
- Latest Research Reports
- Opinion Leaders
Secondary Research
- Annual Reports
- White Paper
- Latest Press Release
- Industry Association
- Paid Database
- Investor Presentations

Step 4 - Data Triangulation
Involves using different sources of information in order to increase the validity of a study
These sources are likely to be stakeholders in a program - participants, other researchers, program staff, other community members, and so on.
Then we put all data in single framework & apply various statistical tools to find out the dynamic on the market.
During the analysis stage, feedback from the stakeholder groups would be compared to determine areas of agreement as well as areas of divergence