

Key Insights
The global oil well cement additives market is projected for significant expansion, fueled by escalating oil and gas extraction demands. For 2025, the estimated market size is $14.42 billion, with a projected Compound Annual Growth Rate (CAGR) of 13.82% for the forecast period of 2025-2033. This growth is underpinned by continuous advancements in additive technology, aimed at optimizing wellbore integrity, accelerating cement setting times, and enhancing performance in challenging downhole environments. Key market drivers include the increasing adoption of sustainable additives, the development of high-performance solutions for extreme temperature and pressure conditions, and substantial investments in research and development for improved cement formulations.
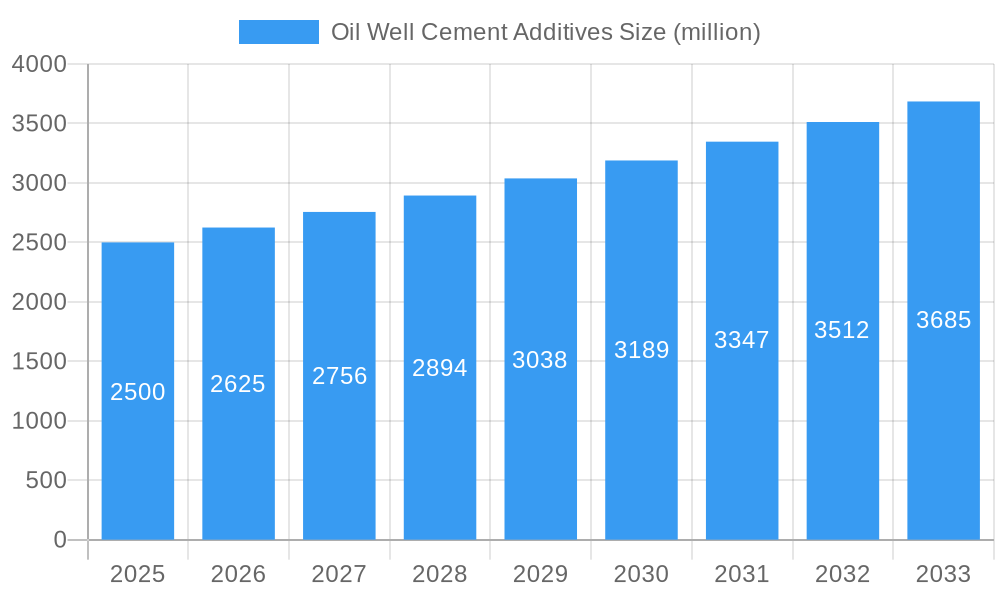
Oil Well Cement Additives Market Size (In Billion)
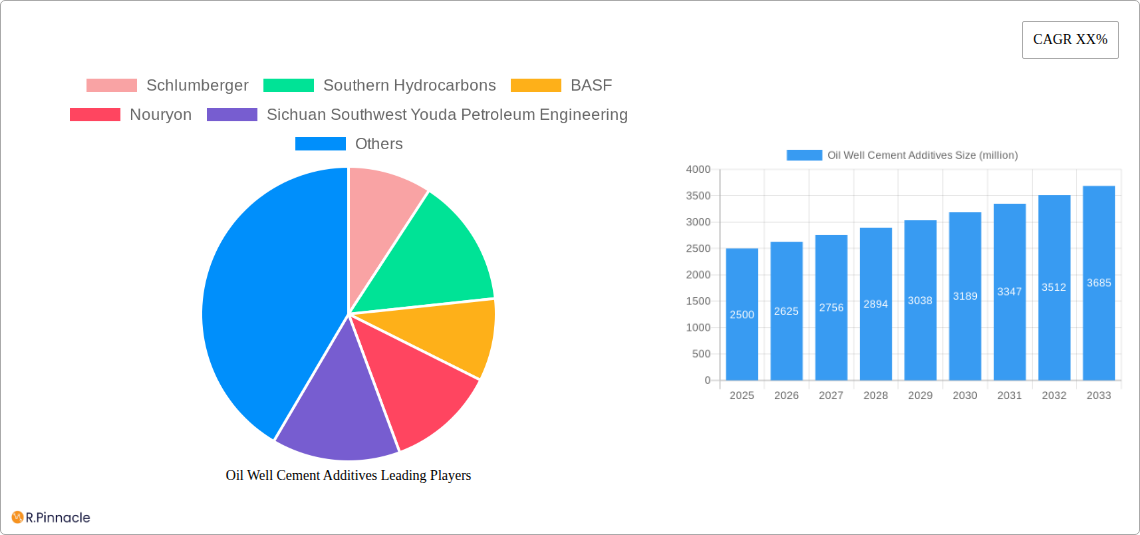
The market is segmented by additive type, application, and region. Leading players such as Schlumberger, BASF, and Nouryon command substantial market share through their established expertise and global reach. Opportunities exist for specialized firms introducing novel additive technologies. Continued global energy needs, exploration in complex geological formations, and technological innovation will propel market growth throughout the forecast period. Regional expansion will be influenced by exploration activity, regulatory landscapes, and infrastructure development.
Oil Well Cement Additives Company Market Share
Oil Well Cement Additives Market Report: 2019-2033 Forecast
This comprehensive report provides an in-depth analysis of the global oil well cement additives market, offering invaluable insights for industry professionals, investors, and stakeholders. With a study period spanning 2019-2033, a base year of 2025, and a forecast period of 2025-2033, this report leverages extensive data and expert analysis to illuminate current market dynamics and future trends. The market size is expected to reach xx million by 2033.
Oil Well Cement Additives Market Structure & Innovation Trends
This section analyzes the competitive landscape, highlighting market concentration, innovation drivers, regulatory influences, and M&A activity within the oil well cement additives market. Key players like Schlumberger, BASF, and Nouryon hold significant market share, with estimates suggesting Schlumberger commands approximately 20% and BASF holding around 15% in 2025. The market is moderately concentrated, with several regional players also exhibiting strong presence. Innovation is driven by the need for enhanced wellbore integrity, reduced environmental impact, and improved operational efficiency. Regulatory frameworks, particularly concerning environmental regulations and safety standards, significantly shape product development and market access. M&A activity in the historical period (2019-2024) saw several deals totaling approximately $xx million, largely driven by consolidation efforts and expansion into new geographical markets. Substitutes, such as alternative wellbore sealing methods, pose a moderate threat, though the established performance and cost-effectiveness of oil well cement additives maintain their dominance. End-user demographics are largely focused on upstream oil and gas companies, with varying needs across different geographical regions and well types.
- Market Concentration: Moderately concentrated, with a few major players and several regional competitors.
- Innovation Drivers: Enhanced wellbore integrity, reduced environmental impact, improved operational efficiency.
- Regulatory Framework: Stringent environmental regulations and safety standards.
- M&A Activity (2019-2024): Total deal value approximately $xx million.
Oil Well Cement Additives Market Dynamics & Trends
The oil well cement additives market is projected to experience a CAGR of xx% during the forecast period (2025-2033), driven by several key factors. Increased global oil and gas exploration and production activities fuel significant demand for reliable and efficient well cementing solutions. Technological advancements, such as the development of novel additives improving cement properties like strength, setting time, and rheology, are also contributing to market growth. Consumer preference shifts towards sustainable and environmentally friendly additives are influencing the demand for greener solutions. Competitive dynamics are characterized by intense rivalry amongst established players and emerging companies, pushing continuous innovation and product differentiation. The market penetration of advanced additives is gradually increasing, with a projected xx% penetration by 2033.
Dominant Regions & Segments in Oil Well Cement Additives
North America currently holds a dominant position in the oil well cement additives market, driven by robust upstream activities and technological advancements. This leadership is primarily attributed to the significant presence of major oil and gas companies and a well-established infrastructure. Other regions, such as the Middle East and Asia-Pacific, are experiencing substantial growth due to rising energy demands and exploration efforts in these areas.
- Key Drivers in North America:
- Robust upstream oil and gas activities.
- Advanced infrastructure and technological capabilities.
- Presence of major industry players.
- Key Drivers in Middle East & Asia-Pacific:
- Rising energy demands and exploration efforts.
- Significant investments in oil and gas infrastructure.
- Government support for the energy sector.
Oil Well Cement Additives Product Innovations
Recent product innovations focus on enhancing the performance and sustainability of oil well cement additives. New formulations are being developed to improve cement strength, reduce setting time, and minimize environmental impact. These advancements address critical wellbore integrity and operational efficiency challenges, enhancing the market fit and competitive advantage of innovative products. Technological trends include the use of nanomaterials, bio-based additives, and advanced rheology modifiers to tailor cement properties for specific well conditions.
Report Scope & Segmentation Analysis
This report segments the oil well cement additives market based on type (e.g., accelerators, retarders, water reducers), application (e.g., primary cementing, remedial cementing), and region. Each segment's growth projections, market size, and competitive dynamics are analyzed. The market for accelerators is anticipated to grow at a CAGR of xx%, driven by the increasing demand for faster setting times in well construction. The water reducers segment is also expected to witness significant growth due to the cost savings and performance enhancement they offer. The competitive dynamics vary across segments with some segments being more concentrated than others.
Key Drivers of Oil Well Cement Additives Growth
The primary drivers of market growth include increasing oil and gas exploration and production, stringent regulatory requirements for wellbore integrity, technological advancements leading to improved additive performance, and the rising demand for sustainable and environmentally friendly solutions. The growing awareness of environmental regulations is prompting the development and adoption of eco-friendly additives. Furthermore, government initiatives aimed at boosting domestic energy production are also contributing to the market expansion.
Challenges in the Oil Well Cement Additives Sector
Significant challenges include volatile oil and gas prices impacting investment decisions, supply chain disruptions affecting raw material availability, and intense competition among established and emerging players. Regulatory compliance and environmental concerns add to the complexity, while the development and adoption of innovative, sustainable, and cost-effective solutions remain crucial for market growth. Fluctuations in raw material prices add an additional layer of uncertainty, particularly for companies with less diversified sourcing strategies.
Emerging Opportunities in Oil Well Cement Additives
Emerging opportunities include the growing demand for enhanced oil recovery (EOR) techniques, which require specialized cement additives, and the expansion into unconventional oil and gas resources. The development of novel additives tailored for specific well conditions and the integration of digital technologies for optimized cementing operations present further avenues for market growth.
Leading Players in the Oil Well Cement Additives Market
- Schlumberger
- Southern Hydrocarbons
- BASF
- Nouryon
- Sichuan Southwest Youda Petroleum Engineering
- Zoranoc
- Beijing Oilchem Leader Science & Technology Development
- Shengkai (Shandong) Petroleum Technology
Key Developments in Oil Well Cement Additives Industry
- 2022 Q4: Schlumberger launched a new generation of environmentally friendly cement additives.
- 2023 Q1: BASF announced a strategic partnership to expand its manufacturing capacity in the Middle East.
- 2023 Q2: Nouryon acquired a smaller competitor, enhancing its market share. (Further details of acquisitions are not available for other companies within the time frame)
Future Outlook for Oil Well Cement Additives Market
The future outlook for the oil well cement additives market is positive, driven by continuous technological advancements, increasing energy demand, and the ongoing development of new oil and gas resources. Strategic partnerships and investments in research and development will be crucial for companies to maintain a competitive edge. The growing adoption of sustainable and environmentally responsible practices will further shape market dynamics and product development in the coming years.
Oil Well Cement Additives Segmentation
-
1. Application
- 1.1. Onshore Drilling
- 1.2. Offshore Drilling
- 1.3. Others
-
2. Types
- 2.1. Water Reducing Agent
- 2.2. Retarder
- 2.3. Drag Reducer
- 2.4. Defoaming Agent
- 2.5. Dispersant
- 2.6. Others
Oil Well Cement Additives Segmentation By Geography
-
1. North America
- 1.1. United States
- 1.2. Canada
- 1.3. Mexico
-
2. South America
- 2.1. Brazil
- 2.2. Argentina
- 2.3. Rest of South America
-
3. Europe
- 3.1. United Kingdom
- 3.2. Germany
- 3.3. France
- 3.4. Italy
- 3.5. Spain
- 3.6. Russia
- 3.7. Benelux
- 3.8. Nordics
- 3.9. Rest of Europe
-
4. Middle East & Africa
- 4.1. Turkey
- 4.2. Israel
- 4.3. GCC
- 4.4. North Africa
- 4.5. South Africa
- 4.6. Rest of Middle East & Africa
-
5. Asia Pacific
- 5.1. China
- 5.2. India
- 5.3. Japan
- 5.4. South Korea
- 5.5. ASEAN
- 5.6. Oceania
- 5.7. Rest of Asia Pacific
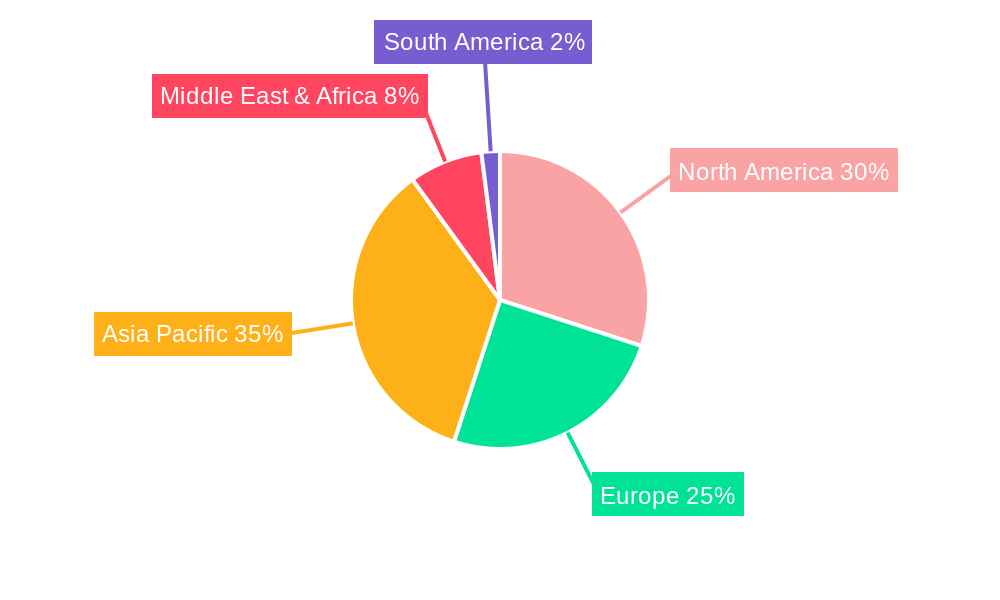
Oil Well Cement Additives Regional Market Share
Geographic Coverage of Oil Well Cement Additives
Oil Well Cement Additives REPORT HIGHLIGHTS
| Aspects | Details |
|---|---|
| Study Period | 2020-2034 |
| Base Year | 2025 |
| Estimated Year | 2026 |
| Forecast Period | 2026-2034 |
| Historical Period | 2020-2025 |
| Growth Rate | CAGR of 13.82% from 2020-2034 |
| Segmentation |
|
Table of Contents
- 1. Introduction
- 1.1. Research Scope
- 1.2. Market Segmentation
- 1.3. Research Methodology
- 1.4. Definitions and Assumptions
- 2. Executive Summary
- 2.1. Introduction
- 3. Market Dynamics
- 3.1. Introduction
- 3.2. Market Drivers
- 3.3. Market Restrains
- 3.4. Market Trends
- 4. Market Factor Analysis
- 4.1. Porters Five Forces
- 4.2. Supply/Value Chain
- 4.3. PESTEL analysis
- 4.4. Market Entropy
- 4.5. Patent/Trademark Analysis
- 5. Global Oil Well Cement Additives Analysis, Insights and Forecast, 2020-2032
- 5.1. Market Analysis, Insights and Forecast - by Application
- 5.1.1. Onshore Drilling
- 5.1.2. Offshore Drilling
- 5.1.3. Others
- 5.2. Market Analysis, Insights and Forecast - by Types
- 5.2.1. Water Reducing Agent
- 5.2.2. Retarder
- 5.2.3. Drag Reducer
- 5.2.4. Defoaming Agent
- 5.2.5. Dispersant
- 5.2.6. Others
- 5.3. Market Analysis, Insights and Forecast - by Region
- 5.3.1. North America
- 5.3.2. South America
- 5.3.3. Europe
- 5.3.4. Middle East & Africa
- 5.3.5. Asia Pacific
- 5.1. Market Analysis, Insights and Forecast - by Application
- 6. North America Oil Well Cement Additives Analysis, Insights and Forecast, 2020-2032
- 6.1. Market Analysis, Insights and Forecast - by Application
- 6.1.1. Onshore Drilling
- 6.1.2. Offshore Drilling
- 6.1.3. Others
- 6.2. Market Analysis, Insights and Forecast - by Types
- 6.2.1. Water Reducing Agent
- 6.2.2. Retarder
- 6.2.3. Drag Reducer
- 6.2.4. Defoaming Agent
- 6.2.5. Dispersant
- 6.2.6. Others
- 6.1. Market Analysis, Insights and Forecast - by Application
- 7. South America Oil Well Cement Additives Analysis, Insights and Forecast, 2020-2032
- 7.1. Market Analysis, Insights and Forecast - by Application
- 7.1.1. Onshore Drilling
- 7.1.2. Offshore Drilling
- 7.1.3. Others
- 7.2. Market Analysis, Insights and Forecast - by Types
- 7.2.1. Water Reducing Agent
- 7.2.2. Retarder
- 7.2.3. Drag Reducer
- 7.2.4. Defoaming Agent
- 7.2.5. Dispersant
- 7.2.6. Others
- 7.1. Market Analysis, Insights and Forecast - by Application
- 8. Europe Oil Well Cement Additives Analysis, Insights and Forecast, 2020-2032
- 8.1. Market Analysis, Insights and Forecast - by Application
- 8.1.1. Onshore Drilling
- 8.1.2. Offshore Drilling
- 8.1.3. Others
- 8.2. Market Analysis, Insights and Forecast - by Types
- 8.2.1. Water Reducing Agent
- 8.2.2. Retarder
- 8.2.3. Drag Reducer
- 8.2.4. Defoaming Agent
- 8.2.5. Dispersant
- 8.2.6. Others
- 8.1. Market Analysis, Insights and Forecast - by Application
- 9. Middle East & Africa Oil Well Cement Additives Analysis, Insights and Forecast, 2020-2032
- 9.1. Market Analysis, Insights and Forecast - by Application
- 9.1.1. Onshore Drilling
- 9.1.2. Offshore Drilling
- 9.1.3. Others
- 9.2. Market Analysis, Insights and Forecast - by Types
- 9.2.1. Water Reducing Agent
- 9.2.2. Retarder
- 9.2.3. Drag Reducer
- 9.2.4. Defoaming Agent
- 9.2.5. Dispersant
- 9.2.6. Others
- 9.1. Market Analysis, Insights and Forecast - by Application
- 10. Asia Pacific Oil Well Cement Additives Analysis, Insights and Forecast, 2020-2032
- 10.1. Market Analysis, Insights and Forecast - by Application
- 10.1.1. Onshore Drilling
- 10.1.2. Offshore Drilling
- 10.1.3. Others
- 10.2. Market Analysis, Insights and Forecast - by Types
- 10.2.1. Water Reducing Agent
- 10.2.2. Retarder
- 10.2.3. Drag Reducer
- 10.2.4. Defoaming Agent
- 10.2.5. Dispersant
- 10.2.6. Others
- 10.1. Market Analysis, Insights and Forecast - by Application
- 11. Competitive Analysis
- 11.1. Global Market Share Analysis 2025
- 11.2. Company Profiles
- 11.2.1 Schlumberger
- 11.2.1.1. Overview
- 11.2.1.2. Products
- 11.2.1.3. SWOT Analysis
- 11.2.1.4. Recent Developments
- 11.2.1.5. Financials (Based on Availability)
- 11.2.2 Southern Hydrocarbons
- 11.2.2.1. Overview
- 11.2.2.2. Products
- 11.2.2.3. SWOT Analysis
- 11.2.2.4. Recent Developments
- 11.2.2.5. Financials (Based on Availability)
- 11.2.3 BASF
- 11.2.3.1. Overview
- 11.2.3.2. Products
- 11.2.3.3. SWOT Analysis
- 11.2.3.4. Recent Developments
- 11.2.3.5. Financials (Based on Availability)
- 11.2.4 Nouryon
- 11.2.4.1. Overview
- 11.2.4.2. Products
- 11.2.4.3. SWOT Analysis
- 11.2.4.4. Recent Developments
- 11.2.4.5. Financials (Based on Availability)
- 11.2.5 Sichuan Southwest Youda Petroleum Engineering
- 11.2.5.1. Overview
- 11.2.5.2. Products
- 11.2.5.3. SWOT Analysis
- 11.2.5.4. Recent Developments
- 11.2.5.5. Financials (Based on Availability)
- 11.2.6 Zoranoc
- 11.2.6.1. Overview
- 11.2.6.2. Products
- 11.2.6.3. SWOT Analysis
- 11.2.6.4. Recent Developments
- 11.2.6.5. Financials (Based on Availability)
- 11.2.7 Beijing Oilchem Leader Science & Technology Development
- 11.2.7.1. Overview
- 11.2.7.2. Products
- 11.2.7.3. SWOT Analysis
- 11.2.7.4. Recent Developments
- 11.2.7.5. Financials (Based on Availability)
- 11.2.8 Shengkai (Shandong) Petroleum Technology
- 11.2.8.1. Overview
- 11.2.8.2. Products
- 11.2.8.3. SWOT Analysis
- 11.2.8.4. Recent Developments
- 11.2.8.5. Financials (Based on Availability)
- 11.2.1 Schlumberger
List of Figures
- Figure 1: Global Oil Well Cement Additives Revenue Breakdown (billion, %) by Region 2025 & 2033
- Figure 2: Global Oil Well Cement Additives Volume Breakdown (K, %) by Region 2025 & 2033
- Figure 3: North America Oil Well Cement Additives Revenue (billion), by Application 2025 & 2033
- Figure 4: North America Oil Well Cement Additives Volume (K), by Application 2025 & 2033
- Figure 5: North America Oil Well Cement Additives Revenue Share (%), by Application 2025 & 2033
- Figure 6: North America Oil Well Cement Additives Volume Share (%), by Application 2025 & 2033
- Figure 7: North America Oil Well Cement Additives Revenue (billion), by Types 2025 & 2033
- Figure 8: North America Oil Well Cement Additives Volume (K), by Types 2025 & 2033
- Figure 9: North America Oil Well Cement Additives Revenue Share (%), by Types 2025 & 2033
- Figure 10: North America Oil Well Cement Additives Volume Share (%), by Types 2025 & 2033
- Figure 11: North America Oil Well Cement Additives Revenue (billion), by Country 2025 & 2033
- Figure 12: North America Oil Well Cement Additives Volume (K), by Country 2025 & 2033
- Figure 13: North America Oil Well Cement Additives Revenue Share (%), by Country 2025 & 2033
- Figure 14: North America Oil Well Cement Additives Volume Share (%), by Country 2025 & 2033
- Figure 15: South America Oil Well Cement Additives Revenue (billion), by Application 2025 & 2033
- Figure 16: South America Oil Well Cement Additives Volume (K), by Application 2025 & 2033
- Figure 17: South America Oil Well Cement Additives Revenue Share (%), by Application 2025 & 2033
- Figure 18: South America Oil Well Cement Additives Volume Share (%), by Application 2025 & 2033
- Figure 19: South America Oil Well Cement Additives Revenue (billion), by Types 2025 & 2033
- Figure 20: South America Oil Well Cement Additives Volume (K), by Types 2025 & 2033
- Figure 21: South America Oil Well Cement Additives Revenue Share (%), by Types 2025 & 2033
- Figure 22: South America Oil Well Cement Additives Volume Share (%), by Types 2025 & 2033
- Figure 23: South America Oil Well Cement Additives Revenue (billion), by Country 2025 & 2033
- Figure 24: South America Oil Well Cement Additives Volume (K), by Country 2025 & 2033
- Figure 25: South America Oil Well Cement Additives Revenue Share (%), by Country 2025 & 2033
- Figure 26: South America Oil Well Cement Additives Volume Share (%), by Country 2025 & 2033
- Figure 27: Europe Oil Well Cement Additives Revenue (billion), by Application 2025 & 2033
- Figure 28: Europe Oil Well Cement Additives Volume (K), by Application 2025 & 2033
- Figure 29: Europe Oil Well Cement Additives Revenue Share (%), by Application 2025 & 2033
- Figure 30: Europe Oil Well Cement Additives Volume Share (%), by Application 2025 & 2033
- Figure 31: Europe Oil Well Cement Additives Revenue (billion), by Types 2025 & 2033
- Figure 32: Europe Oil Well Cement Additives Volume (K), by Types 2025 & 2033
- Figure 33: Europe Oil Well Cement Additives Revenue Share (%), by Types 2025 & 2033
- Figure 34: Europe Oil Well Cement Additives Volume Share (%), by Types 2025 & 2033
- Figure 35: Europe Oil Well Cement Additives Revenue (billion), by Country 2025 & 2033
- Figure 36: Europe Oil Well Cement Additives Volume (K), by Country 2025 & 2033
- Figure 37: Europe Oil Well Cement Additives Revenue Share (%), by Country 2025 & 2033
- Figure 38: Europe Oil Well Cement Additives Volume Share (%), by Country 2025 & 2033
- Figure 39: Middle East & Africa Oil Well Cement Additives Revenue (billion), by Application 2025 & 2033
- Figure 40: Middle East & Africa Oil Well Cement Additives Volume (K), by Application 2025 & 2033
- Figure 41: Middle East & Africa Oil Well Cement Additives Revenue Share (%), by Application 2025 & 2033
- Figure 42: Middle East & Africa Oil Well Cement Additives Volume Share (%), by Application 2025 & 2033
- Figure 43: Middle East & Africa Oil Well Cement Additives Revenue (billion), by Types 2025 & 2033
- Figure 44: Middle East & Africa Oil Well Cement Additives Volume (K), by Types 2025 & 2033
- Figure 45: Middle East & Africa Oil Well Cement Additives Revenue Share (%), by Types 2025 & 2033
- Figure 46: Middle East & Africa Oil Well Cement Additives Volume Share (%), by Types 2025 & 2033
- Figure 47: Middle East & Africa Oil Well Cement Additives Revenue (billion), by Country 2025 & 2033
- Figure 48: Middle East & Africa Oil Well Cement Additives Volume (K), by Country 2025 & 2033
- Figure 49: Middle East & Africa Oil Well Cement Additives Revenue Share (%), by Country 2025 & 2033
- Figure 50: Middle East & Africa Oil Well Cement Additives Volume Share (%), by Country 2025 & 2033
- Figure 51: Asia Pacific Oil Well Cement Additives Revenue (billion), by Application 2025 & 2033
- Figure 52: Asia Pacific Oil Well Cement Additives Volume (K), by Application 2025 & 2033
- Figure 53: Asia Pacific Oil Well Cement Additives Revenue Share (%), by Application 2025 & 2033
- Figure 54: Asia Pacific Oil Well Cement Additives Volume Share (%), by Application 2025 & 2033
- Figure 55: Asia Pacific Oil Well Cement Additives Revenue (billion), by Types 2025 & 2033
- Figure 56: Asia Pacific Oil Well Cement Additives Volume (K), by Types 2025 & 2033
- Figure 57: Asia Pacific Oil Well Cement Additives Revenue Share (%), by Types 2025 & 2033
- Figure 58: Asia Pacific Oil Well Cement Additives Volume Share (%), by Types 2025 & 2033
- Figure 59: Asia Pacific Oil Well Cement Additives Revenue (billion), by Country 2025 & 2033
- Figure 60: Asia Pacific Oil Well Cement Additives Volume (K), by Country 2025 & 2033
- Figure 61: Asia Pacific Oil Well Cement Additives Revenue Share (%), by Country 2025 & 2033
- Figure 62: Asia Pacific Oil Well Cement Additives Volume Share (%), by Country 2025 & 2033
List of Tables
- Table 1: Global Oil Well Cement Additives Revenue billion Forecast, by Application 2020 & 2033
- Table 2: Global Oil Well Cement Additives Volume K Forecast, by Application 2020 & 2033
- Table 3: Global Oil Well Cement Additives Revenue billion Forecast, by Types 2020 & 2033
- Table 4: Global Oil Well Cement Additives Volume K Forecast, by Types 2020 & 2033
- Table 5: Global Oil Well Cement Additives Revenue billion Forecast, by Region 2020 & 2033
- Table 6: Global Oil Well Cement Additives Volume K Forecast, by Region 2020 & 2033
- Table 7: Global Oil Well Cement Additives Revenue billion Forecast, by Application 2020 & 2033
- Table 8: Global Oil Well Cement Additives Volume K Forecast, by Application 2020 & 2033
- Table 9: Global Oil Well Cement Additives Revenue billion Forecast, by Types 2020 & 2033
- Table 10: Global Oil Well Cement Additives Volume K Forecast, by Types 2020 & 2033
- Table 11: Global Oil Well Cement Additives Revenue billion Forecast, by Country 2020 & 2033
- Table 12: Global Oil Well Cement Additives Volume K Forecast, by Country 2020 & 2033
- Table 13: United States Oil Well Cement Additives Revenue (billion) Forecast, by Application 2020 & 2033
- Table 14: United States Oil Well Cement Additives Volume (K) Forecast, by Application 2020 & 2033
- Table 15: Canada Oil Well Cement Additives Revenue (billion) Forecast, by Application 2020 & 2033
- Table 16: Canada Oil Well Cement Additives Volume (K) Forecast, by Application 2020 & 2033
- Table 17: Mexico Oil Well Cement Additives Revenue (billion) Forecast, by Application 2020 & 2033
- Table 18: Mexico Oil Well Cement Additives Volume (K) Forecast, by Application 2020 & 2033
- Table 19: Global Oil Well Cement Additives Revenue billion Forecast, by Application 2020 & 2033
- Table 20: Global Oil Well Cement Additives Volume K Forecast, by Application 2020 & 2033
- Table 21: Global Oil Well Cement Additives Revenue billion Forecast, by Types 2020 & 2033
- Table 22: Global Oil Well Cement Additives Volume K Forecast, by Types 2020 & 2033
- Table 23: Global Oil Well Cement Additives Revenue billion Forecast, by Country 2020 & 2033
- Table 24: Global Oil Well Cement Additives Volume K Forecast, by Country 2020 & 2033
- Table 25: Brazil Oil Well Cement Additives Revenue (billion) Forecast, by Application 2020 & 2033
- Table 26: Brazil Oil Well Cement Additives Volume (K) Forecast, by Application 2020 & 2033
- Table 27: Argentina Oil Well Cement Additives Revenue (billion) Forecast, by Application 2020 & 2033
- Table 28: Argentina Oil Well Cement Additives Volume (K) Forecast, by Application 2020 & 2033
- Table 29: Rest of South America Oil Well Cement Additives Revenue (billion) Forecast, by Application 2020 & 2033
- Table 30: Rest of South America Oil Well Cement Additives Volume (K) Forecast, by Application 2020 & 2033
- Table 31: Global Oil Well Cement Additives Revenue billion Forecast, by Application 2020 & 2033
- Table 32: Global Oil Well Cement Additives Volume K Forecast, by Application 2020 & 2033
- Table 33: Global Oil Well Cement Additives Revenue billion Forecast, by Types 2020 & 2033
- Table 34: Global Oil Well Cement Additives Volume K Forecast, by Types 2020 & 2033
- Table 35: Global Oil Well Cement Additives Revenue billion Forecast, by Country 2020 & 2033
- Table 36: Global Oil Well Cement Additives Volume K Forecast, by Country 2020 & 2033
- Table 37: United Kingdom Oil Well Cement Additives Revenue (billion) Forecast, by Application 2020 & 2033
- Table 38: United Kingdom Oil Well Cement Additives Volume (K) Forecast, by Application 2020 & 2033
- Table 39: Germany Oil Well Cement Additives Revenue (billion) Forecast, by Application 2020 & 2033
- Table 40: Germany Oil Well Cement Additives Volume (K) Forecast, by Application 2020 & 2033
- Table 41: France Oil Well Cement Additives Revenue (billion) Forecast, by Application 2020 & 2033
- Table 42: France Oil Well Cement Additives Volume (K) Forecast, by Application 2020 & 2033
- Table 43: Italy Oil Well Cement Additives Revenue (billion) Forecast, by Application 2020 & 2033
- Table 44: Italy Oil Well Cement Additives Volume (K) Forecast, by Application 2020 & 2033
- Table 45: Spain Oil Well Cement Additives Revenue (billion) Forecast, by Application 2020 & 2033
- Table 46: Spain Oil Well Cement Additives Volume (K) Forecast, by Application 2020 & 2033
- Table 47: Russia Oil Well Cement Additives Revenue (billion) Forecast, by Application 2020 & 2033
- Table 48: Russia Oil Well Cement Additives Volume (K) Forecast, by Application 2020 & 2033
- Table 49: Benelux Oil Well Cement Additives Revenue (billion) Forecast, by Application 2020 & 2033
- Table 50: Benelux Oil Well Cement Additives Volume (K) Forecast, by Application 2020 & 2033
- Table 51: Nordics Oil Well Cement Additives Revenue (billion) Forecast, by Application 2020 & 2033
- Table 52: Nordics Oil Well Cement Additives Volume (K) Forecast, by Application 2020 & 2033
- Table 53: Rest of Europe Oil Well Cement Additives Revenue (billion) Forecast, by Application 2020 & 2033
- Table 54: Rest of Europe Oil Well Cement Additives Volume (K) Forecast, by Application 2020 & 2033
- Table 55: Global Oil Well Cement Additives Revenue billion Forecast, by Application 2020 & 2033
- Table 56: Global Oil Well Cement Additives Volume K Forecast, by Application 2020 & 2033
- Table 57: Global Oil Well Cement Additives Revenue billion Forecast, by Types 2020 & 2033
- Table 58: Global Oil Well Cement Additives Volume K Forecast, by Types 2020 & 2033
- Table 59: Global Oil Well Cement Additives Revenue billion Forecast, by Country 2020 & 2033
- Table 60: Global Oil Well Cement Additives Volume K Forecast, by Country 2020 & 2033
- Table 61: Turkey Oil Well Cement Additives Revenue (billion) Forecast, by Application 2020 & 2033
- Table 62: Turkey Oil Well Cement Additives Volume (K) Forecast, by Application 2020 & 2033
- Table 63: Israel Oil Well Cement Additives Revenue (billion) Forecast, by Application 2020 & 2033
- Table 64: Israel Oil Well Cement Additives Volume (K) Forecast, by Application 2020 & 2033
- Table 65: GCC Oil Well Cement Additives Revenue (billion) Forecast, by Application 2020 & 2033
- Table 66: GCC Oil Well Cement Additives Volume (K) Forecast, by Application 2020 & 2033
- Table 67: North Africa Oil Well Cement Additives Revenue (billion) Forecast, by Application 2020 & 2033
- Table 68: North Africa Oil Well Cement Additives Volume (K) Forecast, by Application 2020 & 2033
- Table 69: South Africa Oil Well Cement Additives Revenue (billion) Forecast, by Application 2020 & 2033
- Table 70: South Africa Oil Well Cement Additives Volume (K) Forecast, by Application 2020 & 2033
- Table 71: Rest of Middle East & Africa Oil Well Cement Additives Revenue (billion) Forecast, by Application 2020 & 2033
- Table 72: Rest of Middle East & Africa Oil Well Cement Additives Volume (K) Forecast, by Application 2020 & 2033
- Table 73: Global Oil Well Cement Additives Revenue billion Forecast, by Application 2020 & 2033
- Table 74: Global Oil Well Cement Additives Volume K Forecast, by Application 2020 & 2033
- Table 75: Global Oil Well Cement Additives Revenue billion Forecast, by Types 2020 & 2033
- Table 76: Global Oil Well Cement Additives Volume K Forecast, by Types 2020 & 2033
- Table 77: Global Oil Well Cement Additives Revenue billion Forecast, by Country 2020 & 2033
- Table 78: Global Oil Well Cement Additives Volume K Forecast, by Country 2020 & 2033
- Table 79: China Oil Well Cement Additives Revenue (billion) Forecast, by Application 2020 & 2033
- Table 80: China Oil Well Cement Additives Volume (K) Forecast, by Application 2020 & 2033
- Table 81: India Oil Well Cement Additives Revenue (billion) Forecast, by Application 2020 & 2033
- Table 82: India Oil Well Cement Additives Volume (K) Forecast, by Application 2020 & 2033
- Table 83: Japan Oil Well Cement Additives Revenue (billion) Forecast, by Application 2020 & 2033
- Table 84: Japan Oil Well Cement Additives Volume (K) Forecast, by Application 2020 & 2033
- Table 85: South Korea Oil Well Cement Additives Revenue (billion) Forecast, by Application 2020 & 2033
- Table 86: South Korea Oil Well Cement Additives Volume (K) Forecast, by Application 2020 & 2033
- Table 87: ASEAN Oil Well Cement Additives Revenue (billion) Forecast, by Application 2020 & 2033
- Table 88: ASEAN Oil Well Cement Additives Volume (K) Forecast, by Application 2020 & 2033
- Table 89: Oceania Oil Well Cement Additives Revenue (billion) Forecast, by Application 2020 & 2033
- Table 90: Oceania Oil Well Cement Additives Volume (K) Forecast, by Application 2020 & 2033
- Table 91: Rest of Asia Pacific Oil Well Cement Additives Revenue (billion) Forecast, by Application 2020 & 2033
- Table 92: Rest of Asia Pacific Oil Well Cement Additives Volume (K) Forecast, by Application 2020 & 2033
Frequently Asked Questions
1. What is the projected Compound Annual Growth Rate (CAGR) of the Oil Well Cement Additives?
The projected CAGR is approximately 13.82%.
2. Which companies are prominent players in the Oil Well Cement Additives?
Key companies in the market include Schlumberger, Southern Hydrocarbons, BASF, Nouryon, Sichuan Southwest Youda Petroleum Engineering, Zoranoc, Beijing Oilchem Leader Science & Technology Development, Shengkai (Shandong) Petroleum Technology.
3. What are the main segments of the Oil Well Cement Additives?
The market segments include Application, Types.
4. Can you provide details about the market size?
The market size is estimated to be USD 14.42 billion as of 2022.
5. What are some drivers contributing to market growth?
N/A
6. What are the notable trends driving market growth?
N/A
7. Are there any restraints impacting market growth?
N/A
8. Can you provide examples of recent developments in the market?
N/A
9. What pricing options are available for accessing the report?
Pricing options include single-user, multi-user, and enterprise licenses priced at USD 3950.00, USD 5925.00, and USD 7900.00 respectively.
10. Is the market size provided in terms of value or volume?
The market size is provided in terms of value, measured in billion and volume, measured in K.
11. Are there any specific market keywords associated with the report?
Yes, the market keyword associated with the report is "Oil Well Cement Additives," which aids in identifying and referencing the specific market segment covered.
12. How do I determine which pricing option suits my needs best?
The pricing options vary based on user requirements and access needs. Individual users may opt for single-user licenses, while businesses requiring broader access may choose multi-user or enterprise licenses for cost-effective access to the report.
13. Are there any additional resources or data provided in the Oil Well Cement Additives report?
While the report offers comprehensive insights, it's advisable to review the specific contents or supplementary materials provided to ascertain if additional resources or data are available.
14. How can I stay updated on further developments or reports in the Oil Well Cement Additives?
To stay informed about further developments, trends, and reports in the Oil Well Cement Additives, consider subscribing to industry newsletters, following relevant companies and organizations, or regularly checking reputable industry news sources and publications.
Methodology
Step 1 - Identification of Relevant Samples Size from Population Database


Step 2 - Approaches for Defining Global Market Size (Value, Volume* & Price*)

Note*: In applicable scenarios
Step 3 - Data Sources
Primary Research
- Web Analytics
- Survey Reports
- Research Institute
- Latest Research Reports
- Opinion Leaders
Secondary Research
- Annual Reports
- White Paper
- Latest Press Release
- Industry Association
- Paid Database
- Investor Presentations

Step 4 - Data Triangulation
Involves using different sources of information in order to increase the validity of a study
These sources are likely to be stakeholders in a program - participants, other researchers, program staff, other community members, and so on.
Then we put all data in single framework & apply various statistical tools to find out the dynamic on the market.
During the analysis stage, feedback from the stakeholder groups would be compared to determine areas of agreement as well as areas of divergence