Analyzing the Future of On-board Connectivity Market: Key Trends to 2033

On-board Connectivity Market by Production Analysis, by Consumption Analysis, by Import Market Analysis (Value & Volume), by Export Market Analysis (Value & Volume), by Price Trend Analysis, by North America (United States, Canada, Mexico), by South America (Brazil, Argentina, Rest of South America), by Europe (United Kingdom, Germany, France, Italy, Spain, Russia, Benelux, Nordics, Rest of Europe), by Middle East & Africa (Turkey, Israel, GCC, North Africa, South Africa, Rest of Middle East & Africa), by Asia Pacific (China, India, Japan, South Korea, ASEAN, Oceania, Rest of Asia Pacific) Forecast 2025-2033

Jul 2 2025
Base Year: 2024

234 Pages
Main Logo

Analyzing the Future of On-board Connectivity Market: Key Trends to 2033


Home
Industries
Aerospace & Defense
sponsor image
sponsor image
sponsor image
sponsor image

Tailored for you

  • In-depth Analysis Tailored to Specified Regions or Segments
  • Company Profiles Customized to User Preferences
  • Comprehensive Insights Focused on Specific Segments or Regions
  • Customized Evaluation of Competitive Landscape to Meet Your Needs
  • Tailored Customization to Address Other Specific Requirements
Ask for customization


Key Insights

The onboard connectivity market is experiencing robust growth, fueled by the increasing demand for seamless communication and entertainment within various transportation modes. The market's Compound Annual Growth Rate (CAGR) of 13.80% from 2019 to 2033 signifies a substantial expansion, driven primarily by the proliferation of smart devices, rising passenger expectations for in-flight Wi-Fi and entertainment options, and the growing adoption of Internet of Things (IoT) technologies in the transportation sector. Key segments driving this growth include in-flight connectivity solutions, particularly in the airline industry, and railway communication systems focused on improved passenger experience and operational efficiency. Technological advancements in satellite communication, 5G networks, and improved antenna technology are further contributing to enhanced connectivity speeds and reliability, making onboard connectivity a more attractive proposition for both passengers and operators. While initial infrastructure investments pose a restraint, the long-term return on investment (ROI) from increased passenger satisfaction and operational optimization is driving rapid market penetration. Major players like Nokia, AT&T, Honeywell, and Inmarsat are actively involved in developing and deploying innovative solutions, leading to intensified competition and market consolidation. The North American and Asia-Pacific regions are expected to be significant contributors to the overall market growth due to high levels of technological adoption and the presence of major market players in these areas.
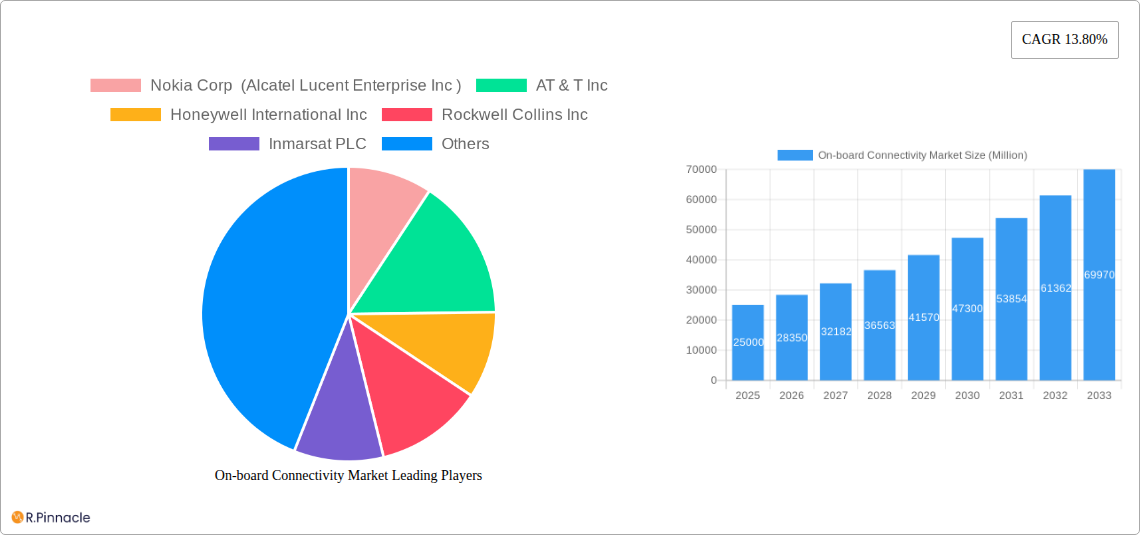
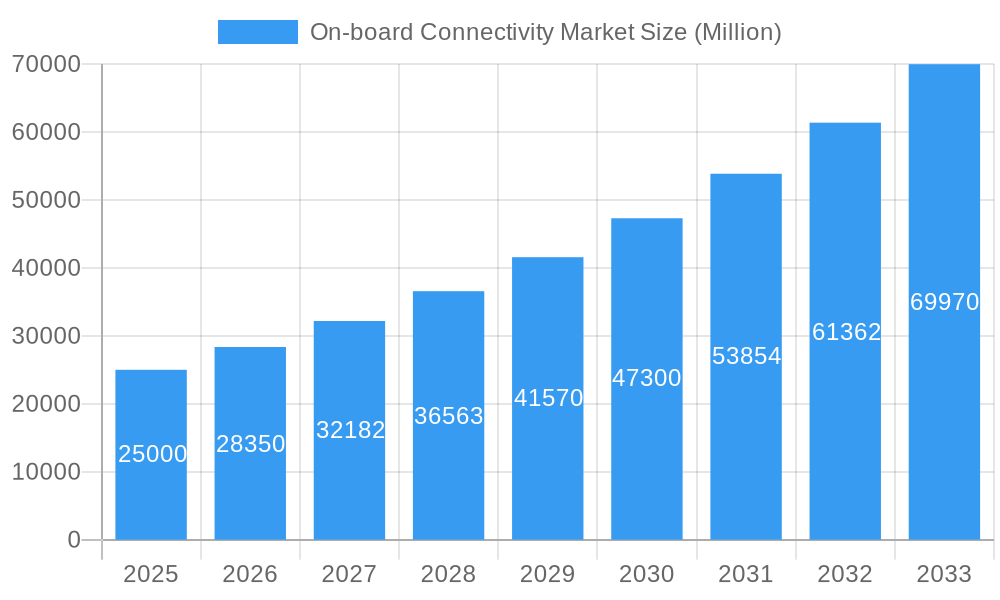
The future of the onboard connectivity market hinges on continued innovation and the integration of advanced technologies. The successful deployment of low-earth orbit (LEO) satellite constellations promises to significantly improve global coverage and bandwidth, addressing current limitations in remote areas. Furthermore, the increasing adoption of edge computing and AI technologies will enhance network performance and security, creating an increasingly sophisticated and user-friendly experience. Regulatory changes impacting spectrum allocation and cybersecurity will also play a vital role in shaping the future trajectory of the market. The growth will continue to be influenced by factors such as the expansion of high-speed rail networks, rising air travel, and the increasing adoption of connected vehicles. Ultimately, the demand for enhanced connectivity is driving market expansion and will continue to do so in the coming years.

On-board Connectivity Market Research Report - Market Size, Growth & Forecast

On-Board Connectivity Market Report: 2019-2033 Forecast

This comprehensive report provides an in-depth analysis of the On-board Connectivity Market, offering invaluable insights for industry professionals, investors, and strategic decision-makers. Covering the period from 2019 to 2033, with a focus on the year 2025, this report unveils the market's structure, dynamics, dominant players, and future potential. The report projects a market valued at xx Million by 2033, exhibiting a robust CAGR of xx% during the forecast period (2025-2033).

On-board Connectivity Market Market Structure & Innovation Trends

This section analyzes the competitive landscape of the on-board connectivity market, examining market concentration, innovation drivers, regulatory influences, and market dynamics. The market is characterized by a moderate level of concentration, with key players holding significant market share. For instance, Nokia Corp (Alcatel Lucent Enterprise Inc) and Huawei Technologies Co Ltd collectively hold an estimated xx% market share as of 2025. Innovation is driven by increasing demand for high-speed internet access, advancements in 5G technology, and the growing adoption of IoT devices within various transportation sectors. Regulatory frameworks, particularly those related to spectrum allocation and cybersecurity, significantly impact market growth. The market witnesses frequent M&A activities, with total deal values exceeding xx Million in the last five years. Key examples include [Insert Specific M&A examples with deal values if available, otherwise state "Specific deal details are confidential"]. Product substitutes, such as terrestrial communication networks, pose a competitive threat, particularly in areas with robust ground-based infrastructure. End-user demographics show a strong correlation between market growth and the adoption of connected devices across various transportation segments.

On-board Connectivity Market Growth

On-board Connectivity Market Market Dynamics & Trends

The on-board connectivity market is experiencing substantial growth fueled by several key factors. The rising demand for seamless connectivity across various transportation modes, including airlines, railways, and automobiles, is a primary driver. Technological advancements, such as the deployment of 5G networks and satellite-based communication systems, are further accelerating market expansion. Consumer preferences are shifting towards enhanced in-flight entertainment, real-time data access, and improved safety features, driving the adoption of on-board connectivity solutions. Competitive dynamics are characterized by intense rivalry among established players and the emergence of new entrants offering innovative solutions. The market penetration rate for on-board connectivity is estimated at xx% in 2025, with projections indicating a significant increase to xx% by 2033. This growth is underpinned by the increasing affordability of on-board connectivity solutions and the growing awareness of their benefits among consumers and businesses.

On-board Connectivity Market Growth

Dominant Regions & Segments in On-board Connectivity Market

  • Dominant Region: North America currently leads the on-board connectivity market, driven by strong technological advancements, robust infrastructure development, and high consumer adoption rates. Europe follows closely, with significant growth opportunities in high-speed rail and air travel.

  • Dominant Segments:

    • By Type: The service segment holds a larger market share compared to the solution segment, primarily due to the increasing demand for managed services and network operation support.

    • By End-user Industry: The Transportation segment, encompassing both air and rail transportation, dominates the market due to the high concentration of passengers and the need for reliable communication systems. Within transportation, the railway segment shows a significant growth rate, particularly in high-speed rail networks. Specifically, the communication segment within the railway sector is expanding rapidly. This is driven by the increasing need for real-time communication and data exchange between trains and control centers. The entertainment segment is also experiencing substantial growth, fuelled by the increasing demand for in-train entertainment systems and better connectivity.

  • Key Drivers: Strong economic growth in developed regions, government initiatives promoting digital infrastructure development, and supportive regulatory frameworks contribute to market expansion. Furthermore, investments in advanced technologies are stimulating growth.

The dominance of North America is attributed to its advanced infrastructure, high disposable income, and the early adoption of new technologies. However, developing economies in Asia-Pacific are exhibiting rapid growth, presenting significant opportunities in the coming years.

On-board Connectivity Market Product Innovations

Recent advancements in on-board connectivity focus on enhancing speed, reliability, and security. The integration of 5G and satellite technologies is improving data throughput and coverage, while advancements in cybersecurity protocols enhance data protection. New applications, such as real-time passenger tracking, remote diagnostics, and predictive maintenance, are driving market expansion. These innovations are providing a competitive advantage to companies that can offer superior performance, reliability, and security features.

Report Scope & Segmentation Analysis

This report segments the on-board connectivity market by type (Solution, Service) and by end-user industry (Transportation, Railway). Within the transportation segment, further segmentation is undertaken by application (Entertainment, Monitoring, Communication). Each segment is analyzed in terms of its market size, growth rate, and competitive dynamics. The service segment is projected to grow at a CAGR of xx% during the forecast period, driven by the rising demand for managed services. The solution segment is anticipated to register a CAGR of xx%, owing to the increasing adoption of advanced connectivity solutions. Within the end-user industries, the transportation segment is expected to lead growth, driven by the expansion of air travel and the adoption of smart transportation technologies. The railway segment will follow, with significant growth projected across various sub-segments.

Key Drivers of On-board Connectivity Market Growth

The on-board connectivity market is experiencing rapid growth due to several key factors. Technological advancements, particularly in 5G and satellite communication, provide higher speeds and broader coverage. Government initiatives promoting digital infrastructure development in various regions are creating favorable conditions for market expansion. Furthermore, increasing consumer demand for in-flight entertainment, improved safety features, and access to information while traveling are significant drivers.

Challenges in the On-board Connectivity Market Sector

The on-board connectivity market faces challenges such as high infrastructure costs, the need for regulatory approvals, and the complexities of integrating various technologies. Supply chain disruptions can also impact market growth. Competition among existing players and the entry of new players present further challenges. These factors can constrain market growth and require players to adopt strategic measures. For example, regulatory hurdles in spectrum allocation can delay project deployment and increase overall costs (estimated impact: xx Million annually).

Emerging Opportunities in On-board Connectivity Market

Emerging opportunities include the expansion of on-board connectivity into new markets, such as autonomous vehicles and smart cities. The development of new technologies, such as low-earth orbit (LEO) satellite constellations, promises enhanced coverage and speeds. Moreover, growing consumer demand for personalized entertainment and data-driven services presents further opportunities for market expansion.

Leading Players in the On-board Connectivity Market Market

  • Nokia Corp (Alcatel Lucent Enterprise Inc)
  • AT&T Inc
  • Honeywell International Inc
  • Rockwell Collins Inc
  • Inmarsat PLC
  • Huawei Technologies Co Ltd
  • ZTE Corporation
  • Viasat Inc
  • Bombardier Aerospace Inc
  • Panasonic Corporation

Key Developments in On-board Connectivity Market Industry

  • January 2023: Nokia Corp announces a new partnership with a major airline to deploy its 5G network on board.
  • March 2022: Inmarsat PLC launches a new satellite constellation to provide global broadband coverage. [Add more specific details on other developments if available].

Future Outlook for On-board Connectivity Market Market

The future of the on-board connectivity market is promising, with significant growth potential driven by technological advancements, increasing consumer demand, and supportive government policies. The market is expected to witness continued adoption of 5G and satellite technologies, leading to enhanced coverage, speed, and reliability. Further expansion into new applications and markets will create lucrative opportunities for market players. The focus on delivering seamless, secure, and reliable connectivity will remain a key driver of market expansion.

On-board Connectivity Market Segmentation

  • 1. Production Analysis
  • 2. Consumption Analysis
  • 3. Import Market Analysis (Value & Volume)
  • 4. Export Market Analysis (Value & Volume)
  • 5. Price Trend Analysis

On-board Connectivity Market Segmentation By Geography

  • 1. North America
    • 1.1. United States
    • 1.2. Canada
    • 1.3. Mexico
  • 2. South America
    • 2.1. Brazil
    • 2.2. Argentina
    • 2.3. Rest of South America
  • 3. Europe
    • 3.1. United Kingdom
    • 3.2. Germany
    • 3.3. France
    • 3.4. Italy
    • 3.5. Spain
    • 3.6. Russia
    • 3.7. Benelux
    • 3.8. Nordics
    • 3.9. Rest of Europe
  • 4. Middle East & Africa
    • 4.1. Turkey
    • 4.2. Israel
    • 4.3. GCC
    • 4.4. North Africa
    • 4.5. South Africa
    • 4.6. Rest of Middle East & Africa
  • 5. Asia Pacific
    • 5.1. China
    • 5.2. India
    • 5.3. Japan
    • 5.4. South Korea
    • 5.5. ASEAN
    • 5.6. Oceania
    • 5.7. Rest of Asia Pacific
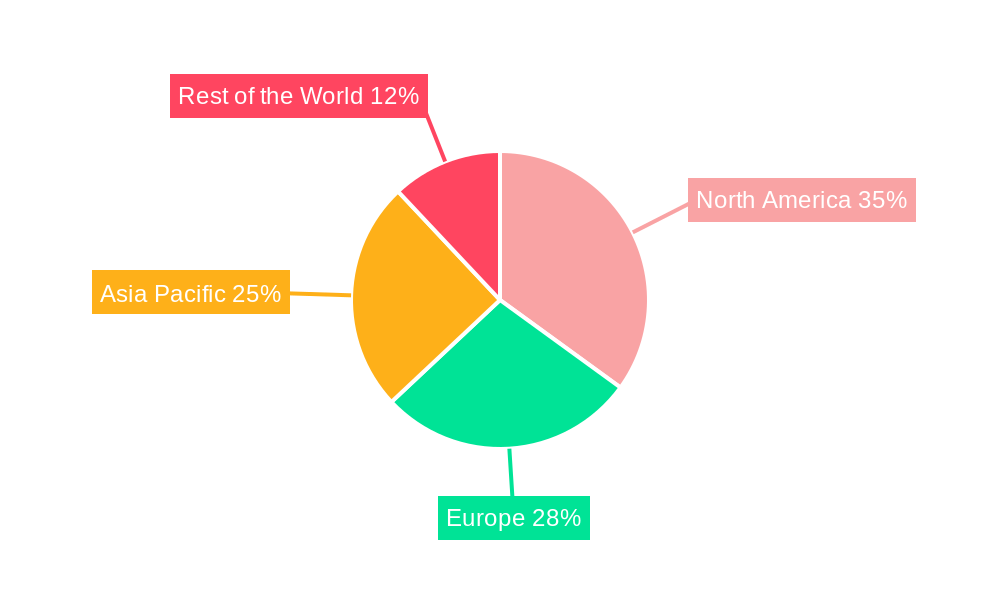
On-board Connectivity Market Regional Share


On-board Connectivity Market REPORT HIGHLIGHTS

AspectsDetails
Study Period 2019-2033
Base Year 2024
Estimated Year 2025
Forecast Period2025-2033
Historical Period2019-2024
Growth RateCAGR of 13.80% from 2019-2033
Segmentation
    • By Production Analysis
    • By Consumption Analysis
    • By Import Market Analysis (Value & Volume)
    • By Export Market Analysis (Value & Volume)
    • By Price Trend Analysis
  • By Geography
    • North America
      • United States
      • Canada
      • Mexico
    • South America
      • Brazil
      • Argentina
      • Rest of South America
    • Europe
      • United Kingdom
      • Germany
      • France
      • Italy
      • Spain
      • Russia
      • Benelux
      • Nordics
      • Rest of Europe
    • Middle East & Africa
      • Turkey
      • Israel
      • GCC
      • North Africa
      • South Africa
      • Rest of Middle East & Africa
    • Asia Pacific
      • China
      • India
      • Japan
      • South Korea
      • ASEAN
      • Oceania
      • Rest of Asia Pacific


Table of Contents

  1. 1. Introduction
    • 1.1. Research Scope
    • 1.2. Market Segmentation
    • 1.3. Research Methodology
    • 1.4. Definitions and Assumptions
  2. 2. Executive Summary
    • 2.1. Introduction
  3. 3. Market Dynamics
    • 3.1. Introduction
      • 3.2. Market Drivers
        • 3.2.1. ; Increasing Number Of Air Passengers; Use Of Portable Electronic Devices
      • 3.3. Market Restrains
        • 3.3.1. ; High Cost Of Connectivity Equipments
      • 3.4. Market Trends
        • 3.4.1. Aviation Industry Expected to Witness Significant Growth
  4. 4. Market Factor Analysis
    • 4.1. Porters Five Forces
    • 4.2. Supply/Value Chain
    • 4.3. PESTEL analysis
    • 4.4. Market Entropy
    • 4.5. Patent/Trademark Analysis
  5. 5. Global On-board Connectivity Market Analysis, Insights and Forecast, 2019-2031
    • 5.1. Market Analysis, Insights and Forecast - by Production Analysis
      • 5.2. Market Analysis, Insights and Forecast - by Consumption Analysis
        • 5.3. Market Analysis, Insights and Forecast - by Import Market Analysis (Value & Volume)
          • 5.4. Market Analysis, Insights and Forecast - by Export Market Analysis (Value & Volume)
            • 5.5. Market Analysis, Insights and Forecast - by Price Trend Analysis
              • 5.6. Market Analysis, Insights and Forecast - by Region
                • 5.6.1. North America
                • 5.6.2. South America
                • 5.6.3. Europe
                • 5.6.4. Middle East & Africa
                • 5.6.5. Asia Pacific
            • 6. North America On-board Connectivity Market Analysis, Insights and Forecast, 2019-2031
              • 6.1. Market Analysis, Insights and Forecast - by Production Analysis
                • 6.2. Market Analysis, Insights and Forecast - by Consumption Analysis
                  • 6.3. Market Analysis, Insights and Forecast - by Import Market Analysis (Value & Volume)
                    • 6.4. Market Analysis, Insights and Forecast - by Export Market Analysis (Value & Volume)
                      • 6.5. Market Analysis, Insights and Forecast - by Price Trend Analysis
                      • 7. South America On-board Connectivity Market Analysis, Insights and Forecast, 2019-2031
                        • 7.1. Market Analysis, Insights and Forecast - by Production Analysis
                          • 7.2. Market Analysis, Insights and Forecast - by Consumption Analysis
                            • 7.3. Market Analysis, Insights and Forecast - by Import Market Analysis (Value & Volume)
                              • 7.4. Market Analysis, Insights and Forecast - by Export Market Analysis (Value & Volume)
                                • 7.5. Market Analysis, Insights and Forecast - by Price Trend Analysis
                                • 8. Europe On-board Connectivity Market Analysis, Insights and Forecast, 2019-2031
                                  • 8.1. Market Analysis, Insights and Forecast - by Production Analysis
                                    • 8.2. Market Analysis, Insights and Forecast - by Consumption Analysis
                                      • 8.3. Market Analysis, Insights and Forecast - by Import Market Analysis (Value & Volume)
                                        • 8.4. Market Analysis, Insights and Forecast - by Export Market Analysis (Value & Volume)
                                          • 8.5. Market Analysis, Insights and Forecast - by Price Trend Analysis
                                          • 9. Middle East & Africa On-board Connectivity Market Analysis, Insights and Forecast, 2019-2031
                                            • 9.1. Market Analysis, Insights and Forecast - by Production Analysis
                                              • 9.2. Market Analysis, Insights and Forecast - by Consumption Analysis
                                                • 9.3. Market Analysis, Insights and Forecast - by Import Market Analysis (Value & Volume)
                                                  • 9.4. Market Analysis, Insights and Forecast - by Export Market Analysis (Value & Volume)
                                                    • 9.5. Market Analysis, Insights and Forecast - by Price Trend Analysis
                                                    • 10. Asia Pacific On-board Connectivity Market Analysis, Insights and Forecast, 2019-2031
                                                      • 10.1. Market Analysis, Insights and Forecast - by Production Analysis
                                                        • 10.2. Market Analysis, Insights and Forecast - by Consumption Analysis
                                                          • 10.3. Market Analysis, Insights and Forecast - by Import Market Analysis (Value & Volume)
                                                            • 10.4. Market Analysis, Insights and Forecast - by Export Market Analysis (Value & Volume)
                                                              • 10.5. Market Analysis, Insights and Forecast - by Price Trend Analysis
                                                              • 11. North America On-board Connectivity Market Analysis, Insights and Forecast, 2019-2031
                                                                  • 11.1. Market Analysis, Insights and Forecast - By Country/Sub-region
                                                                    • 11.1.1 US
                                                                    • 11.1.2 Canada
                                                              • 12. Europe On-board Connectivity Market Analysis, Insights and Forecast, 2019-2031
                                                                  • 12.1. Market Analysis, Insights and Forecast - By Country/Sub-region
                                                                    • 12.1.1 Germany
                                                                    • 12.1.2 UK
                                                                    • 12.1.3 France
                                                              • 13. Asia Pacific On-board Connectivity Market Analysis, Insights and Forecast, 2019-2031
                                                                  • 13.1. Market Analysis, Insights and Forecast - By Country/Sub-region
                                                                    • 13.1.1 China
                                                                    • 13.1.2 Japan
                                                                    • 13.1.3 India
                                                              • 14. Rest of the world On-board Connectivity Market Analysis, Insights and Forecast, 2019-2031
                                                                  • 14.1. Market Analysis, Insights and Forecast - By Country/Sub-region
                                                                    • 14.1.1.
                                                              • 15. Competitive Analysis
                                                                • 15.1. Global Market Share Analysis 2024
                                                                  • 15.2. Company Profiles
                                                                    • 15.2.1 Nokia Corp (Alcatel Lucent Enterprise Inc )
                                                                      • 15.2.1.1. Overview
                                                                      • 15.2.1.2. Products
                                                                      • 15.2.1.3. SWOT Analysis
                                                                      • 15.2.1.4. Recent Developments
                                                                      • 15.2.1.5. Financials (Based on Availability)
                                                                    • 15.2.2 AT & T Inc
                                                                      • 15.2.2.1. Overview
                                                                      • 15.2.2.2. Products
                                                                      • 15.2.2.3. SWOT Analysis
                                                                      • 15.2.2.4. Recent Developments
                                                                      • 15.2.2.5. Financials (Based on Availability)
                                                                    • 15.2.3 Honeywell International Inc
                                                                      • 15.2.3.1. Overview
                                                                      • 15.2.3.2. Products
                                                                      • 15.2.3.3. SWOT Analysis
                                                                      • 15.2.3.4. Recent Developments
                                                                      • 15.2.3.5. Financials (Based on Availability)
                                                                    • 15.2.4 Rockwell Collins Inc
                                                                      • 15.2.4.1. Overview
                                                                      • 15.2.4.2. Products
                                                                      • 15.2.4.3. SWOT Analysis
                                                                      • 15.2.4.4. Recent Developments
                                                                      • 15.2.4.5. Financials (Based on Availability)
                                                                    • 15.2.5 Inmarsat PLC
                                                                      • 15.2.5.1. Overview
                                                                      • 15.2.5.2. Products
                                                                      • 15.2.5.3. SWOT Analysis
                                                                      • 15.2.5.4. Recent Developments
                                                                      • 15.2.5.5. Financials (Based on Availability)
                                                                    • 15.2.6 Huawei Technologies Co Ltd
                                                                      • 15.2.6.1. Overview
                                                                      • 15.2.6.2. Products
                                                                      • 15.2.6.3. SWOT Analysis
                                                                      • 15.2.6.4. Recent Developments
                                                                      • 15.2.6.5. Financials (Based on Availability)
                                                                    • 15.2.7 ZTE Corporation
                                                                      • 15.2.7.1. Overview
                                                                      • 15.2.7.2. Products
                                                                      • 15.2.7.3. SWOT Analysis
                                                                      • 15.2.7.4. Recent Developments
                                                                      • 15.2.7.5. Financials (Based on Availability)
                                                                    • 15.2.8 Viasat Inc *List Not Exhaustive
                                                                      • 15.2.8.1. Overview
                                                                      • 15.2.8.2. Products
                                                                      • 15.2.8.3. SWOT Analysis
                                                                      • 15.2.8.4. Recent Developments
                                                                      • 15.2.8.5. Financials (Based on Availability)
                                                                    • 15.2.9 Bombardier Aerospace Inc
                                                                      • 15.2.9.1. Overview
                                                                      • 15.2.9.2. Products
                                                                      • 15.2.9.3. SWOT Analysis
                                                                      • 15.2.9.4. Recent Developments
                                                                      • 15.2.9.5. Financials (Based on Availability)
                                                                    • 15.2.10 Panasonic Corporation
                                                                      • 15.2.10.1. Overview
                                                                      • 15.2.10.2. Products
                                                                      • 15.2.10.3. SWOT Analysis
                                                                      • 15.2.10.4. Recent Developments
                                                                      • 15.2.10.5. Financials (Based on Availability)

                                                              List of Figures

                                                              1. Figure 1: Global On-board Connectivity Market Revenue Breakdown (Million, %) by Region 2024 & 2032
                                                              2. Figure 2: North America On-board Connectivity Market Revenue (Million), by Country 2024 & 2032
                                                              3. Figure 3: North America On-board Connectivity Market Revenue Share (%), by Country 2024 & 2032
                                                              4. Figure 4: Europe On-board Connectivity Market Revenue (Million), by Country 2024 & 2032
                                                              5. Figure 5: Europe On-board Connectivity Market Revenue Share (%), by Country 2024 & 2032
                                                              6. Figure 6: Asia Pacific On-board Connectivity Market Revenue (Million), by Country 2024 & 2032
                                                              7. Figure 7: Asia Pacific On-board Connectivity Market Revenue Share (%), by Country 2024 & 2032
                                                              8. Figure 8: Rest of the world On-board Connectivity Market Revenue (Million), by Country 2024 & 2032
                                                              9. Figure 9: Rest of the world On-board Connectivity Market Revenue Share (%), by Country 2024 & 2032
                                                              10. Figure 10: North America On-board Connectivity Market Revenue (Million), by Production Analysis 2024 & 2032
                                                              11. Figure 11: North America On-board Connectivity Market Revenue Share (%), by Production Analysis 2024 & 2032
                                                              12. Figure 12: North America On-board Connectivity Market Revenue (Million), by Consumption Analysis 2024 & 2032
                                                              13. Figure 13: North America On-board Connectivity Market Revenue Share (%), by Consumption Analysis 2024 & 2032
                                                              14. Figure 14: North America On-board Connectivity Market Revenue (Million), by Import Market Analysis (Value & Volume) 2024 & 2032
                                                              15. Figure 15: North America On-board Connectivity Market Revenue Share (%), by Import Market Analysis (Value & Volume) 2024 & 2032
                                                              16. Figure 16: North America On-board Connectivity Market Revenue (Million), by Export Market Analysis (Value & Volume) 2024 & 2032
                                                              17. Figure 17: North America On-board Connectivity Market Revenue Share (%), by Export Market Analysis (Value & Volume) 2024 & 2032
                                                              18. Figure 18: North America On-board Connectivity Market Revenue (Million), by Price Trend Analysis 2024 & 2032
                                                              19. Figure 19: North America On-board Connectivity Market Revenue Share (%), by Price Trend Analysis 2024 & 2032
                                                              20. Figure 20: North America On-board Connectivity Market Revenue (Million), by Country 2024 & 2032
                                                              21. Figure 21: North America On-board Connectivity Market Revenue Share (%), by Country 2024 & 2032
                                                              22. Figure 22: South America On-board Connectivity Market Revenue (Million), by Production Analysis 2024 & 2032
                                                              23. Figure 23: South America On-board Connectivity Market Revenue Share (%), by Production Analysis 2024 & 2032
                                                              24. Figure 24: South America On-board Connectivity Market Revenue (Million), by Consumption Analysis 2024 & 2032
                                                              25. Figure 25: South America On-board Connectivity Market Revenue Share (%), by Consumption Analysis 2024 & 2032
                                                              26. Figure 26: South America On-board Connectivity Market Revenue (Million), by Import Market Analysis (Value & Volume) 2024 & 2032
                                                              27. Figure 27: South America On-board Connectivity Market Revenue Share (%), by Import Market Analysis (Value & Volume) 2024 & 2032
                                                              28. Figure 28: South America On-board Connectivity Market Revenue (Million), by Export Market Analysis (Value & Volume) 2024 & 2032
                                                              29. Figure 29: South America On-board Connectivity Market Revenue Share (%), by Export Market Analysis (Value & Volume) 2024 & 2032
                                                              30. Figure 30: South America On-board Connectivity Market Revenue (Million), by Price Trend Analysis 2024 & 2032
                                                              31. Figure 31: South America On-board Connectivity Market Revenue Share (%), by Price Trend Analysis 2024 & 2032
                                                              32. Figure 32: South America On-board Connectivity Market Revenue (Million), by Country 2024 & 2032
                                                              33. Figure 33: South America On-board Connectivity Market Revenue Share (%), by Country 2024 & 2032
                                                              34. Figure 34: Europe On-board Connectivity Market Revenue (Million), by Production Analysis 2024 & 2032
                                                              35. Figure 35: Europe On-board Connectivity Market Revenue Share (%), by Production Analysis 2024 & 2032
                                                              36. Figure 36: Europe On-board Connectivity Market Revenue (Million), by Consumption Analysis 2024 & 2032
                                                              37. Figure 37: Europe On-board Connectivity Market Revenue Share (%), by Consumption Analysis 2024 & 2032
                                                              38. Figure 38: Europe On-board Connectivity Market Revenue (Million), by Import Market Analysis (Value & Volume) 2024 & 2032
                                                              39. Figure 39: Europe On-board Connectivity Market Revenue Share (%), by Import Market Analysis (Value & Volume) 2024 & 2032
                                                              40. Figure 40: Europe On-board Connectivity Market Revenue (Million), by Export Market Analysis (Value & Volume) 2024 & 2032
                                                              41. Figure 41: Europe On-board Connectivity Market Revenue Share (%), by Export Market Analysis (Value & Volume) 2024 & 2032
                                                              42. Figure 42: Europe On-board Connectivity Market Revenue (Million), by Price Trend Analysis 2024 & 2032
                                                              43. Figure 43: Europe On-board Connectivity Market Revenue Share (%), by Price Trend Analysis 2024 & 2032
                                                              44. Figure 44: Europe On-board Connectivity Market Revenue (Million), by Country 2024 & 2032
                                                              45. Figure 45: Europe On-board Connectivity Market Revenue Share (%), by Country 2024 & 2032
                                                              46. Figure 46: Middle East & Africa On-board Connectivity Market Revenue (Million), by Production Analysis 2024 & 2032
                                                              47. Figure 47: Middle East & Africa On-board Connectivity Market Revenue Share (%), by Production Analysis 2024 & 2032
                                                              48. Figure 48: Middle East & Africa On-board Connectivity Market Revenue (Million), by Consumption Analysis 2024 & 2032
                                                              49. Figure 49: Middle East & Africa On-board Connectivity Market Revenue Share (%), by Consumption Analysis 2024 & 2032
                                                              50. Figure 50: Middle East & Africa On-board Connectivity Market Revenue (Million), by Import Market Analysis (Value & Volume) 2024 & 2032
                                                              51. Figure 51: Middle East & Africa On-board Connectivity Market Revenue Share (%), by Import Market Analysis (Value & Volume) 2024 & 2032
                                                              52. Figure 52: Middle East & Africa On-board Connectivity Market Revenue (Million), by Export Market Analysis (Value & Volume) 2024 & 2032
                                                              53. Figure 53: Middle East & Africa On-board Connectivity Market Revenue Share (%), by Export Market Analysis (Value & Volume) 2024 & 2032
                                                              54. Figure 54: Middle East & Africa On-board Connectivity Market Revenue (Million), by Price Trend Analysis 2024 & 2032
                                                              55. Figure 55: Middle East & Africa On-board Connectivity Market Revenue Share (%), by Price Trend Analysis 2024 & 2032
                                                              56. Figure 56: Middle East & Africa On-board Connectivity Market Revenue (Million), by Country 2024 & 2032
                                                              57. Figure 57: Middle East & Africa On-board Connectivity Market Revenue Share (%), by Country 2024 & 2032
                                                              58. Figure 58: Asia Pacific On-board Connectivity Market Revenue (Million), by Production Analysis 2024 & 2032
                                                              59. Figure 59: Asia Pacific On-board Connectivity Market Revenue Share (%), by Production Analysis 2024 & 2032
                                                              60. Figure 60: Asia Pacific On-board Connectivity Market Revenue (Million), by Consumption Analysis 2024 & 2032
                                                              61. Figure 61: Asia Pacific On-board Connectivity Market Revenue Share (%), by Consumption Analysis 2024 & 2032
                                                              62. Figure 62: Asia Pacific On-board Connectivity Market Revenue (Million), by Import Market Analysis (Value & Volume) 2024 & 2032
                                                              63. Figure 63: Asia Pacific On-board Connectivity Market Revenue Share (%), by Import Market Analysis (Value & Volume) 2024 & 2032
                                                              64. Figure 64: Asia Pacific On-board Connectivity Market Revenue (Million), by Export Market Analysis (Value & Volume) 2024 & 2032
                                                              65. Figure 65: Asia Pacific On-board Connectivity Market Revenue Share (%), by Export Market Analysis (Value & Volume) 2024 & 2032
                                                              66. Figure 66: Asia Pacific On-board Connectivity Market Revenue (Million), by Price Trend Analysis 2024 & 2032
                                                              67. Figure 67: Asia Pacific On-board Connectivity Market Revenue Share (%), by Price Trend Analysis 2024 & 2032
                                                              68. Figure 68: Asia Pacific On-board Connectivity Market Revenue (Million), by Country 2024 & 2032
                                                              69. Figure 69: Asia Pacific On-board Connectivity Market Revenue Share (%), by Country 2024 & 2032

                                                              List of Tables

                                                              1. Table 1: Global On-board Connectivity Market Revenue Million Forecast, by Region 2019 & 2032
                                                              2. Table 2: Global On-board Connectivity Market Revenue Million Forecast, by Production Analysis 2019 & 2032
                                                              3. Table 3: Global On-board Connectivity Market Revenue Million Forecast, by Consumption Analysis 2019 & 2032
                                                              4. Table 4: Global On-board Connectivity Market Revenue Million Forecast, by Import Market Analysis (Value & Volume) 2019 & 2032
                                                              5. Table 5: Global On-board Connectivity Market Revenue Million Forecast, by Export Market Analysis (Value & Volume) 2019 & 2032
                                                              6. Table 6: Global On-board Connectivity Market Revenue Million Forecast, by Price Trend Analysis 2019 & 2032
                                                              7. Table 7: Global On-board Connectivity Market Revenue Million Forecast, by Region 2019 & 2032
                                                              8. Table 8: Global On-board Connectivity Market Revenue Million Forecast, by Country 2019 & 2032
                                                              9. Table 9: US On-board Connectivity Market Revenue (Million) Forecast, by Application 2019 & 2032
                                                              10. Table 10: Canada On-board Connectivity Market Revenue (Million) Forecast, by Application 2019 & 2032
                                                              11. Table 11: Global On-board Connectivity Market Revenue Million Forecast, by Country 2019 & 2032
                                                              12. Table 12: Germany On-board Connectivity Market Revenue (Million) Forecast, by Application 2019 & 2032
                                                              13. Table 13: UK On-board Connectivity Market Revenue (Million) Forecast, by Application 2019 & 2032
                                                              14. Table 14: France On-board Connectivity Market Revenue (Million) Forecast, by Application 2019 & 2032
                                                              15. Table 15: Global On-board Connectivity Market Revenue Million Forecast, by Country 2019 & 2032
                                                              16. Table 16: China On-board Connectivity Market Revenue (Million) Forecast, by Application 2019 & 2032
                                                              17. Table 17: Japan On-board Connectivity Market Revenue (Million) Forecast, by Application 2019 & 2032
                                                              18. Table 18: India On-board Connectivity Market Revenue (Million) Forecast, by Application 2019 & 2032
                                                              19. Table 19: Global On-board Connectivity Market Revenue Million Forecast, by Country 2019 & 2032
                                                              20. Table 20: On-board Connectivity Market Revenue (Million) Forecast, by Application 2019 & 2032
                                                              21. Table 21: Global On-board Connectivity Market Revenue Million Forecast, by Production Analysis 2019 & 2032
                                                              22. Table 22: Global On-board Connectivity Market Revenue Million Forecast, by Consumption Analysis 2019 & 2032
                                                              23. Table 23: Global On-board Connectivity Market Revenue Million Forecast, by Import Market Analysis (Value & Volume) 2019 & 2032
                                                              24. Table 24: Global On-board Connectivity Market Revenue Million Forecast, by Export Market Analysis (Value & Volume) 2019 & 2032
                                                              25. Table 25: Global On-board Connectivity Market Revenue Million Forecast, by Price Trend Analysis 2019 & 2032
                                                              26. Table 26: Global On-board Connectivity Market Revenue Million Forecast, by Country 2019 & 2032
                                                              27. Table 27: United States On-board Connectivity Market Revenue (Million) Forecast, by Application 2019 & 2032
                                                              28. Table 28: Canada On-board Connectivity Market Revenue (Million) Forecast, by Application 2019 & 2032
                                                              29. Table 29: Mexico On-board Connectivity Market Revenue (Million) Forecast, by Application 2019 & 2032
                                                              30. Table 30: Global On-board Connectivity Market Revenue Million Forecast, by Production Analysis 2019 & 2032
                                                              31. Table 31: Global On-board Connectivity Market Revenue Million Forecast, by Consumption Analysis 2019 & 2032
                                                              32. Table 32: Global On-board Connectivity Market Revenue Million Forecast, by Import Market Analysis (Value & Volume) 2019 & 2032
                                                              33. Table 33: Global On-board Connectivity Market Revenue Million Forecast, by Export Market Analysis (Value & Volume) 2019 & 2032
                                                              34. Table 34: Global On-board Connectivity Market Revenue Million Forecast, by Price Trend Analysis 2019 & 2032
                                                              35. Table 35: Global On-board Connectivity Market Revenue Million Forecast, by Country 2019 & 2032
                                                              36. Table 36: Brazil On-board Connectivity Market Revenue (Million) Forecast, by Application 2019 & 2032
                                                              37. Table 37: Argentina On-board Connectivity Market Revenue (Million) Forecast, by Application 2019 & 2032
                                                              38. Table 38: Rest of South America On-board Connectivity Market Revenue (Million) Forecast, by Application 2019 & 2032
                                                              39. Table 39: Global On-board Connectivity Market Revenue Million Forecast, by Production Analysis 2019 & 2032
                                                              40. Table 40: Global On-board Connectivity Market Revenue Million Forecast, by Consumption Analysis 2019 & 2032
                                                              41. Table 41: Global On-board Connectivity Market Revenue Million Forecast, by Import Market Analysis (Value & Volume) 2019 & 2032
                                                              42. Table 42: Global On-board Connectivity Market Revenue Million Forecast, by Export Market Analysis (Value & Volume) 2019 & 2032
                                                              43. Table 43: Global On-board Connectivity Market Revenue Million Forecast, by Price Trend Analysis 2019 & 2032
                                                              44. Table 44: Global On-board Connectivity Market Revenue Million Forecast, by Country 2019 & 2032
                                                              45. Table 45: United Kingdom On-board Connectivity Market Revenue (Million) Forecast, by Application 2019 & 2032
                                                              46. Table 46: Germany On-board Connectivity Market Revenue (Million) Forecast, by Application 2019 & 2032
                                                              47. Table 47: France On-board Connectivity Market Revenue (Million) Forecast, by Application 2019 & 2032
                                                              48. Table 48: Italy On-board Connectivity Market Revenue (Million) Forecast, by Application 2019 & 2032
                                                              49. Table 49: Spain On-board Connectivity Market Revenue (Million) Forecast, by Application 2019 & 2032
                                                              50. Table 50: Russia On-board Connectivity Market Revenue (Million) Forecast, by Application 2019 & 2032
                                                              51. Table 51: Benelux On-board Connectivity Market Revenue (Million) Forecast, by Application 2019 & 2032
                                                              52. Table 52: Nordics On-board Connectivity Market Revenue (Million) Forecast, by Application 2019 & 2032
                                                              53. Table 53: Rest of Europe On-board Connectivity Market Revenue (Million) Forecast, by Application 2019 & 2032
                                                              54. Table 54: Global On-board Connectivity Market Revenue Million Forecast, by Production Analysis 2019 & 2032
                                                              55. Table 55: Global On-board Connectivity Market Revenue Million Forecast, by Consumption Analysis 2019 & 2032
                                                              56. Table 56: Global On-board Connectivity Market Revenue Million Forecast, by Import Market Analysis (Value & Volume) 2019 & 2032
                                                              57. Table 57: Global On-board Connectivity Market Revenue Million Forecast, by Export Market Analysis (Value & Volume) 2019 & 2032
                                                              58. Table 58: Global On-board Connectivity Market Revenue Million Forecast, by Price Trend Analysis 2019 & 2032
                                                              59. Table 59: Global On-board Connectivity Market Revenue Million Forecast, by Country 2019 & 2032
                                                              60. Table 60: Turkey On-board Connectivity Market Revenue (Million) Forecast, by Application 2019 & 2032
                                                              61. Table 61: Israel On-board Connectivity Market Revenue (Million) Forecast, by Application 2019 & 2032
                                                              62. Table 62: GCC On-board Connectivity Market Revenue (Million) Forecast, by Application 2019 & 2032
                                                              63. Table 63: North Africa On-board Connectivity Market Revenue (Million) Forecast, by Application 2019 & 2032
                                                              64. Table 64: South Africa On-board Connectivity Market Revenue (Million) Forecast, by Application 2019 & 2032
                                                              65. Table 65: Rest of Middle East & Africa On-board Connectivity Market Revenue (Million) Forecast, by Application 2019 & 2032
                                                              66. Table 66: Global On-board Connectivity Market Revenue Million Forecast, by Production Analysis 2019 & 2032
                                                              67. Table 67: Global On-board Connectivity Market Revenue Million Forecast, by Consumption Analysis 2019 & 2032
                                                              68. Table 68: Global On-board Connectivity Market Revenue Million Forecast, by Import Market Analysis (Value & Volume) 2019 & 2032
                                                              69. Table 69: Global On-board Connectivity Market Revenue Million Forecast, by Export Market Analysis (Value & Volume) 2019 & 2032
                                                              70. Table 70: Global On-board Connectivity Market Revenue Million Forecast, by Price Trend Analysis 2019 & 2032
                                                              71. Table 71: Global On-board Connectivity Market Revenue Million Forecast, by Country 2019 & 2032
                                                              72. Table 72: China On-board Connectivity Market Revenue (Million) Forecast, by Application 2019 & 2032
                                                              73. Table 73: India On-board Connectivity Market Revenue (Million) Forecast, by Application 2019 & 2032
                                                              74. Table 74: Japan On-board Connectivity Market Revenue (Million) Forecast, by Application 2019 & 2032
                                                              75. Table 75: South Korea On-board Connectivity Market Revenue (Million) Forecast, by Application 2019 & 2032
                                                              76. Table 76: ASEAN On-board Connectivity Market Revenue (Million) Forecast, by Application 2019 & 2032
                                                              77. Table 77: Oceania On-board Connectivity Market Revenue (Million) Forecast, by Application 2019 & 2032
                                                              78. Table 78: Rest of Asia Pacific On-board Connectivity Market Revenue (Million) Forecast, by Application 2019 & 2032


                                                              Frequently Asked Questions

                                                              1. What is the projected Compound Annual Growth Rate (CAGR) of the On-board Connectivity Market?

                                                              The projected CAGR is approximately 13.80%.

                                                              2. Which companies are prominent players in the On-board Connectivity Market?

                                                              Key companies in the market include Nokia Corp (Alcatel Lucent Enterprise Inc ), AT & T Inc, Honeywell International Inc, Rockwell Collins Inc, Inmarsat PLC, Huawei Technologies Co Ltd, ZTE Corporation, Viasat Inc *List Not Exhaustive, Bombardier Aerospace Inc, Panasonic Corporation.

                                                              3. What are the main segments of the On-board Connectivity Market?

                                                              The market segments include Production Analysis, Consumption Analysis, Import Market Analysis (Value & Volume), Export Market Analysis (Value & Volume), Price Trend Analysis.

                                                              4. Can you provide details about the market size?

                                                              The market size is estimated to be USD XX Million as of 2022.

                                                              5. What are some drivers contributing to market growth?

                                                              ; Increasing Number Of Air Passengers; Use Of Portable Electronic Devices.

                                                              6. What are the notable trends driving market growth?

                                                              Aviation Industry Expected to Witness Significant Growth.

                                                              7. Are there any restraints impacting market growth?

                                                              ; High Cost Of Connectivity Equipments.

                                                              8. Can you provide examples of recent developments in the market?

                                                              N/A

                                                              9. What pricing options are available for accessing the report?

                                                              Pricing options include single-user, multi-user, and enterprise licenses priced at USD 4750, USD 5250, and USD 8750 respectively.

                                                              10. Is the market size provided in terms of value or volume?

                                                              The market size is provided in terms of value, measured in Million.

                                                              11. Are there any specific market keywords associated with the report?

                                                              Yes, the market keyword associated with the report is "On-board Connectivity Market," which aids in identifying and referencing the specific market segment covered.

                                                              12. How do I determine which pricing option suits my needs best?

                                                              The pricing options vary based on user requirements and access needs. Individual users may opt for single-user licenses, while businesses requiring broader access may choose multi-user or enterprise licenses for cost-effective access to the report.

                                                              13. Are there any additional resources or data provided in the On-board Connectivity Market report?

                                                              While the report offers comprehensive insights, it's advisable to review the specific contents or supplementary materials provided to ascertain if additional resources or data are available.

                                                              14. How can I stay updated on further developments or reports in the On-board Connectivity Market?

                                                              To stay informed about further developments, trends, and reports in the On-board Connectivity Market, consider subscribing to industry newsletters, following relevant companies and organizations, or regularly checking reputable industry news sources and publications.


                                                              Methodology

                                                              Step 1 - Identification of Relevant Samples Size from Population Database

                                                              Step Chart
                                                              Bar Chart
                                                              Method Chart

                                                              Step 2 - Approaches for Defining Global Market Size (Value, Volume* & Price*)

                                                              Approach Chart
                                                              Top-down and bottom-up approaches are used to validate the global market size and estimate the market size for manufactures, regional segments, product, and application.

                                                              Note*: In applicable scenarios

                                                              Step 3 - Data Sources

                                                              Primary Research

                                                              • Web Analytics
                                                              • Survey Reports
                                                              • Research Institute
                                                              • Latest Research Reports
                                                              • Opinion Leaders

                                                              Secondary Research

                                                              • Annual Reports
                                                              • White Paper
                                                              • Latest Press Release
                                                              • Industry Association
                                                              • Paid Database
                                                              • Investor Presentations
                                                              Analyst Chart

                                                              Step 4 - Data Triangulation

                                                              Involves using different sources of information in order to increase the validity of a study

                                                              These sources are likely to be stakeholders in a program - participants, other researchers, program staff, other community members, and so on.

                                                              Then we put all data in single framework & apply various statistical tools to find out the dynamic on the market.

                                                              During the analysis stage, feedback from the stakeholder groups would be compared to determine areas of agreement as well as areas of divergence

                                                              Additionally, after gathering mixed and scattered data from a wide range of sources, data is triangulated and correlated to come up with estimated figures which are further validated through primary mediums or industry experts, opinion leaders.

                                                              About Report Pinnacle

                                                              Report Pinnacle provides top-tier market research, industry intelligence, and actionable insights for finance, technology, healthcare, and consumer sectors. Our reports empower you to make informed decisions and achieve business success.

                                                              Our expert team combines primary research, data analytics, and industry knowledge to deliver insights you can trust. We offer syndicated reports, custom research, and consulting services tailored to your unique business needs.

                                                              At Report Pinnacle, we are committed to quality, transparency, and client satisfaction. Every report is rigorously validated to ensure accuracy and relevance. Our global perspective and local expertise help you understand both broad trends and detailed market shifts.

                                                              Stay ahead with Report Pinnacle. Subscribe to our newsletter for the latest insights and research highlights, and follow us on social media for real-time updates.

                                                              Report Pinnacle – Your Partner for Reaching the Top in Market Intelligence.

                                                              artwork spiralartwork spiralRelated Reports
                                                              artwork underline

                                                              Future Prospects for Asia-Pacific Commercial Aircraft Cabin Seating Market Growth

                                                              The Asia-Pacific commercial aircraft cabin seating market is booming, projected to reach $XX million by 2033 with a 7.32% CAGR. Driven by rising air travel and economic growth in key nations like China and India, this report analyzes market trends, key players (Safran, Recaro, Expliseat), and regional segmentation. Discover growth opportunities and challenges in this dynamic industry.

                                                              July 2025
                                                              Base Year: 2024
                                                              No Of Pages: 197
                                                              Price: $3800

                                                              Aircraft Health Monitoring Systems Industry 2025-2033 Market Analysis: Trends, Dynamics, and Growth Opportunities

                                                              Discover the booming Aircraft Health Monitoring Systems market! This in-depth analysis reveals a CAGR of 6% through 2033, driven by predictive maintenance, safety regulations, and technological advancements. Explore key players, regional trends, and future growth projections for this dynamic sector.

                                                              July 2025
                                                              Base Year: 2024
                                                              No Of Pages: 234
                                                              Price: $4750

                                                              Aircraft Exhaust Systems Market Industry’s Future Growth Prospects

                                                              The Aircraft Exhaust Systems Market is booming, projected to reach \$1.78 Billion by 2033 with a 6.49% CAGR. Driven by rising air travel and stringent emission regulations, this report analyzes market trends, key players (Safran, Triumph Group, GKN Aerospace), and regional growth (North America, Europe, Asia-Pacific). Discover key insights and future projections for this expanding sector.

                                                              July 2025
                                                              Base Year: 2024
                                                              No Of Pages: 234
                                                              Price: $4750

                                                              Active Protection Systems Market Market’s Growth Catalysts

                                                              The Active Protection Systems (APS) market is booming, projected to reach $7 billion by 2033 with a 6.06% CAGR. This in-depth analysis explores market drivers, trends, restraints, key players (Thales, General Dynamics, Rheinmetall), and regional breakdowns (North America, Europe, Asia-Pacific). Discover the future of military vehicle protection.

                                                              July 2025
                                                              Base Year: 2024
                                                              No Of Pages: 234
                                                              Price: $4750

                                                              Consumer-Centric Trends in Middle-East and Africa Aircraft MRO Industry Industry

                                                              The Middle East & Africa Aircraft MRO market is booming, with a CAGR exceeding 4% through 2033. Driven by rising air travel and fleet expansion, this report analyzes market size, key players (Ethiopian Airlines, Lufthansa Technik AG, etc.), regional trends, and growth opportunities in commercial, military, and general aviation sectors. Discover the challenges and potential within this dynamic industry.

                                                              July 2025
                                                              Base Year: 2024
                                                              No Of Pages: 234
                                                              Price: $4750

                                                              Southeast Asia Commercial Aircraft MRO Market Future-Proof Strategies: Market Trends 2025-2033

                                                              The Southeast Asia Commercial Aircraft MRO market is booming, projected to reach $3.77 billion by 2025, with a CAGR of 11.47%. Discover key drivers, trends, and challenges shaping this dynamic industry, including insights into leading companies and regional market share. Explore growth opportunities in airframe, engine, and component MRO across narrowbody and widebody aircraft.

                                                              July 2025
                                                              Base Year: 2024
                                                              No Of Pages: 234
                                                              Price: $4750

                                                              Turboprop Engine Market Trends and Forecast 2025-2033

                                                              The turboprop engine market is booming, projected to reach \$31.89 billion by 2033 with a CAGR of 3.71%. Explore key drivers, trends, and regional market shares for this high-growth sector, dominated by Honeywell, Safran, and others. Discover the impact of technological advancements and increasing demand for fuel-efficient aircraft.

                                                              July 2025
                                                              Base Year: 2024
                                                              No Of Pages: 234
                                                              Price: $4750

                                                              Unveiling Low Cost Carrier Market Growth Patterns: CAGR Analysis and Forecasts 2025-2033

                                                              Discover the booming low-cost carrier market! Explore its 10% CAGR, key drivers, regional trends, leading companies like Ryanair & Southwest, and future projections to 2033. Get insights into market segmentation, challenges, and opportunities in this dynamic industry.

                                                              July 2025
                                                              Base Year: 2024
                                                              No Of Pages: 234
                                                              Price: $4750

                                                              Commercial Aircraft Floor Panels Market 2025-2033 Analysis: Trends, Competitor Dynamics, and Growth Opportunities

                                                              The global commercial aircraft floor panels market is booming, projected to reach \$392.64 million by 2025 and grow at a CAGR of 4.67% until 2033. Driven by increasing air travel and demand for lightweight, durable materials, key players like Airbus and Boeing are shaping this lucrative sector. Explore market trends, segment analysis, and regional insights.

                                                              July 2025
                                                              Base Year: 2024
                                                              No Of Pages: 234
                                                              Price: $4750

                                                              Electronically Scanned Array Radar Market 2025-2033 Analysis: Trends, Competitor Dynamics, and Growth Opportunities

                                                              The Electronically Scanned Array (ESA) Radar Market is booming, with a CAGR of 6.45%! Discover key trends, leading companies like Raytheon and Thales, and regional market insights in this comprehensive analysis projecting growth to 2033. Learn about active vs. passive ESA, land, air, and sea applications, and the impact of AI and autonomous systems.

                                                              July 2025
                                                              Base Year: 2024
                                                              No Of Pages: 234
                                                              Price: $4750

                                                              Decoding Aircraft Engine Blades Market’s Market Size Potential by 2033

                                                              Discover the booming Aircraft Engine Blades market, projected to surpass $XX million by 2033 with a CAGR exceeding 5.5%! This in-depth analysis explores market drivers, trends, restraints, and key players like Raytheon, GE, and Safran, covering segments like blade type, application, and materials. Get insights into regional market shares and future growth predictions.

                                                              July 2025
                                                              Base Year: 2024
                                                              No Of Pages: 234
                                                              Price: $4750

                                                              Flight Data Monitoring Industry 2025-2033 Market Analysis: Trends, Dynamics, and Growth Opportunities

                                                              The Flight Data Monitoring (FDM) market is booming, exceeding a $1.5 Billion valuation in 2025 and projected for significant growth through 2033. Discover key drivers, trends, and regional market shares in this in-depth analysis covering major players and technological advancements in flight safety and operational efficiency.

                                                              July 2025
                                                              Base Year: 2024
                                                              No Of Pages: 234
                                                              Price: $4750

                                                              Military Transport Aircraft Market Market Expansion: Growth Outlook 2025-2033

                                                              The Military Transport Aircraft Market is booming, projected to reach $43.56 billion by 2033 with a 7.09% CAGR. Discover key drivers, trends, and regional insights, including major players like Boeing and Lockheed Martin. Analyze market segmentation and future growth projections in this comprehensive report.

                                                              July 2025
                                                              Base Year: 2024
                                                              No Of Pages: 234
                                                              Price: $4750

                                                              Analyzing Competitor Moves: Eastern Europe Defense Market Growth Outlook 2025-2033

                                                              The Eastern European defense market is booming, projected to reach [estimated 2033 value] by 2033, driven by geopolitical tensions and modernization efforts. Discover key trends, growth drivers, and leading companies shaping this dynamic sector.

                                                              July 2025
                                                              Base Year: 2024
                                                              No Of Pages: 210
                                                              Price: $4750

                                                              LEO Satellite Market Analysis 2025 and Forecasts 2033: Unveiling Growth Opportunities

                                                              Discover the booming LEO Satellite market! This in-depth analysis reveals a 3.52% CAGR, key drivers, trends, and restraints, examining segments by application (communication, Earth observation), satellite mass, end-user, and propulsion technology. Explore leading companies like SpaceX and Airbus and regional market shares. Project your strategic moves with our comprehensive forecast to 2033.

                                                              July 2025
                                                              Base Year: 2024
                                                              No Of Pages: 197
                                                              Price: $3800

                                                              Space Sensors And Actuators Market Soars to XXX Million, witnessing a CAGR of XX during the forecast period 2025-2033

                                                              The Space Sensors and Actuators market is booming, projected to reach $8.84 billion by 2033 with a 13.40% CAGR. Explore key drivers, trends, and regional insights in this comprehensive market analysis, featuring leading companies like Honeywell and Moog. Discover the growth potential across segments like satellites, rovers, and launch vehicles.

                                                              July 2025
                                                              Base Year: 2024
                                                              No Of Pages: 234
                                                              Price: $4750

                                                              Challenges to Overcome in Air Taxi Industry Market Growth: Analysis 2025-2033

                                                              The air taxi market is booming! Discover the latest insights on this $1.41 billion (2025) industry, projected to grow at a 23.32% CAGR. Explore market trends, key players (like Joby Aero and Lilium), and regional growth forecasts for eVTOL vehicles.

                                                              July 2025
                                                              Base Year: 2024
                                                              No Of Pages: 234
                                                              Price: $4750

                                                              Military Marine Vessel Engines Market Market Disruption and Future Trends

                                                              Explore the booming Military Marine Vessel Engines Market, projected to reach \$XX billion by 2033 with a CAGR exceeding 4%. Discover key drivers, trends (hybrid propulsion, automation), restraints, and regional analysis (North America, Europe, Asia-Pacific). Leading companies and market segmentation are also covered.

                                                              July 2025
                                                              Base Year: 2024
                                                              No Of Pages: 234
                                                              Price: $4750

                                                              Europe Small Satellite Market Market Overview: Growth and Insights

                                                              The European small satellite market is booming, projected to reach €XXX million by 2033, driven by advancements in technology and rising demand for Earth observation and communication services. Discover key trends, market segments, and leading players shaping this dynamic sector.

                                                              July 2025
                                                              Base Year: 2024
                                                              No Of Pages: 197
                                                              Price: $3800

                                                              Europe Charter Jet Services Market Trends and Forecasts: Comprehensive Insights

                                                              Soar into the future of luxury travel! Discover the booming European charter jet services market, projected to reach $2.59 billion by 2033 with a 10.10% CAGR. This in-depth analysis explores market drivers, trends, restraints, key players (NetJets, VistaJet, Luxaviation), and regional breakdowns. Learn more!

                                                              July 2025
                                                              Base Year: 2024
                                                              No Of Pages: 234
                                                              Price: $4750

                                                              Business Address

                                                              Head Office

                                                              Office no. A 5010, fifth floor, Solitaire Business Hub, Near Phoenix mall, Pune, Maharashtra 411014

                                                              Contact Information

                                                              Craig Francis

                                                              Business Development Head

                                                              +17162654855

                                                              [email protected]

                                                              Connect With Us

                                                              Secure Payment Partners

                                                              payment image
                                                              RetailLogisticsPackagingAutomotiveHealthcareAgricultureEnergy & PowerFood & BeverageAerospace & DefenseChemicals & MaterialsHospitality and TourismAnimal Nutrition & WellnessConsumer Goods and ServicesReal Estate and ConstructionHome and Property ImprovementTechnology, Media and TelecomManufacturing Products and ServicesFinancial Services and Investment Intelligence

                                                              © 2025 All rights reserved


                                                              Privacy Policy
                                                              Terms and Conditions
                                                              FAQ
                                                              • Home
                                                              • About Us
                                                              • Industries
                                                                • Aerospace & Defense
                                                                • Agriculture
                                                                • Animal Nutrition & Wellness
                                                                • Automotive
                                                                • Chemicals & Materials
                                                                • Consumer Goods and Services
                                                                • Energy & Power
                                                                • Financial Services and Investment Intelligence
                                                                • Food & Beverage
                                                                • Home and Property Improvement
                                                                • Hospitality and Tourism
                                                                • Logistics
                                                                • Manufacturing Products and Services
                                                                • Packaging
                                                                • Professional and Commercial Services
                                                                • Real Estate and Construction
                                                                • Retail
                                                                • Technology, Media and Telecom
                                                                • Healthcare
                                                              • Services
                                                              • Contact
                                                              Main Logo
                                                              • Home
                                                              • About Us
                                                              • Industries
                                                                • Aerospace & Defense
                                                                • Agriculture
                                                                • Animal Nutrition & Wellness
                                                                • Automotive
                                                                • Chemicals & Materials
                                                                • Consumer Goods and Services
                                                                • Energy & Power
                                                                • Financial Services and Investment Intelligence
                                                                • Food & Beverage
                                                                • Home and Property Improvement
                                                                • Hospitality and Tourism
                                                                • Logistics
                                                                • Manufacturing Products and Services
                                                                • Packaging
                                                                • Professional and Commercial Services
                                                                • Real Estate and Construction
                                                                • Retail
                                                                • Technology, Media and Telecom
                                                                • Healthcare
                                                              • Services
                                                              • Contact
                                                              +17162654855
                                                              [email protected]

                                                              +17162654855

                                                              [email protected]