

Key Insights
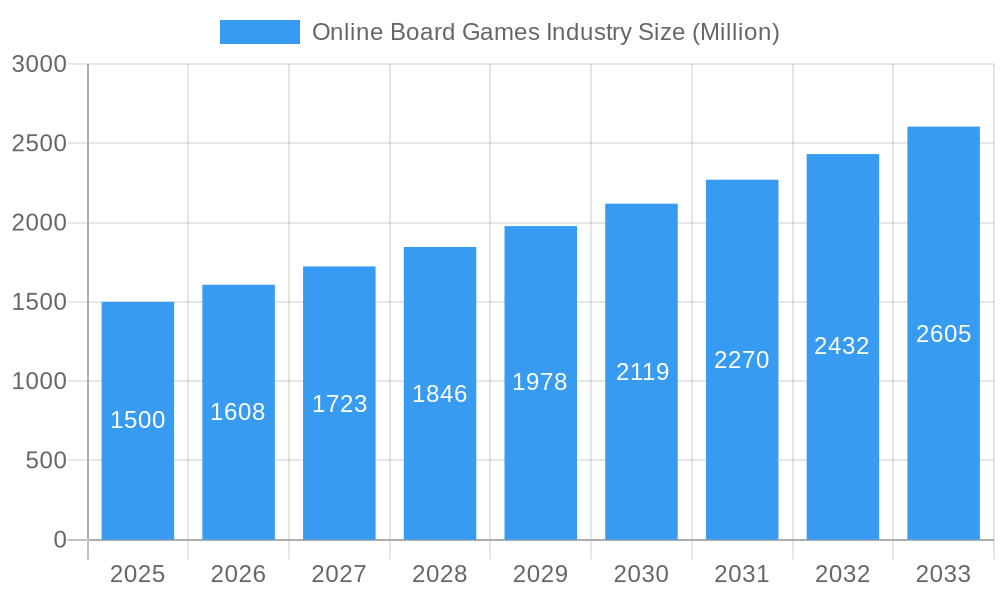
The online board game market is experiencing substantial expansion, propelled by increasing internet access, the widespread adoption of mobile gaming, and a growing consumer appetite for accessible and immersive entertainment. The market, valued at $15.82 billion in 2025, is projected to achieve a Compound Annual Growth Rate (CAGR) of 10.58% from 2025 to 2033. Key growth catalysts include the proliferation of mobile gaming platforms offering convenient and affordable gameplay, the development of sophisticated digital interfaces that replicate the tactile experience of physical board games, and the rise of esports and competitive online communities driving player engagement and loyalty. Diverse revenue streams, encompassing advertising, in-app purchases, and direct app sales, contribute significantly to this market's upward trajectory. While North America and Europe currently lead, the Asia-Pacific and Latin America regions present significant untapped growth potential due to expanding internet infrastructure and digital literacy.
Online Board Games Industry Market Size (In Billion)
Addressing market challenges such as ensuring seamless cross-device gameplay, managing complex online multiplayer interactions, and cultivating robust community engagement comparable to physical board game settings will be critical for sustained success. The competitive arena is dynamic, featuring major players like Tencent and Nintendo, alongside numerous specialized developers. This landscape offers opportunities for broad market penetration via established brands and niche expansion through innovative offerings and targeted marketing. Future market leaders will prioritize user experience optimization, enhanced social features, and cross-platform compatibility to capitalize on growth drivers and overcome obstacles. In-depth analysis of regional trends and emerging technologies is essential for achieving enduring market leadership and fostering long-term player retention.
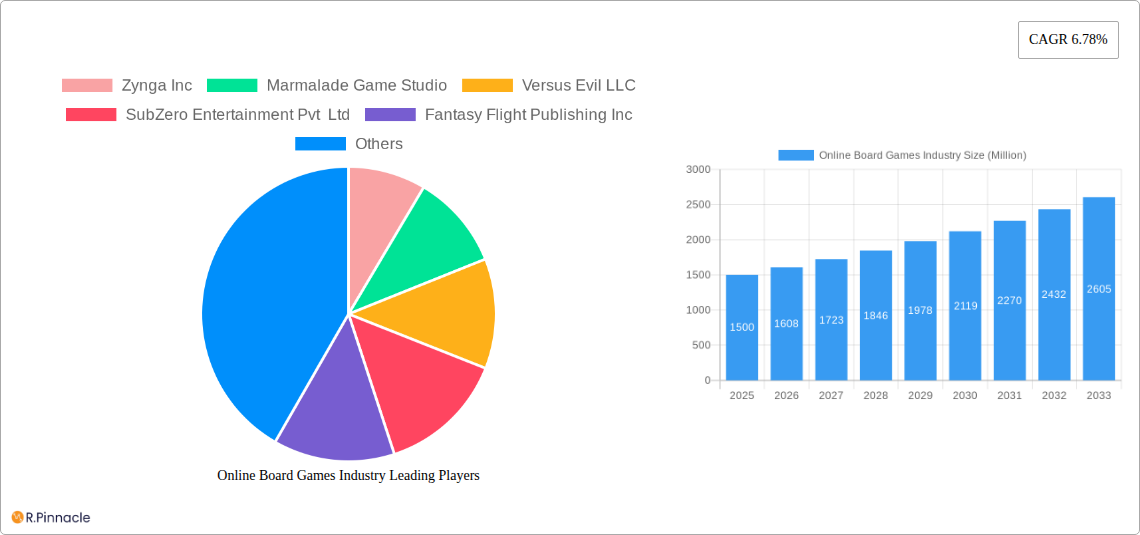
Online Board Games Industry Company Market Share
Online Board Games Industry Report: 2019-2033
This comprehensive report provides an in-depth analysis of the online board games industry, projecting a market valuation exceeding $xx Million by 2033. Leveraging data from 2019-2024 (historical period), with 2025 as the base and estimated year, and forecasting until 2033, this report is essential for industry professionals, investors, and strategic planners. We analyze market dynamics, key players, emerging trends, and future growth opportunities, offering actionable insights for informed decision-making.
Online Board Games Industry Market Structure & Innovation Trends
The online board games market is characterized by a dynamic interplay of established giants and emerging players. Market concentration is moderate, with a few dominant players like Tencent Holdings Limited and Zynga Inc. holding significant market share, estimated at xx% and xx% respectively in 2025. However, the market also shows considerable fragmentation, particularly in niche segments. Innovation is driven by advancements in game mechanics, graphics, and social features, fueled by ongoing M&A activities. Deal values in the historical period averaged $xx Million, with significant activity concentrated in the mobile gaming sector. Regulatory frameworks, while evolving, currently pose minimal direct constraints on the industry. Product substitutes include other forms of online entertainment, such as mobile games and streaming services. The end-user demographic is broad, encompassing casual gamers to hardcore enthusiasts across various age groups and geographies.
- Market Share (2025 Estimate): Tencent Holdings Limited (xx%), Zynga Inc. (xx%), Asmodee Digital (xx%), Others (xx%)
- Average M&A Deal Value (2019-2024): $xx Million
- Key Innovation Drivers: Advanced game AI, VR/AR integration, cross-platform compatibility, enhanced social features.
Online Board Games Industry Market Dynamics & Trends
The online board games market is experiencing robust growth, driven by increasing smartphone penetration, rising disposable incomes, and a growing preference for digital entertainment. The Compound Annual Growth Rate (CAGR) is projected at xx% during the forecast period (2025-2033). Market penetration remains relatively high in developed economies, but significant growth potential exists in emerging markets with expanding internet access. Technological disruptions, such as the rise of cloud gaming and the metaverse, are reshaping the landscape, creating new opportunities and challenges. Consumer preferences are shifting towards immersive experiences, personalized gameplay, and strong social interaction. The competitive landscape is highly dynamic, with continuous product launches, strategic partnerships, and M&A activity shaping market dynamics.
Dominant Regions & Segments in Online Board Games Industry
North America and Asia currently dominate the online board games market. The North American market benefits from high levels of digital literacy and disposable income, while Asia's massive population and rapid technological advancements drive significant growth. Within the “By Type” segmentation, In-App Purchases represent the largest revenue segment, projected to account for xx% of total revenue in 2025, followed by App Purchases (xx%) and Advertising (xx%).
- Key Drivers of North American Dominance: High digital literacy, strong consumer spending, robust mobile gaming ecosystem.
- Key Drivers of Asian Dominance: Large population base, rising smartphone penetration, increasing internet access, supportive government policies.
- In-App Purchase Segment Dominance: Driven by freemium game models and in-game purchases increasing player engagement and lifetime value.
Online Board Games Industry Product Innovations
Recent product innovations include enhanced AI opponents, cross-platform play capabilities, and integration of virtual and augmented reality technologies. These advancements aim to improve the gameplay experience, expand accessibility, and foster greater social interaction. The focus is on creating immersive, personalized experiences that cater to diverse player preferences. Successful innovations prioritize engaging gameplay mechanics, intuitive interfaces, and seamless integration across various devices.
Report Scope & Segmentation Analysis
This report segments the online board games market by type: Advertising, In-App Purchase, and App Purchase. The In-App Purchase segment is expected to experience the highest growth due to the increasing adoption of freemium models. The App Purchase segment is driven by premium titles and expansions, while the Advertising segment is influenced by the level of user engagement and advertising inventory. Each segment exhibits different competitive dynamics, with some characterized by intense rivalry and others by more niche players.
- Advertising: Market size projected to reach $xx Million by 2033. Growth driven by targeted advertising and increasing user engagement.
- In-App Purchase: Market size projected to reach $xx Million by 2033. Highest growth potential due to freemium model popularity.
- App Purchase: Market size projected to reach $xx Million by 2033. Driven by premium titles offering substantial value to users.
Key Drivers of Online Board Games Industry Growth
Technological advancements, such as improved graphics and AI, are key growth drivers. The expanding smartphone and internet penetration fuels market expansion, particularly in emerging markets. Favorable economic conditions and rising disposable incomes contribute to increased consumer spending on digital entertainment. Relaxed regulatory frameworks in many regions facilitate market growth and competition.
Challenges in the Online Board Games Industry Sector
Intense competition from established and emerging players is a significant challenge. Maintaining user engagement and attracting new players in a saturated market requires constant innovation and investment. The dependence on app stores and online platforms creates vulnerability to their policies and changes. Fluctuations in consumer spending due to economic downturns also impact the industry's performance.
Emerging Opportunities in Online Board Games Industry
The integration of virtual reality (VR) and augmented reality (AR) presents new opportunities. The expansion into emerging markets with growing internet penetration offers significant growth potential. The development of innovative game mechanics and social features can attract new players and enhance user engagement. Leveraging the metaverse and other Web3 technologies creates new avenues for innovation.
Leading Players in the Online Board Games Industry Market
- Zynga Inc
- Marmalade Game Studio
- Versus Evil LLC
- SubZero Entertainment Pvt Ltd
- Fantasy Flight Publishing Inc
- GungHo Online Entertainment Inc (SoftBank Group)
- Tencent Holdings Limited
- Chess.com
- Nintendo Co Ltd
- Handelabra Games
- Czech Games Edition
- Asmodee Digital
- Hurrican Edition SA
Key Developments in Online Board Games Industry
- June 2022: Zynga Inc. launched "Clubs" in Words With Friends 2, enhancing social interaction.
- June 2022: Hasbro partnered with the New York Times to release "Wordle: The Party Game," leveraging Wordle's popularity.
Future Outlook for Online Board Games Industry Market
The online board games market is poised for continued growth, driven by technological advancements and the expanding global user base. Strategic partnerships, innovative game development, and effective marketing strategies will be crucial for success. The incorporation of new technologies such as VR/AR and the metaverse will create exciting new opportunities for growth and market expansion. The market is expected to reach $xx Million by 2033, showcasing significant growth potential.
Online Board Games Industry Segmentation
-
1. Type
- 1.1. Advertising
- 1.2. In-App Purchase
Online Board Games Industry Segmentation By Geography
-
1. North America
- 1.1. United States
- 1.2. Canada
-
2. Europe
- 2.1. United Kingdom
- 2.2. Germany
- 2.3. Spain
- 2.4. France
- 2.5. Rest of Europe
-
3. Asia Pacific
- 3.1. China
- 3.2. India
- 3.3. Japan
- 3.4. South Korea
- 3.5. Rest of Asia Pacific
-
4. Latin America
- 4.1. Brazil
- 4.2. Mexico
-
5. Middle East and Africa
- 5.1. Saudi Arabia
- 5.2. South Africa
- 5.3. Nigeria
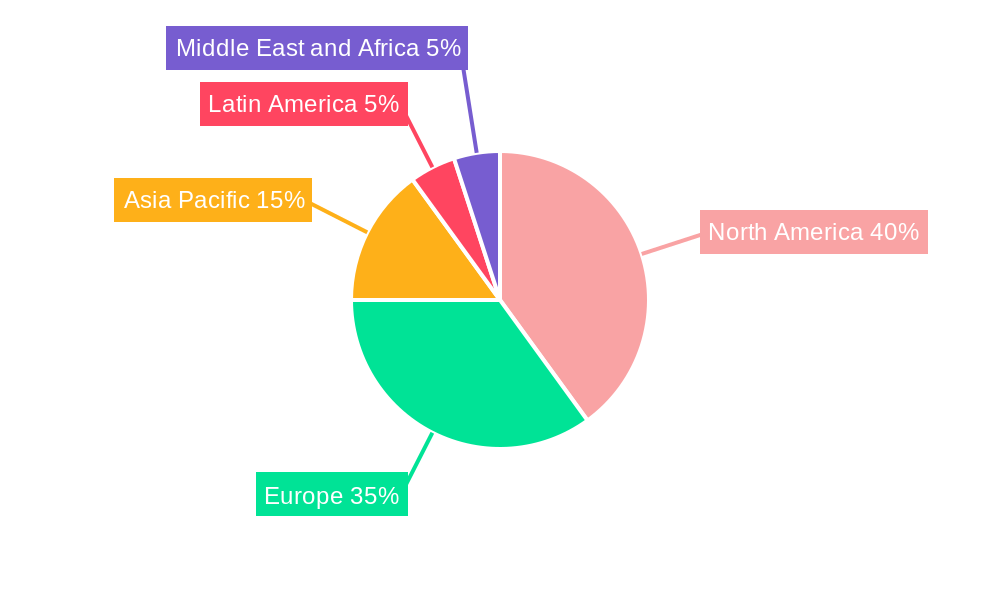
Online Board Games Industry Regional Market Share
Geographic Coverage of Online Board Games Industry
Online Board Games Industry REPORT HIGHLIGHTS
| Aspects | Details |
|---|---|
| Study Period | 2020-2034 |
| Base Year | 2025 |
| Estimated Year | 2026 |
| Forecast Period | 2026-2034 |
| Historical Period | 2020-2025 |
| Growth Rate | CAGR of 10.58% from 2020-2034 |
| Segmentation |
|
Table of Contents
- 1. Introduction
- 1.1. Research Scope
- 1.2. Market Segmentation
- 1.3. Research Objective
- 1.4. Definitions and Assumptions
- 2. Executive Summary
- 2.1. Market Snapshot
- 3. Market Dynamics
- 3.1. Market Drivers
- 3.2. Market Restrains
- 3.3. Market Trends
- 3.4. Market Opportunities
- 4. Market Factor Analysis
- 4.1. Porters Five Forces
- 4.1.1. Bargaining Power of Suppliers
- 4.1.2. Bargaining Power of Buyers
- 4.1.3. Threat of New Entrants
- 4.1.4. Threat of Substitutes
- 4.1.5. Competitive Rivalry
- 4.2. PESTEL analysis
- 4.3. BCG Analysis
- 4.3.1. Stars (High Growth, High Market Share)
- 4.3.2. Cash Cows (Low Growth, High Market Share)
- 4.3.3. Question Mark (High Growth, Low Market Share)
- 4.3.4. Dogs (Low Growth, Low Market Share)
- 4.4. Ansoff Matrix Analysis
- 4.5. Supply Chain Analysis
- 4.6. Regulatory Landscape
- 4.7. Current Market Potential and Opportunity Assessment (TAM–SAM–SOM Framework)
- 4.8. PRI Analyst Note
- 4.1. Porters Five Forces
- 5. Market Analysis, Insights and Forecast 2021-2033
- 5.1. Market Analysis, Insights and Forecast - by Type
- 5.1.1. Advertising
- 5.1.2. In-App Purchase
- 5.2. Market Analysis, Insights and Forecast - by Region
- 5.2.1. North America
- 5.2.2. Europe
- 5.2.3. Asia Pacific
- 5.2.4. Latin America
- 5.2.5. Middle East and Africa
- 5.1. Market Analysis, Insights and Forecast - by Type
- 6. Global Online Board Games Industry Analysis, Insights and Forecast, 2021-2033
- 6.1. Market Analysis, Insights and Forecast - by Type
- 6.1.1. Advertising
- 6.1.2. In-App Purchase
- 6.1. Market Analysis, Insights and Forecast - by Type
- 7. North America Online Board Games Industry Analysis, Insights and Forecast, 2020-2032
- 7.1. Market Analysis, Insights and Forecast - by Type
- 7.1.1. Advertising
- 7.1.2. In-App Purchase
- 7.1. Market Analysis, Insights and Forecast - by Type
- 8. Europe Online Board Games Industry Analysis, Insights and Forecast, 2020-2032
- 8.1. Market Analysis, Insights and Forecast - by Type
- 8.1.1. Advertising
- 8.1.2. In-App Purchase
- 8.1. Market Analysis, Insights and Forecast - by Type
- 9. Asia Pacific Online Board Games Industry Analysis, Insights and Forecast, 2020-2032
- 9.1. Market Analysis, Insights and Forecast - by Type
- 9.1.1. Advertising
- 9.1.2. In-App Purchase
- 9.1. Market Analysis, Insights and Forecast - by Type
- 10. Latin America Online Board Games Industry Analysis, Insights and Forecast, 2020-2032
- 10.1. Market Analysis, Insights and Forecast - by Type
- 10.1.1. Advertising
- 10.1.2. In-App Purchase
- 10.1. Market Analysis, Insights and Forecast - by Type
- 11. Middle East and Africa Online Board Games Industry Analysis, Insights and Forecast, 2020-2032
- 11.1. Market Analysis, Insights and Forecast - by Type
- 11.1.1. Advertising
- 11.1.2. In-App Purchase
- 11.1. Market Analysis, Insights and Forecast - by Type
- 12. Competitive Analysis
- 12.1. Company Profiles
- 12.1.1 Zynga Inc
- 12.1.1.1. Company Overview
- 12.1.1.2. Products
- 12.1.1.3. Company Financials
- 12.1.1.4. SWOT Analysis
- 12.1.2 Marmalade Game Studio
- 12.1.2.1. Company Overview
- 12.1.2.2. Products
- 12.1.2.3. Company Financials
- 12.1.2.4. SWOT Analysis
- 12.1.3 Versus Evil LLC
- 12.1.3.1. Company Overview
- 12.1.3.2. Products
- 12.1.3.3. Company Financials
- 12.1.3.4. SWOT Analysis
- 12.1.4 SubZero Entertainment Pvt Ltd
- 12.1.4.1. Company Overview
- 12.1.4.2. Products
- 12.1.4.3. Company Financials
- 12.1.4.4. SWOT Analysis
- 12.1.5 Fantasy Flight Publishing Inc
- 12.1.5.1. Company Overview
- 12.1.5.2. Products
- 12.1.5.3. Company Financials
- 12.1.5.4. SWOT Analysis
- 12.1.6 GungHo Online Entertainment Inc ( SoftBank Group)
- 12.1.6.1. Company Overview
- 12.1.6.2. Products
- 12.1.6.3. Company Financials
- 12.1.6.4. SWOT Analysis
- 12.1.7 Tencent Holdings Limited
- 12.1.7.1. Company Overview
- 12.1.7.2. Products
- 12.1.7.3. Company Financials
- 12.1.7.4. SWOT Analysis
- 12.1.8 Chess com*List Not Exhaustive
- 12.1.8.1. Company Overview
- 12.1.8.2. Products
- 12.1.8.3. Company Financials
- 12.1.8.4. SWOT Analysis
- 12.1.9 Nintendo Co Ltd
- 12.1.9.1. Company Overview
- 12.1.9.2. Products
- 12.1.9.3. Company Financials
- 12.1.9.4. SWOT Analysis
- 12.1.10 Handelabra Games
- 12.1.10.1. Company Overview
- 12.1.10.2. Products
- 12.1.10.3. Company Financials
- 12.1.10.4. SWOT Analysis
- 12.1.11 Czech Games Edition
- 12.1.11.1. Company Overview
- 12.1.11.2. Products
- 12.1.11.3. Company Financials
- 12.1.11.4. SWOT Analysis
- 12.1.12 Asmodee Digital
- 12.1.12.1. Company Overview
- 12.1.12.2. Products
- 12.1.12.3. Company Financials
- 12.1.12.4. SWOT Analysis
- 12.1.13 Hurrican Edition SA
- 12.1.13.1. Company Overview
- 12.1.13.2. Products
- 12.1.13.3. Company Financials
- 12.1.13.4. SWOT Analysis
- 12.1.1 Zynga Inc
- 12.2. Market Entropy
- 12.2.1 Company's Key Areas Served
- 12.2.2 Recent Developments
- 12.3. Company Market Share Analysis 2025
- 12.3.1 Top 5 Companies Market Share Analysis
- 12.3.2 Top 3 Companies Market Share Analysis
- 12.4. List of Potential Customers
- 13. Research Methodology
List of Figures
- Figure 1: Global Online Board Games Industry Revenue Breakdown (billion, %) by Region 2025 & 2033
- Figure 2: North America Online Board Games Industry Revenue (billion), by Type 2025 & 2033
- Figure 3: North America Online Board Games Industry Revenue Share (%), by Type 2025 & 2033
- Figure 4: North America Online Board Games Industry Revenue (billion), by Country 2025 & 2033
- Figure 5: North America Online Board Games Industry Revenue Share (%), by Country 2025 & 2033
- Figure 6: Europe Online Board Games Industry Revenue (billion), by Type 2025 & 2033
- Figure 7: Europe Online Board Games Industry Revenue Share (%), by Type 2025 & 2033
- Figure 8: Europe Online Board Games Industry Revenue (billion), by Country 2025 & 2033
- Figure 9: Europe Online Board Games Industry Revenue Share (%), by Country 2025 & 2033
- Figure 10: Asia Pacific Online Board Games Industry Revenue (billion), by Type 2025 & 2033
- Figure 11: Asia Pacific Online Board Games Industry Revenue Share (%), by Type 2025 & 2033
- Figure 12: Asia Pacific Online Board Games Industry Revenue (billion), by Country 2025 & 2033
- Figure 13: Asia Pacific Online Board Games Industry Revenue Share (%), by Country 2025 & 2033
- Figure 14: Latin America Online Board Games Industry Revenue (billion), by Type 2025 & 2033
- Figure 15: Latin America Online Board Games Industry Revenue Share (%), by Type 2025 & 2033
- Figure 16: Latin America Online Board Games Industry Revenue (billion), by Country 2025 & 2033
- Figure 17: Latin America Online Board Games Industry Revenue Share (%), by Country 2025 & 2033
- Figure 18: Middle East and Africa Online Board Games Industry Revenue (billion), by Type 2025 & 2033
- Figure 19: Middle East and Africa Online Board Games Industry Revenue Share (%), by Type 2025 & 2033
- Figure 20: Middle East and Africa Online Board Games Industry Revenue (billion), by Country 2025 & 2033
- Figure 21: Middle East and Africa Online Board Games Industry Revenue Share (%), by Country 2025 & 2033
List of Tables
- Table 1: Global Online Board Games Industry Revenue billion Forecast, by Type 2020 & 2033
- Table 2: Global Online Board Games Industry Revenue billion Forecast, by Region 2020 & 2033
- Table 3: Global Online Board Games Industry Revenue billion Forecast, by Type 2020 & 2033
- Table 4: Global Online Board Games Industry Revenue billion Forecast, by Country 2020 & 2033
- Table 5: United States Online Board Games Industry Revenue (billion) Forecast, by Application 2020 & 2033
- Table 6: Canada Online Board Games Industry Revenue (billion) Forecast, by Application 2020 & 2033
- Table 7: Global Online Board Games Industry Revenue billion Forecast, by Type 2020 & 2033
- Table 8: Global Online Board Games Industry Revenue billion Forecast, by Country 2020 & 2033
- Table 9: United Kingdom Online Board Games Industry Revenue (billion) Forecast, by Application 2020 & 2033
- Table 10: Germany Online Board Games Industry Revenue (billion) Forecast, by Application 2020 & 2033
- Table 11: Spain Online Board Games Industry Revenue (billion) Forecast, by Application 2020 & 2033
- Table 12: France Online Board Games Industry Revenue (billion) Forecast, by Application 2020 & 2033
- Table 13: Rest of Europe Online Board Games Industry Revenue (billion) Forecast, by Application 2020 & 2033
- Table 14: Global Online Board Games Industry Revenue billion Forecast, by Type 2020 & 2033
- Table 15: Global Online Board Games Industry Revenue billion Forecast, by Country 2020 & 2033
- Table 16: China Online Board Games Industry Revenue (billion) Forecast, by Application 2020 & 2033
- Table 17: India Online Board Games Industry Revenue (billion) Forecast, by Application 2020 & 2033
- Table 18: Japan Online Board Games Industry Revenue (billion) Forecast, by Application 2020 & 2033
- Table 19: South Korea Online Board Games Industry Revenue (billion) Forecast, by Application 2020 & 2033
- Table 20: Rest of Asia Pacific Online Board Games Industry Revenue (billion) Forecast, by Application 2020 & 2033
- Table 21: Global Online Board Games Industry Revenue billion Forecast, by Type 2020 & 2033
- Table 22: Global Online Board Games Industry Revenue billion Forecast, by Country 2020 & 2033
- Table 23: Brazil Online Board Games Industry Revenue (billion) Forecast, by Application 2020 & 2033
- Table 24: Mexico Online Board Games Industry Revenue (billion) Forecast, by Application 2020 & 2033
- Table 25: Global Online Board Games Industry Revenue billion Forecast, by Type 2020 & 2033
- Table 26: Global Online Board Games Industry Revenue billion Forecast, by Country 2020 & 2033
- Table 27: Saudi Arabia Online Board Games Industry Revenue (billion) Forecast, by Application 2020 & 2033
- Table 28: South Africa Online Board Games Industry Revenue (billion) Forecast, by Application 2020 & 2033
- Table 29: Nigeria Online Board Games Industry Revenue (billion) Forecast, by Application 2020 & 2033
Frequently Asked Questions
1. What is the projected Compound Annual Growth Rate (CAGR) of the Online Board Games Industry?
The projected CAGR is approximately 10.58%.
2. Which companies are prominent players in the Online Board Games Industry?
Key companies in the market include Zynga Inc, Marmalade Game Studio, Versus Evil LLC, SubZero Entertainment Pvt Ltd, Fantasy Flight Publishing Inc, GungHo Online Entertainment Inc ( SoftBank Group), Tencent Holdings Limited, Chess com*List Not Exhaustive, Nintendo Co Ltd, Handelabra Games, Czech Games Edition, Asmodee Digital, Hurrican Edition SA.
3. What are the main segments of the Online Board Games Industry?
The market segments include Type.
4. Can you provide details about the market size?
The market size is estimated to be USD 15.82 billion as of 2022.
5. What are some drivers contributing to market growth?
Growing Internet penetration; Increasing Users of Smartphones.
6. What are the notable trends driving market growth?
Increasing Users of Smartphones.
7. Are there any restraints impacting market growth?
High complexity in designing and manufacturing emerging non-volatile memory devices.
8. Can you provide examples of recent developments in the market?
June 2022: Zynga Inc., a wholly-owned brand label of Take-Two Interactive, announced that Words With Friends 2 is introducing Clubs. This new feature expands the word game's social experience by offering shared spaces that players use together.
9. What pricing options are available for accessing the report?
Pricing options include single-user, multi-user, and enterprise licenses priced at USD 4750, USD 5250, and USD 8750 respectively.
10. Is the market size provided in terms of value or volume?
The market size is provided in terms of value, measured in billion.
11. Are there any specific market keywords associated with the report?
Yes, the market keyword associated with the report is "Online Board Games Industry," which aids in identifying and referencing the specific market segment covered.
12. How do I determine which pricing option suits my needs best?
The pricing options vary based on user requirements and access needs. Individual users may opt for single-user licenses, while businesses requiring broader access may choose multi-user or enterprise licenses for cost-effective access to the report.
13. Are there any additional resources or data provided in the Online Board Games Industry report?
While the report offers comprehensive insights, it's advisable to review the specific contents or supplementary materials provided to ascertain if additional resources or data are available.
14. How can I stay updated on further developments or reports in the Online Board Games Industry?
To stay informed about further developments, trends, and reports in the Online Board Games Industry, consider subscribing to industry newsletters, following relevant companies and organizations, or regularly checking reputable industry news sources and publications.
Methodology
Step 1 - Identification of Relevant Samples Size from Population Database


Step 2 - Approaches for Defining Global Market Size (Value, Volume* & Price*)

Note*: In applicable scenarios
Step 3 - Data Sources
Primary Research
- Web Analytics
- Survey Reports
- Research Institute
- Latest Research Reports
- Opinion Leaders
Secondary Research
- Annual Reports
- White Paper
- Latest Press Release
- Industry Association
- Paid Database
- Investor Presentations

Step 4 - Data Triangulation
Involves using different sources of information in order to increase the validity of a study
These sources are likely to be stakeholders in a program - participants, other researchers, program staff, other community members, and so on.
Then we put all data in single framework & apply various statistical tools to find out the dynamic on the market.
During the analysis stage, feedback from the stakeholder groups would be compared to determine areas of agreement as well as areas of divergence