

Key Insights
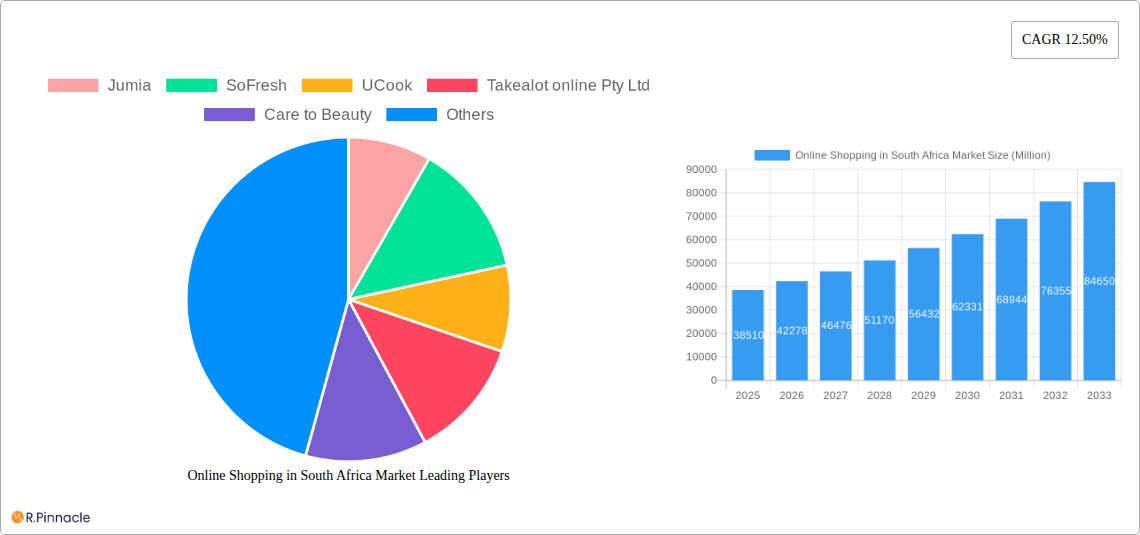
The South African online shopping market is poised for significant expansion, projected to reach $38.51 billion by 2025, driven by a robust Compound Annual Growth Rate (CAGR) of 9.81% throughout the forecast period. This substantial growth is underpinned by an increasing internet penetration, a burgeoning middle class, and a growing consumer preference for the convenience and wider product selection offered by e-commerce platforms. The market is broadly segmented into B2C and B2B e-commerce, with B2C dominating in terms of consumer reach and transaction volume. Within B2C, key application segments like Fashion and Apparel, Beauty and Personal Care, and Consumer Electronics are expected to witness accelerated adoption due to the visually appealing nature of these products and the ease of online purchasing. Emerging trends such as the rise of mobile commerce, increasing adoption of digital payment solutions, and the growing influence of social commerce are further fueling this upward trajectory. The expanding logistical infrastructure and the presence of both global giants and agile local players are contributing to a competitive yet dynamic market environment.
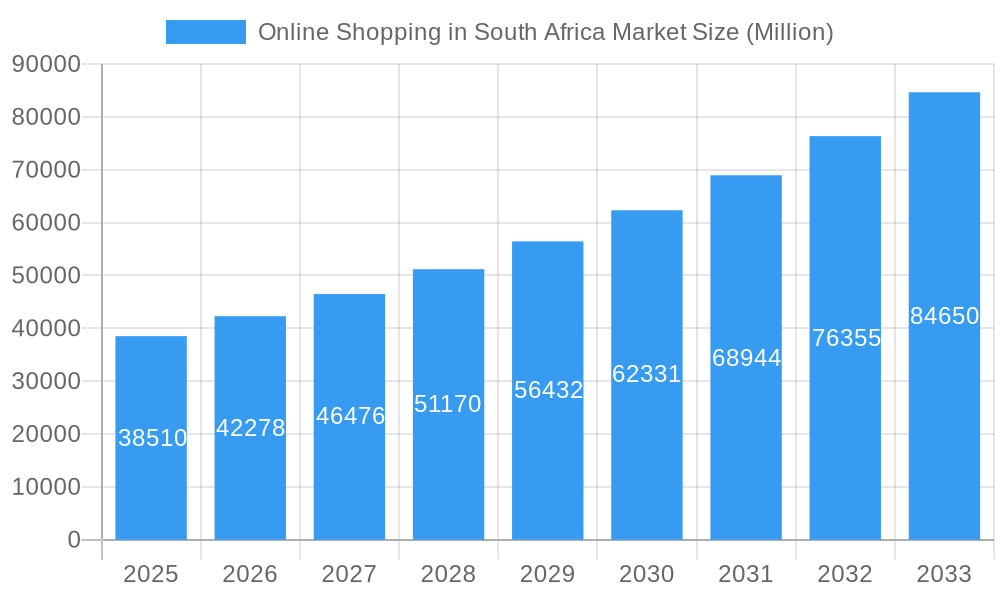
Online Shopping in South Africa Market Market Size (In Billion)
The expansion of online shopping in South Africa is being propelled by several key drivers. Enhanced digital literacy among consumers, coupled with the widespread availability of affordable smartphones and data plans, has democratized access to online retail. Furthermore, a growing emphasis on convenience, driven by busy urban lifestyles and a desire for time-saving solutions, makes online shopping an attractive proposition. The COVID-19 pandemic also acted as a significant catalyst, accelerating the adoption of e-commerce as consumers embraced digital channels for their shopping needs, a trend that has largely persisted. Despite these positive indicators, the market faces certain restraints, including logistical challenges in reaching remote areas, concerns about data security and online fraud, and a segment of the population that still prefers traditional in-store shopping experiences. However, ongoing investments in last-mile delivery solutions and increasing consumer trust are expected to mitigate these challenges, ensuring sustained growth across various e-commerce segments and regions within South Africa.
Online Shopping in South Africa Market Company Market Share
Unlocking the Future: Comprehensive Report on Online Shopping in South Africa Market
Dive deep into the dynamic Online Shopping in South Africa Market with our in-depth report, meticulously crafted to empower industry professionals, investors, and strategists. This comprehensive analysis provides unparalleled insights into market structure, dynamics, and future trajectory, leveraging high-ranking keywords to ensure maximum visibility. We project the market to reach xx billion by 2033, with a significant CAGR of xx% during the forecast period of 2025–2033. Explore historical trends from 2019–2024, with 2025 as our base and estimated year.
Online Shopping in South Africa Market Market Structure & Innovation Trends
The Online Shopping in South Africa Market is characterized by a moderate to high concentration, dominated by a few key players while fostering a vibrant ecosystem for emerging businesses. Innovation is a critical driver, fueled by advancements in logistics, payment gateways, and personalized customer experiences. Regulatory frameworks, though evolving, are crucial for ensuring fair competition and consumer protection. Product substitutes, primarily traditional retail, are increasingly being challenged by the convenience and accessibility of online platforms. End-user demographics are broad, spanning all age groups and income levels, with a growing segment of digitally native consumers driving adoption. Mergers and acquisitions (M&A) are playing a significant role in market consolidation and expansion, with estimated M&A deal values reaching xx billion over the study period. Key innovation trends include the rise of social commerce, the integration of AI for personalized recommendations, and the development of sustainable delivery solutions.
Online Shopping in South Africa Market Market Dynamics & Trends
The Online Shopping in South Africa Market is experiencing robust growth, propelled by several interconnected factors. A primary growth driver is the increasing internet penetration and smartphone adoption across South Africa, making e-commerce accessible to a wider population. This digital shift is amplified by a growing middle class with rising disposable incomes and a preference for the convenience of online purchases. Technological disruptions, such as the widespread adoption of mobile payment solutions and advancements in last-mile delivery, are significantly enhancing the customer experience and reducing friction in the buying process. Consumer preferences are increasingly leaning towards curated product selections, fast delivery times, and seamless return policies, pushing businesses to innovate in these areas. The competitive landscape is dynamic, with established e-commerce giants and agile niche players vying for market share. The B2C ecommerce segment alone is projected to reach a Gross Merchandise Value (GMV) of xx billion by 2027, showcasing its immense potential. The overall Online Shopping in South Africa Market CAGR is estimated at xx% during the forecast period. Market penetration is expected to surge, driven by ongoing urbanization and the expanding digital infrastructure in previously underserved areas.
Dominant Regions & Segments in Online Shopping in South Africa Market
The Online Shopping in South Africa Market exhibits a clear dominance in its B2C ecommerce segment, which is projected to achieve a substantial GMV of xx billion by 2027. Within this segment, key applications driving this growth include Fashion and Apparel, projected to reach xx billion in GMV by 2027, followed by Consumer Electronics at xx billion, and Beauty and Personal Care at xx billion. The Food and Beverage segment is rapidly expanding, estimated at xx billion by 2027, signaling a significant shift in consumer purchasing habits. The "Others" category, encompassing Toys, DIY, and Media, is also showing promising growth, projected at xx billion.
The B2B ecommerce market size is also substantial, estimated to reach xx billion by 2027, indicating a growing adoption of online procurement by businesses.
Key drivers for this dominance include:
- Economic Policies: Government initiatives promoting digital transformation and e-commerce development.
- Infrastructure Development: Continuous investment in broadband internet and logistics networks across major urban and semi-urban centers.
- Consumer Demographics: A young, tech-savvy population with increasing purchasing power and a growing appetite for online shopping convenience.
- Competitive Landscape: Intense competition among major online retailers driving innovation and improved customer service.
The leading region for online shopping is overwhelmingly Gauteng, due to its high population density and economic activity. However, other provinces are experiencing significant growth due to improved connectivity and expanding logistics capabilities. The dominance of the B2C ecommerce sector is driven by the widespread adoption of smartphones and the increasing comfort of consumers with online transactions for everyday goods and services.
Online Shopping in South Africa Market Product Innovations
Product innovations in the Online Shopping in South Africa Market are rapidly transforming the consumer experience. We are witnessing a surge in personalized product recommendations powered by AI, virtual try-on features for fashion and beauty, and the integration of augmented reality for furniture visualization. Companies are also focusing on enhancing the sustainability of their offerings, with eco-friendly packaging and carbon-neutral delivery options gaining traction. Competitive advantages are being carved out through superior user interfaces, faster checkout processes, and more sophisticated customer support systems. The focus remains on creating a seamless, engaging, and trustworthy online shopping journey.
Report Scope & Segmentation Analysis
This report provides an exhaustive analysis of the Online Shopping in South Africa Market, segmented across key areas. The B2C ecommerce market, with an estimated GMV of xx billion by 2027, is analyzed by application:
- Beauty and Personal Care: Projected to reach xx billion by 2027, driven by a growing demand for specialized products and online beauty consultations.
- Consumer Electronics: Estimated at xx billion by 2027, fueled by the continuous release of new gadgets and competitive pricing.
- Fashion and Apparel: Expected to hit xx billion by 2027, boosted by the rise of online fashion retailers and influencer marketing.
- Food and Beverage: A rapidly growing segment, projected at xx billion by 2027, benefiting from the convenience of grocery delivery services.
- Furniture and Home: Forecasted at xx billion by 2027, with increased online exploration and purchase of home goods.
- Others (Toys, DIY, Media, etc.): Valued at xx billion by 2027, reflecting diverse consumer needs.
The B2B ecommerce market is also analyzed, projected to reach xx billion by 2027, showcasing the growing digital procurement trends among South African businesses.
Key Drivers of Online Shopping in South Africa Market Growth
Several pivotal factors are accelerating the growth of the Online Shopping in South Africa Market:
- Digital Infrastructure Expansion: Increased broadband penetration and widespread smartphone adoption.
- Growing Middle Class: Rising disposable incomes and a desire for convenience.
- Technological Advancements: Sophisticated payment gateways, AI-driven personalization, and efficient logistics.
- Evolving Consumer Preferences: Demand for a seamless online shopping experience, fast delivery, and a wide product selection.
- Government Support: Initiatives aimed at fostering digital economies and e-commerce adoption.
Challenges in the Online Shopping in South Africa Market Sector
Despite robust growth, the Online Shopping in South Africa Market faces notable challenges:
- Logistics and Last-Mile Delivery: Reaching remote areas efficiently and cost-effectively remains a hurdle.
- Cybersecurity Concerns: Ensuring data privacy and secure transactions to build consumer trust.
- Regulatory Uncertainty: Evolving policies and compliance requirements can pose complexities for businesses.
- Payment Fraud: The risk of fraudulent transactions necessitates robust security measures.
- Digital Divide: Unequal access to reliable internet connectivity in certain regions limits market reach.
Emerging Opportunities in Online Shopping in South Africa Market
The Online Shopping in South Africa Market presents a fertile ground for emerging opportunities:
- Growth in Tier 2 and Tier 3 Cities: Expanding reach beyond major urban centers.
- Rise of q-commerce (quick commerce): Meeting the demand for ultra-fast delivery of essential goods.
- Sustainable E-commerce Practices: Catering to environmentally conscious consumers through green logistics and packaging.
- Cross-Border E-commerce: Facilitating international trade and product accessibility.
- Hyper-personalization: Leveraging data analytics for highly tailored customer experiences.
Leading Players in the Online Shopping in South Africa Market Market
- Jumia
- SoFresh
- UCook
- Takealot online Pty Ltd
- Care to Beauty
- Superbalist com
- ToysRUs
- Zando
- Cosmetic SA
- Decathlon
- Evetech Pty Ltd
Key Developments in Online Shopping in South Africa Market Industry
- April 2021: US-based retailer Amazon announced plans to establish a new African headquarters in Cape Town, South Africa. This significant development, approved by the government, aims to boost the city's economy and is expected to be completed within 3-5 years.
- December 2021: South Africa's TFG Ltd strategically expanded its e-commerce operations by acquiring Quench, an on-demand online shopping platform and last-mile delivery service. This acquisition enhances TFG's ability to offer fast and reliable delivery nationwide.
Future Outlook for Online Shopping in South Africa Market Market
The future outlook for the Online Shopping in South Africa Market is exceptionally promising. Continued investment in digital infrastructure, coupled with evolving consumer behaviors and supportive government policies, will act as significant growth accelerators. The market is poised for further expansion into niche segments and underserved regions, driven by technological innovation in AI, logistics, and payment solutions. Strategic partnerships and M&A activities will likely shape the competitive landscape, fostering greater efficiency and consumer choice. The market's trajectory indicates sustained double-digit growth, solidifying its position as a critical engine of economic development in South Africa.
Online Shopping in South Africa Market Segmentation
-
1. B2C ecommerce
- 1.1. Market size (GMV) for the period of 2017-2027
-
1.2. Market Segmentation - by Application
- 1.2.1. Beauty and Personal Care
- 1.2.2. Consumer Electronics
- 1.2.3. Fashion and Apparel
- 1.2.4. Food and Beverage
- 1.2.5. Furniture and Home
- 1.2.6. Others (Toys, DIY, Media, etc.)
- 2. Market size (GMV) for the period of 2017-2027
-
3. Application
- 3.1. Beauty and Personal Care
- 3.2. Consumer Electronics
- 3.3. Fashion and Apparel
- 3.4. Food and Beverage
- 3.5. Furniture and Home
- 3.6. Others (Toys, DIY, Media, etc.)
- 4. Beauty and Personal Care
- 5. Consumer Electronics
- 6. Fashion and Apparel
- 7. Food and Beverage
- 8. Furniture and Home
- 9. Others (Toys, DIY, Media, etc.)
-
10. B2B ecommerce
- 10.1. Market size for the period of 2017-2027
Online Shopping in South Africa Market Segmentation By Geography
-
1. North America
- 1.1. United States
- 1.2. Canada
- 1.3. Mexico
-
2. South America
- 2.1. Brazil
- 2.2. Argentina
- 2.3. Rest of South America
-
3. Europe
- 3.1. United Kingdom
- 3.2. Germany
- 3.3. France
- 3.4. Italy
- 3.5. Spain
- 3.6. Russia
- 3.7. Benelux
- 3.8. Nordics
- 3.9. Rest of Europe
-
4. Middle East & Africa
- 4.1. Turkey
- 4.2. Israel
- 4.3. GCC
- 4.4. North Africa
- 4.5. South Africa
- 4.6. Rest of Middle East & Africa
-
5. Asia Pacific
- 5.1. China
- 5.2. India
- 5.3. Japan
- 5.4. South Korea
- 5.5. ASEAN
- 5.6. Oceania
- 5.7. Rest of Asia Pacific
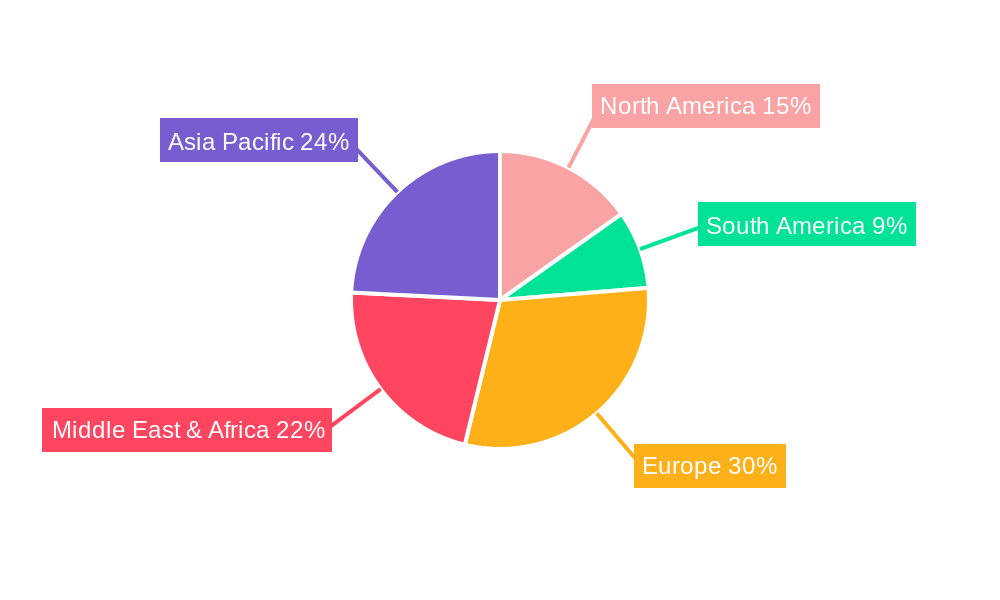
Online Shopping in South Africa Market Regional Market Share
Geographic Coverage of Online Shopping in South Africa Market
Online Shopping in South Africa Market REPORT HIGHLIGHTS
| Aspects | Details |
|---|---|
| Study Period | 2020-2034 |
| Base Year | 2025 |
| Estimated Year | 2026 |
| Forecast Period | 2026-2034 |
| Historical Period | 2020-2025 |
| Growth Rate | CAGR of 8.17% from 2020-2034 |
| Segmentation |
|
Table of Contents
- 1. Introduction
- 1.1. Research Scope
- 1.2. Market Segmentation
- 1.3. Research Objective
- 1.4. Definitions and Assumptions
- 2. Executive Summary
- 2.1. Market Snapshot
- 3. Market Dynamics
- 3.1. Market Drivers
- 3.2. Market Restrains
- 3.3. Market Trends
- 3.4. Market Opportunities
- 4. Market Factor Analysis
- 4.1. Porters Five Forces
- 4.1.1. Bargaining Power of Suppliers
- 4.1.2. Bargaining Power of Buyers
- 4.1.3. Threat of New Entrants
- 4.1.4. Threat of Substitutes
- 4.1.5. Competitive Rivalry
- 4.2. PESTEL analysis
- 4.3. BCG Analysis
- 4.3.1. Stars (High Growth, High Market Share)
- 4.3.2. Cash Cows (Low Growth, High Market Share)
- 4.3.3. Question Mark (High Growth, Low Market Share)
- 4.3.4. Dogs (Low Growth, Low Market Share)
- 4.4. Ansoff Matrix Analysis
- 4.5. Supply Chain Analysis
- 4.6. Regulatory Landscape
- 4.7. Current Market Potential and Opportunity Assessment (TAM–SAM–SOM Framework)
- 4.8. PRI Analyst Note
- 4.1. Porters Five Forces
- 5. Market Analysis, Insights and Forecast 2021-2033
- 5.1. Market Analysis, Insights and Forecast - by B2C ecommerce
- 5.1.1. Market size (GMV) for the period of 2017-2027
- 5.1.2. Market Segmentation - by Application
- 5.1.2.1. Beauty and Personal Care
- 5.1.2.2. Consumer Electronics
- 5.1.2.3. Fashion and Apparel
- 5.1.2.4. Food and Beverage
- 5.1.2.5. Furniture and Home
- 5.1.2.6. Others (Toys, DIY, Media, etc.)
- 5.2. Market Analysis, Insights and Forecast - by Market size (GMV) for the period of 2017-2027
- 5.3. Market Analysis, Insights and Forecast - by Application
- 5.3.1. Beauty and Personal Care
- 5.3.2. Consumer Electronics
- 5.3.3. Fashion and Apparel
- 5.3.4. Food and Beverage
- 5.3.5. Furniture and Home
- 5.3.6. Others (Toys, DIY, Media, etc.)
- 5.4. Market Analysis, Insights and Forecast - by Beauty and Personal Care
- 5.5. Market Analysis, Insights and Forecast - by Consumer Electronics
- 5.6. Market Analysis, Insights and Forecast - by Fashion and Apparel
- 5.7. Market Analysis, Insights and Forecast - by Food and Beverage
- 5.8. Market Analysis, Insights and Forecast - by Furniture and Home
- 5.9. Market Analysis, Insights and Forecast - by Others (Toys, DIY, Media, etc.)
- 5.10. Market Analysis, Insights and Forecast - by B2B ecommerce
- 5.10.1. Market size for the period of 2017-2027
- 5.11. Market Analysis, Insights and Forecast - by Region
- 5.11.1. North America
- 5.11.2. South America
- 5.11.3. Europe
- 5.11.4. Middle East & Africa
- 5.11.5. Asia Pacific
- 5.1. Market Analysis, Insights and Forecast - by B2C ecommerce
- 6. Global Online Shopping in South Africa Market Analysis, Insights and Forecast, 2021-2033
- 6.1. Market Analysis, Insights and Forecast - by B2C ecommerce
- 6.1.1. Market size (GMV) for the period of 2017-2027
- 6.1.2. Market Segmentation - by Application
- 6.1.2.1. Beauty and Personal Care
- 6.1.2.2. Consumer Electronics
- 6.1.2.3. Fashion and Apparel
- 6.1.2.4. Food and Beverage
- 6.1.2.5. Furniture and Home
- 6.1.2.6. Others (Toys, DIY, Media, etc.)
- 6.2. Market Analysis, Insights and Forecast - by Market size (GMV) for the period of 2017-2027
- 6.3. Market Analysis, Insights and Forecast - by Application
- 6.3.1. Beauty and Personal Care
- 6.3.2. Consumer Electronics
- 6.3.3. Fashion and Apparel
- 6.3.4. Food and Beverage
- 6.3.5. Furniture and Home
- 6.3.6. Others (Toys, DIY, Media, etc.)
- 6.4. Market Analysis, Insights and Forecast - by Beauty and Personal Care
- 6.5. Market Analysis, Insights and Forecast - by Consumer Electronics
- 6.6. Market Analysis, Insights and Forecast - by Fashion and Apparel
- 6.7. Market Analysis, Insights and Forecast - by Food and Beverage
- 6.8. Market Analysis, Insights and Forecast - by Furniture and Home
- 6.9. Market Analysis, Insights and Forecast - by Others (Toys, DIY, Media, etc.)
- 6.10. Market Analysis, Insights and Forecast - by B2B ecommerce
- 6.10.1. Market size for the period of 2017-2027
- 6.1. Market Analysis, Insights and Forecast - by B2C ecommerce
- 7. North America Online Shopping in South Africa Market Analysis, Insights and Forecast, 2020-2032
- 7.1. Market Analysis, Insights and Forecast - by B2C ecommerce
- 7.1.1. Market size (GMV) for the period of 2017-2027
- 7.1.2. Market Segmentation - by Application
- 7.1.2.1. Beauty and Personal Care
- 7.1.2.2. Consumer Electronics
- 7.1.2.3. Fashion and Apparel
- 7.1.2.4. Food and Beverage
- 7.1.2.5. Furniture and Home
- 7.1.2.6. Others (Toys, DIY, Media, etc.)
- 7.2. Market Analysis, Insights and Forecast - by Market size (GMV) for the period of 2017-2027
- 7.3. Market Analysis, Insights and Forecast - by Application
- 7.3.1. Beauty and Personal Care
- 7.3.2. Consumer Electronics
- 7.3.3. Fashion and Apparel
- 7.3.4. Food and Beverage
- 7.3.5. Furniture and Home
- 7.3.6. Others (Toys, DIY, Media, etc.)
- 7.4. Market Analysis, Insights and Forecast - by Beauty and Personal Care
- 7.5. Market Analysis, Insights and Forecast - by Consumer Electronics
- 7.6. Market Analysis, Insights and Forecast - by Fashion and Apparel
- 7.7. Market Analysis, Insights and Forecast - by Food and Beverage
- 7.8. Market Analysis, Insights and Forecast - by Furniture and Home
- 7.9. Market Analysis, Insights and Forecast - by Others (Toys, DIY, Media, etc.)
- 7.10. Market Analysis, Insights and Forecast - by B2B ecommerce
- 7.10.1. Market size for the period of 2017-2027
- 7.1. Market Analysis, Insights and Forecast - by B2C ecommerce
- 8. South America Online Shopping in South Africa Market Analysis, Insights and Forecast, 2020-2032
- 8.1. Market Analysis, Insights and Forecast - by B2C ecommerce
- 8.1.1. Market size (GMV) for the period of 2017-2027
- 8.1.2. Market Segmentation - by Application
- 8.1.2.1. Beauty and Personal Care
- 8.1.2.2. Consumer Electronics
- 8.1.2.3. Fashion and Apparel
- 8.1.2.4. Food and Beverage
- 8.1.2.5. Furniture and Home
- 8.1.2.6. Others (Toys, DIY, Media, etc.)
- 8.2. Market Analysis, Insights and Forecast - by Market size (GMV) for the period of 2017-2027
- 8.3. Market Analysis, Insights and Forecast - by Application
- 8.3.1. Beauty and Personal Care
- 8.3.2. Consumer Electronics
- 8.3.3. Fashion and Apparel
- 8.3.4. Food and Beverage
- 8.3.5. Furniture and Home
- 8.3.6. Others (Toys, DIY, Media, etc.)
- 8.4. Market Analysis, Insights and Forecast - by Beauty and Personal Care
- 8.5. Market Analysis, Insights and Forecast - by Consumer Electronics
- 8.6. Market Analysis, Insights and Forecast - by Fashion and Apparel
- 8.7. Market Analysis, Insights and Forecast - by Food and Beverage
- 8.8. Market Analysis, Insights and Forecast - by Furniture and Home
- 8.9. Market Analysis, Insights and Forecast - by Others (Toys, DIY, Media, etc.)
- 8.10. Market Analysis, Insights and Forecast - by B2B ecommerce
- 8.10.1. Market size for the period of 2017-2027
- 8.1. Market Analysis, Insights and Forecast - by B2C ecommerce
- 9. Europe Online Shopping in South Africa Market Analysis, Insights and Forecast, 2020-2032
- 9.1. Market Analysis, Insights and Forecast - by B2C ecommerce
- 9.1.1. Market size (GMV) for the period of 2017-2027
- 9.1.2. Market Segmentation - by Application
- 9.1.2.1. Beauty and Personal Care
- 9.1.2.2. Consumer Electronics
- 9.1.2.3. Fashion and Apparel
- 9.1.2.4. Food and Beverage
- 9.1.2.5. Furniture and Home
- 9.1.2.6. Others (Toys, DIY, Media, etc.)
- 9.2. Market Analysis, Insights and Forecast - by Market size (GMV) for the period of 2017-2027
- 9.3. Market Analysis, Insights and Forecast - by Application
- 9.3.1. Beauty and Personal Care
- 9.3.2. Consumer Electronics
- 9.3.3. Fashion and Apparel
- 9.3.4. Food and Beverage
- 9.3.5. Furniture and Home
- 9.3.6. Others (Toys, DIY, Media, etc.)
- 9.4. Market Analysis, Insights and Forecast - by Beauty and Personal Care
- 9.5. Market Analysis, Insights and Forecast - by Consumer Electronics
- 9.6. Market Analysis, Insights and Forecast - by Fashion and Apparel
- 9.7. Market Analysis, Insights and Forecast - by Food and Beverage
- 9.8. Market Analysis, Insights and Forecast - by Furniture and Home
- 9.9. Market Analysis, Insights and Forecast - by Others (Toys, DIY, Media, etc.)
- 9.10. Market Analysis, Insights and Forecast - by B2B ecommerce
- 9.10.1. Market size for the period of 2017-2027
- 9.1. Market Analysis, Insights and Forecast - by B2C ecommerce
- 10. Middle East & Africa Online Shopping in South Africa Market Analysis, Insights and Forecast, 2020-2032
- 10.1. Market Analysis, Insights and Forecast - by B2C ecommerce
- 10.1.1. Market size (GMV) for the period of 2017-2027
- 10.1.2. Market Segmentation - by Application
- 10.1.2.1. Beauty and Personal Care
- 10.1.2.2. Consumer Electronics
- 10.1.2.3. Fashion and Apparel
- 10.1.2.4. Food and Beverage
- 10.1.2.5. Furniture and Home
- 10.1.2.6. Others (Toys, DIY, Media, etc.)
- 10.2. Market Analysis, Insights and Forecast - by Market size (GMV) for the period of 2017-2027
- 10.3. Market Analysis, Insights and Forecast - by Application
- 10.3.1. Beauty and Personal Care
- 10.3.2. Consumer Electronics
- 10.3.3. Fashion and Apparel
- 10.3.4. Food and Beverage
- 10.3.5. Furniture and Home
- 10.3.6. Others (Toys, DIY, Media, etc.)
- 10.4. Market Analysis, Insights and Forecast - by Beauty and Personal Care
- 10.5. Market Analysis, Insights and Forecast - by Consumer Electronics
- 10.6. Market Analysis, Insights and Forecast - by Fashion and Apparel
- 10.7. Market Analysis, Insights and Forecast - by Food and Beverage
- 10.8. Market Analysis, Insights and Forecast - by Furniture and Home
- 10.9. Market Analysis, Insights and Forecast - by Others (Toys, DIY, Media, etc.)
- 10.10. Market Analysis, Insights and Forecast - by B2B ecommerce
- 10.10.1. Market size for the period of 2017-2027
- 10.1. Market Analysis, Insights and Forecast - by B2C ecommerce
- 11. Asia Pacific Online Shopping in South Africa Market Analysis, Insights and Forecast, 2020-2032
- 11.1. Market Analysis, Insights and Forecast - by B2C ecommerce
- 11.1.1. Market size (GMV) for the period of 2017-2027
- 11.1.2. Market Segmentation - by Application
- 11.1.2.1. Beauty and Personal Care
- 11.1.2.2. Consumer Electronics
- 11.1.2.3. Fashion and Apparel
- 11.1.2.4. Food and Beverage
- 11.1.2.5. Furniture and Home
- 11.1.2.6. Others (Toys, DIY, Media, etc.)
- 11.2. Market Analysis, Insights and Forecast - by Market size (GMV) for the period of 2017-2027
- 11.3. Market Analysis, Insights and Forecast - by Application
- 11.3.1. Beauty and Personal Care
- 11.3.2. Consumer Electronics
- 11.3.3. Fashion and Apparel
- 11.3.4. Food and Beverage
- 11.3.5. Furniture and Home
- 11.3.6. Others (Toys, DIY, Media, etc.)
- 11.4. Market Analysis, Insights and Forecast - by Beauty and Personal Care
- 11.5. Market Analysis, Insights and Forecast - by Consumer Electronics
- 11.6. Market Analysis, Insights and Forecast - by Fashion and Apparel
- 11.7. Market Analysis, Insights and Forecast - by Food and Beverage
- 11.8. Market Analysis, Insights and Forecast - by Furniture and Home
- 11.9. Market Analysis, Insights and Forecast - by Others (Toys, DIY, Media, etc.)
- 11.10. Market Analysis, Insights and Forecast - by B2B ecommerce
- 11.10.1. Market size for the period of 2017-2027
- 11.1. Market Analysis, Insights and Forecast - by B2C ecommerce
- 12. Competitive Analysis
- 12.1. Company Profiles
- 12.1.1 Jumia
- 12.1.1.1. Company Overview
- 12.1.1.2. Products
- 12.1.1.3. Company Financials
- 12.1.1.4. SWOT Analysis
- 12.1.2 SoFresh
- 12.1.2.1. Company Overview
- 12.1.2.2. Products
- 12.1.2.3. Company Financials
- 12.1.2.4. SWOT Analysis
- 12.1.3 UCook
- 12.1.3.1. Company Overview
- 12.1.3.2. Products
- 12.1.3.3. Company Financials
- 12.1.3.4. SWOT Analysis
- 12.1.4 Takealot online Pty Ltd
- 12.1.4.1. Company Overview
- 12.1.4.2. Products
- 12.1.4.3. Company Financials
- 12.1.4.4. SWOT Analysis
- 12.1.5 Care to Beauty
- 12.1.5.1. Company Overview
- 12.1.5.2. Products
- 12.1.5.3. Company Financials
- 12.1.5.4. SWOT Analysis
- 12.1.6 Superbalist com
- 12.1.6.1. Company Overview
- 12.1.6.2. Products
- 12.1.6.3. Company Financials
- 12.1.6.4. SWOT Analysis
- 12.1.7 ToysRUs
- 12.1.7.1. Company Overview
- 12.1.7.2. Products
- 12.1.7.3. Company Financials
- 12.1.7.4. SWOT Analysis
- 12.1.8 Zando
- 12.1.8.1. Company Overview
- 12.1.8.2. Products
- 12.1.8.3. Company Financials
- 12.1.8.4. SWOT Analysis
- 12.1.9 Cosmetic SA
- 12.1.9.1. Company Overview
- 12.1.9.2. Products
- 12.1.9.3. Company Financials
- 12.1.9.4. SWOT Analysis
- 12.1.10 Decathlon
- 12.1.10.1. Company Overview
- 12.1.10.2. Products
- 12.1.10.3. Company Financials
- 12.1.10.4. SWOT Analysis
- 12.1.11 Evetech Pty Ltd*List Not Exhaustive
- 12.1.11.1. Company Overview
- 12.1.11.2. Products
- 12.1.11.3. Company Financials
- 12.1.11.4. SWOT Analysis
- 12.1.1 Jumia
- 12.2. Market Entropy
- 12.2.1 Company's Key Areas Served
- 12.2.2 Recent Developments
- 12.3. Company Market Share Analysis 2025
- 12.3.1 Top 5 Companies Market Share Analysis
- 12.3.2 Top 3 Companies Market Share Analysis
- 12.4. List of Potential Customers
- 13. Research Methodology
List of Figures
- Figure 1: Global Online Shopping in South Africa Market Revenue Breakdown (billion, %) by Region 2025 & 2033
- Figure 2: North America Online Shopping in South Africa Market Revenue (billion), by B2C ecommerce 2025 & 2033
- Figure 3: North America Online Shopping in South Africa Market Revenue Share (%), by B2C ecommerce 2025 & 2033
- Figure 4: North America Online Shopping in South Africa Market Revenue (billion), by Market size (GMV) for the period of 2017-2027 2025 & 2033
- Figure 5: North America Online Shopping in South Africa Market Revenue Share (%), by Market size (GMV) for the period of 2017-2027 2025 & 2033
- Figure 6: North America Online Shopping in South Africa Market Revenue (billion), by Application 2025 & 2033
- Figure 7: North America Online Shopping in South Africa Market Revenue Share (%), by Application 2025 & 2033
- Figure 8: North America Online Shopping in South Africa Market Revenue (billion), by Beauty and Personal Care 2025 & 2033
- Figure 9: North America Online Shopping in South Africa Market Revenue Share (%), by Beauty and Personal Care 2025 & 2033
- Figure 10: North America Online Shopping in South Africa Market Revenue (billion), by Consumer Electronics 2025 & 2033
- Figure 11: North America Online Shopping in South Africa Market Revenue Share (%), by Consumer Electronics 2025 & 2033
- Figure 12: North America Online Shopping in South Africa Market Revenue (billion), by Fashion and Apparel 2025 & 2033
- Figure 13: North America Online Shopping in South Africa Market Revenue Share (%), by Fashion and Apparel 2025 & 2033
- Figure 14: North America Online Shopping in South Africa Market Revenue (billion), by Food and Beverage 2025 & 2033
- Figure 15: North America Online Shopping in South Africa Market Revenue Share (%), by Food and Beverage 2025 & 2033
- Figure 16: North America Online Shopping in South Africa Market Revenue (billion), by Furniture and Home 2025 & 2033
- Figure 17: North America Online Shopping in South Africa Market Revenue Share (%), by Furniture and Home 2025 & 2033
- Figure 18: North America Online Shopping in South Africa Market Revenue (billion), by Others (Toys, DIY, Media, etc.) 2025 & 2033
- Figure 19: North America Online Shopping in South Africa Market Revenue Share (%), by Others (Toys, DIY, Media, etc.) 2025 & 2033
- Figure 20: North America Online Shopping in South Africa Market Revenue (billion), by B2B ecommerce 2025 & 2033
- Figure 21: North America Online Shopping in South Africa Market Revenue Share (%), by B2B ecommerce 2025 & 2033
- Figure 22: North America Online Shopping in South Africa Market Revenue (billion), by Country 2025 & 2033
- Figure 23: North America Online Shopping in South Africa Market Revenue Share (%), by Country 2025 & 2033
- Figure 24: South America Online Shopping in South Africa Market Revenue (billion), by B2C ecommerce 2025 & 2033
- Figure 25: South America Online Shopping in South Africa Market Revenue Share (%), by B2C ecommerce 2025 & 2033
- Figure 26: South America Online Shopping in South Africa Market Revenue (billion), by Market size (GMV) for the period of 2017-2027 2025 & 2033
- Figure 27: South America Online Shopping in South Africa Market Revenue Share (%), by Market size (GMV) for the period of 2017-2027 2025 & 2033
- Figure 28: South America Online Shopping in South Africa Market Revenue (billion), by Application 2025 & 2033
- Figure 29: South America Online Shopping in South Africa Market Revenue Share (%), by Application 2025 & 2033
- Figure 30: South America Online Shopping in South Africa Market Revenue (billion), by Beauty and Personal Care 2025 & 2033
- Figure 31: South America Online Shopping in South Africa Market Revenue Share (%), by Beauty and Personal Care 2025 & 2033
- Figure 32: South America Online Shopping in South Africa Market Revenue (billion), by Consumer Electronics 2025 & 2033
- Figure 33: South America Online Shopping in South Africa Market Revenue Share (%), by Consumer Electronics 2025 & 2033
- Figure 34: South America Online Shopping in South Africa Market Revenue (billion), by Fashion and Apparel 2025 & 2033
- Figure 35: South America Online Shopping in South Africa Market Revenue Share (%), by Fashion and Apparel 2025 & 2033
- Figure 36: South America Online Shopping in South Africa Market Revenue (billion), by Food and Beverage 2025 & 2033
- Figure 37: South America Online Shopping in South Africa Market Revenue Share (%), by Food and Beverage 2025 & 2033
- Figure 38: South America Online Shopping in South Africa Market Revenue (billion), by Furniture and Home 2025 & 2033
- Figure 39: South America Online Shopping in South Africa Market Revenue Share (%), by Furniture and Home 2025 & 2033
- Figure 40: South America Online Shopping in South Africa Market Revenue (billion), by Others (Toys, DIY, Media, etc.) 2025 & 2033
- Figure 41: South America Online Shopping in South Africa Market Revenue Share (%), by Others (Toys, DIY, Media, etc.) 2025 & 2033
- Figure 42: South America Online Shopping in South Africa Market Revenue (billion), by B2B ecommerce 2025 & 2033
- Figure 43: South America Online Shopping in South Africa Market Revenue Share (%), by B2B ecommerce 2025 & 2033
- Figure 44: South America Online Shopping in South Africa Market Revenue (billion), by Country 2025 & 2033
- Figure 45: South America Online Shopping in South Africa Market Revenue Share (%), by Country 2025 & 2033
- Figure 46: Europe Online Shopping in South Africa Market Revenue (billion), by B2C ecommerce 2025 & 2033
- Figure 47: Europe Online Shopping in South Africa Market Revenue Share (%), by B2C ecommerce 2025 & 2033
- Figure 48: Europe Online Shopping in South Africa Market Revenue (billion), by Market size (GMV) for the period of 2017-2027 2025 & 2033
- Figure 49: Europe Online Shopping in South Africa Market Revenue Share (%), by Market size (GMV) for the period of 2017-2027 2025 & 2033
- Figure 50: Europe Online Shopping in South Africa Market Revenue (billion), by Application 2025 & 2033
- Figure 51: Europe Online Shopping in South Africa Market Revenue Share (%), by Application 2025 & 2033
- Figure 52: Europe Online Shopping in South Africa Market Revenue (billion), by Beauty and Personal Care 2025 & 2033
- Figure 53: Europe Online Shopping in South Africa Market Revenue Share (%), by Beauty and Personal Care 2025 & 2033
- Figure 54: Europe Online Shopping in South Africa Market Revenue (billion), by Consumer Electronics 2025 & 2033
- Figure 55: Europe Online Shopping in South Africa Market Revenue Share (%), by Consumer Electronics 2025 & 2033
- Figure 56: Europe Online Shopping in South Africa Market Revenue (billion), by Fashion and Apparel 2025 & 2033
- Figure 57: Europe Online Shopping in South Africa Market Revenue Share (%), by Fashion and Apparel 2025 & 2033
- Figure 58: Europe Online Shopping in South Africa Market Revenue (billion), by Food and Beverage 2025 & 2033
- Figure 59: Europe Online Shopping in South Africa Market Revenue Share (%), by Food and Beverage 2025 & 2033
- Figure 60: Europe Online Shopping in South Africa Market Revenue (billion), by Furniture and Home 2025 & 2033
- Figure 61: Europe Online Shopping in South Africa Market Revenue Share (%), by Furniture and Home 2025 & 2033
- Figure 62: Europe Online Shopping in South Africa Market Revenue (billion), by Others (Toys, DIY, Media, etc.) 2025 & 2033
- Figure 63: Europe Online Shopping in South Africa Market Revenue Share (%), by Others (Toys, DIY, Media, etc.) 2025 & 2033
- Figure 64: Europe Online Shopping in South Africa Market Revenue (billion), by B2B ecommerce 2025 & 2033
- Figure 65: Europe Online Shopping in South Africa Market Revenue Share (%), by B2B ecommerce 2025 & 2033
- Figure 66: Europe Online Shopping in South Africa Market Revenue (billion), by Country 2025 & 2033
- Figure 67: Europe Online Shopping in South Africa Market Revenue Share (%), by Country 2025 & 2033
- Figure 68: Middle East & Africa Online Shopping in South Africa Market Revenue (billion), by B2C ecommerce 2025 & 2033
- Figure 69: Middle East & Africa Online Shopping in South Africa Market Revenue Share (%), by B2C ecommerce 2025 & 2033
- Figure 70: Middle East & Africa Online Shopping in South Africa Market Revenue (billion), by Market size (GMV) for the period of 2017-2027 2025 & 2033
- Figure 71: Middle East & Africa Online Shopping in South Africa Market Revenue Share (%), by Market size (GMV) for the period of 2017-2027 2025 & 2033
- Figure 72: Middle East & Africa Online Shopping in South Africa Market Revenue (billion), by Application 2025 & 2033
- Figure 73: Middle East & Africa Online Shopping in South Africa Market Revenue Share (%), by Application 2025 & 2033
- Figure 74: Middle East & Africa Online Shopping in South Africa Market Revenue (billion), by Beauty and Personal Care 2025 & 2033
- Figure 75: Middle East & Africa Online Shopping in South Africa Market Revenue Share (%), by Beauty and Personal Care 2025 & 2033
- Figure 76: Middle East & Africa Online Shopping in South Africa Market Revenue (billion), by Consumer Electronics 2025 & 2033
- Figure 77: Middle East & Africa Online Shopping in South Africa Market Revenue Share (%), by Consumer Electronics 2025 & 2033
- Figure 78: Middle East & Africa Online Shopping in South Africa Market Revenue (billion), by Fashion and Apparel 2025 & 2033
- Figure 79: Middle East & Africa Online Shopping in South Africa Market Revenue Share (%), by Fashion and Apparel 2025 & 2033
- Figure 80: Middle East & Africa Online Shopping in South Africa Market Revenue (billion), by Food and Beverage 2025 & 2033
- Figure 81: Middle East & Africa Online Shopping in South Africa Market Revenue Share (%), by Food and Beverage 2025 & 2033
- Figure 82: Middle East & Africa Online Shopping in South Africa Market Revenue (billion), by Furniture and Home 2025 & 2033
- Figure 83: Middle East & Africa Online Shopping in South Africa Market Revenue Share (%), by Furniture and Home 2025 & 2033
- Figure 84: Middle East & Africa Online Shopping in South Africa Market Revenue (billion), by Others (Toys, DIY, Media, etc.) 2025 & 2033
- Figure 85: Middle East & Africa Online Shopping in South Africa Market Revenue Share (%), by Others (Toys, DIY, Media, etc.) 2025 & 2033
- Figure 86: Middle East & Africa Online Shopping in South Africa Market Revenue (billion), by B2B ecommerce 2025 & 2033
- Figure 87: Middle East & Africa Online Shopping in South Africa Market Revenue Share (%), by B2B ecommerce 2025 & 2033
- Figure 88: Middle East & Africa Online Shopping in South Africa Market Revenue (billion), by Country 2025 & 2033
- Figure 89: Middle East & Africa Online Shopping in South Africa Market Revenue Share (%), by Country 2025 & 2033
- Figure 90: Asia Pacific Online Shopping in South Africa Market Revenue (billion), by B2C ecommerce 2025 & 2033
- Figure 91: Asia Pacific Online Shopping in South Africa Market Revenue Share (%), by B2C ecommerce 2025 & 2033
- Figure 92: Asia Pacific Online Shopping in South Africa Market Revenue (billion), by Market size (GMV) for the period of 2017-2027 2025 & 2033
- Figure 93: Asia Pacific Online Shopping in South Africa Market Revenue Share (%), by Market size (GMV) for the period of 2017-2027 2025 & 2033
- Figure 94: Asia Pacific Online Shopping in South Africa Market Revenue (billion), by Application 2025 & 2033
- Figure 95: Asia Pacific Online Shopping in South Africa Market Revenue Share (%), by Application 2025 & 2033
- Figure 96: Asia Pacific Online Shopping in South Africa Market Revenue (billion), by Beauty and Personal Care 2025 & 2033
- Figure 97: Asia Pacific Online Shopping in South Africa Market Revenue Share (%), by Beauty and Personal Care 2025 & 2033
- Figure 98: Asia Pacific Online Shopping in South Africa Market Revenue (billion), by Consumer Electronics 2025 & 2033
- Figure 99: Asia Pacific Online Shopping in South Africa Market Revenue Share (%), by Consumer Electronics 2025 & 2033
- Figure 100: Asia Pacific Online Shopping in South Africa Market Revenue (billion), by Fashion and Apparel 2025 & 2033
- Figure 101: Asia Pacific Online Shopping in South Africa Market Revenue Share (%), by Fashion and Apparel 2025 & 2033
- Figure 102: Asia Pacific Online Shopping in South Africa Market Revenue (billion), by Food and Beverage 2025 & 2033
- Figure 103: Asia Pacific Online Shopping in South Africa Market Revenue Share (%), by Food and Beverage 2025 & 2033
- Figure 104: Asia Pacific Online Shopping in South Africa Market Revenue (billion), by Furniture and Home 2025 & 2033
- Figure 105: Asia Pacific Online Shopping in South Africa Market Revenue Share (%), by Furniture and Home 2025 & 2033
- Figure 106: Asia Pacific Online Shopping in South Africa Market Revenue (billion), by Others (Toys, DIY, Media, etc.) 2025 & 2033
- Figure 107: Asia Pacific Online Shopping in South Africa Market Revenue Share (%), by Others (Toys, DIY, Media, etc.) 2025 & 2033
- Figure 108: Asia Pacific Online Shopping in South Africa Market Revenue (billion), by B2B ecommerce 2025 & 2033
- Figure 109: Asia Pacific Online Shopping in South Africa Market Revenue Share (%), by B2B ecommerce 2025 & 2033
- Figure 110: Asia Pacific Online Shopping in South Africa Market Revenue (billion), by Country 2025 & 2033
- Figure 111: Asia Pacific Online Shopping in South Africa Market Revenue Share (%), by Country 2025 & 2033
List of Tables
- Table 1: Global Online Shopping in South Africa Market Revenue billion Forecast, by B2C ecommerce 2020 & 2033
- Table 2: Global Online Shopping in South Africa Market Revenue billion Forecast, by Market size (GMV) for the period of 2017-2027 2020 & 2033
- Table 3: Global Online Shopping in South Africa Market Revenue billion Forecast, by Application 2020 & 2033
- Table 4: Global Online Shopping in South Africa Market Revenue billion Forecast, by Beauty and Personal Care 2020 & 2033
- Table 5: Global Online Shopping in South Africa Market Revenue billion Forecast, by Consumer Electronics 2020 & 2033
- Table 6: Global Online Shopping in South Africa Market Revenue billion Forecast, by Fashion and Apparel 2020 & 2033
- Table 7: Global Online Shopping in South Africa Market Revenue billion Forecast, by Food and Beverage 2020 & 2033
- Table 8: Global Online Shopping in South Africa Market Revenue billion Forecast, by Furniture and Home 2020 & 2033
- Table 9: Global Online Shopping in South Africa Market Revenue billion Forecast, by Others (Toys, DIY, Media, etc.) 2020 & 2033
- Table 10: Global Online Shopping in South Africa Market Revenue billion Forecast, by B2B ecommerce 2020 & 2033
- Table 11: Global Online Shopping in South Africa Market Revenue billion Forecast, by Region 2020 & 2033
- Table 12: Global Online Shopping in South Africa Market Revenue billion Forecast, by B2C ecommerce 2020 & 2033
- Table 13: Global Online Shopping in South Africa Market Revenue billion Forecast, by Market size (GMV) for the period of 2017-2027 2020 & 2033
- Table 14: Global Online Shopping in South Africa Market Revenue billion Forecast, by Application 2020 & 2033
- Table 15: Global Online Shopping in South Africa Market Revenue billion Forecast, by Beauty and Personal Care 2020 & 2033
- Table 16: Global Online Shopping in South Africa Market Revenue billion Forecast, by Consumer Electronics 2020 & 2033
- Table 17: Global Online Shopping in South Africa Market Revenue billion Forecast, by Fashion and Apparel 2020 & 2033
- Table 18: Global Online Shopping in South Africa Market Revenue billion Forecast, by Food and Beverage 2020 & 2033
- Table 19: Global Online Shopping in South Africa Market Revenue billion Forecast, by Furniture and Home 2020 & 2033
- Table 20: Global Online Shopping in South Africa Market Revenue billion Forecast, by Others (Toys, DIY, Media, etc.) 2020 & 2033
- Table 21: Global Online Shopping in South Africa Market Revenue billion Forecast, by B2B ecommerce 2020 & 2033
- Table 22: Global Online Shopping in South Africa Market Revenue billion Forecast, by Country 2020 & 2033
- Table 23: United States Online Shopping in South Africa Market Revenue (billion) Forecast, by Application 2020 & 2033
- Table 24: Canada Online Shopping in South Africa Market Revenue (billion) Forecast, by Application 2020 & 2033
- Table 25: Mexico Online Shopping in South Africa Market Revenue (billion) Forecast, by Application 2020 & 2033
- Table 26: Global Online Shopping in South Africa Market Revenue billion Forecast, by B2C ecommerce 2020 & 2033
- Table 27: Global Online Shopping in South Africa Market Revenue billion Forecast, by Market size (GMV) for the period of 2017-2027 2020 & 2033
- Table 28: Global Online Shopping in South Africa Market Revenue billion Forecast, by Application 2020 & 2033
- Table 29: Global Online Shopping in South Africa Market Revenue billion Forecast, by Beauty and Personal Care 2020 & 2033
- Table 30: Global Online Shopping in South Africa Market Revenue billion Forecast, by Consumer Electronics 2020 & 2033
- Table 31: Global Online Shopping in South Africa Market Revenue billion Forecast, by Fashion and Apparel 2020 & 2033
- Table 32: Global Online Shopping in South Africa Market Revenue billion Forecast, by Food and Beverage 2020 & 2033
- Table 33: Global Online Shopping in South Africa Market Revenue billion Forecast, by Furniture and Home 2020 & 2033
- Table 34: Global Online Shopping in South Africa Market Revenue billion Forecast, by Others (Toys, DIY, Media, etc.) 2020 & 2033
- Table 35: Global Online Shopping in South Africa Market Revenue billion Forecast, by B2B ecommerce 2020 & 2033
- Table 36: Global Online Shopping in South Africa Market Revenue billion Forecast, by Country 2020 & 2033
- Table 37: Brazil Online Shopping in South Africa Market Revenue (billion) Forecast, by Application 2020 & 2033
- Table 38: Argentina Online Shopping in South Africa Market Revenue (billion) Forecast, by Application 2020 & 2033
- Table 39: Rest of South America Online Shopping in South Africa Market Revenue (billion) Forecast, by Application 2020 & 2033
- Table 40: Global Online Shopping in South Africa Market Revenue billion Forecast, by B2C ecommerce 2020 & 2033
- Table 41: Global Online Shopping in South Africa Market Revenue billion Forecast, by Market size (GMV) for the period of 2017-2027 2020 & 2033
- Table 42: Global Online Shopping in South Africa Market Revenue billion Forecast, by Application 2020 & 2033
- Table 43: Global Online Shopping in South Africa Market Revenue billion Forecast, by Beauty and Personal Care 2020 & 2033
- Table 44: Global Online Shopping in South Africa Market Revenue billion Forecast, by Consumer Electronics 2020 & 2033
- Table 45: Global Online Shopping in South Africa Market Revenue billion Forecast, by Fashion and Apparel 2020 & 2033
- Table 46: Global Online Shopping in South Africa Market Revenue billion Forecast, by Food and Beverage 2020 & 2033
- Table 47: Global Online Shopping in South Africa Market Revenue billion Forecast, by Furniture and Home 2020 & 2033
- Table 48: Global Online Shopping in South Africa Market Revenue billion Forecast, by Others (Toys, DIY, Media, etc.) 2020 & 2033
- Table 49: Global Online Shopping in South Africa Market Revenue billion Forecast, by B2B ecommerce 2020 & 2033
- Table 50: Global Online Shopping in South Africa Market Revenue billion Forecast, by Country 2020 & 2033
- Table 51: United Kingdom Online Shopping in South Africa Market Revenue (billion) Forecast, by Application 2020 & 2033
- Table 52: Germany Online Shopping in South Africa Market Revenue (billion) Forecast, by Application 2020 & 2033
- Table 53: France Online Shopping in South Africa Market Revenue (billion) Forecast, by Application 2020 & 2033
- Table 54: Italy Online Shopping in South Africa Market Revenue (billion) Forecast, by Application 2020 & 2033
- Table 55: Spain Online Shopping in South Africa Market Revenue (billion) Forecast, by Application 2020 & 2033
- Table 56: Russia Online Shopping in South Africa Market Revenue (billion) Forecast, by Application 2020 & 2033
- Table 57: Benelux Online Shopping in South Africa Market Revenue (billion) Forecast, by Application 2020 & 2033
- Table 58: Nordics Online Shopping in South Africa Market Revenue (billion) Forecast, by Application 2020 & 2033
- Table 59: Rest of Europe Online Shopping in South Africa Market Revenue (billion) Forecast, by Application 2020 & 2033
- Table 60: Global Online Shopping in South Africa Market Revenue billion Forecast, by B2C ecommerce 2020 & 2033
- Table 61: Global Online Shopping in South Africa Market Revenue billion Forecast, by Market size (GMV) for the period of 2017-2027 2020 & 2033
- Table 62: Global Online Shopping in South Africa Market Revenue billion Forecast, by Application 2020 & 2033
- Table 63: Global Online Shopping in South Africa Market Revenue billion Forecast, by Beauty and Personal Care 2020 & 2033
- Table 64: Global Online Shopping in South Africa Market Revenue billion Forecast, by Consumer Electronics 2020 & 2033
- Table 65: Global Online Shopping in South Africa Market Revenue billion Forecast, by Fashion and Apparel 2020 & 2033
- Table 66: Global Online Shopping in South Africa Market Revenue billion Forecast, by Food and Beverage 2020 & 2033
- Table 67: Global Online Shopping in South Africa Market Revenue billion Forecast, by Furniture and Home 2020 & 2033
- Table 68: Global Online Shopping in South Africa Market Revenue billion Forecast, by Others (Toys, DIY, Media, etc.) 2020 & 2033
- Table 69: Global Online Shopping in South Africa Market Revenue billion Forecast, by B2B ecommerce 2020 & 2033
- Table 70: Global Online Shopping in South Africa Market Revenue billion Forecast, by Country 2020 & 2033
- Table 71: Turkey Online Shopping in South Africa Market Revenue (billion) Forecast, by Application 2020 & 2033
- Table 72: Israel Online Shopping in South Africa Market Revenue (billion) Forecast, by Application 2020 & 2033
- Table 73: GCC Online Shopping in South Africa Market Revenue (billion) Forecast, by Application 2020 & 2033
- Table 74: North Africa Online Shopping in South Africa Market Revenue (billion) Forecast, by Application 2020 & 2033
- Table 75: South Africa Online Shopping in South Africa Market Revenue (billion) Forecast, by Application 2020 & 2033
- Table 76: Rest of Middle East & Africa Online Shopping in South Africa Market Revenue (billion) Forecast, by Application 2020 & 2033
- Table 77: Global Online Shopping in South Africa Market Revenue billion Forecast, by B2C ecommerce 2020 & 2033
- Table 78: Global Online Shopping in South Africa Market Revenue billion Forecast, by Market size (GMV) for the period of 2017-2027 2020 & 2033
- Table 79: Global Online Shopping in South Africa Market Revenue billion Forecast, by Application 2020 & 2033
- Table 80: Global Online Shopping in South Africa Market Revenue billion Forecast, by Beauty and Personal Care 2020 & 2033
- Table 81: Global Online Shopping in South Africa Market Revenue billion Forecast, by Consumer Electronics 2020 & 2033
- Table 82: Global Online Shopping in South Africa Market Revenue billion Forecast, by Fashion and Apparel 2020 & 2033
- Table 83: Global Online Shopping in South Africa Market Revenue billion Forecast, by Food and Beverage 2020 & 2033
- Table 84: Global Online Shopping in South Africa Market Revenue billion Forecast, by Furniture and Home 2020 & 2033
- Table 85: Global Online Shopping in South Africa Market Revenue billion Forecast, by Others (Toys, DIY, Media, etc.) 2020 & 2033
- Table 86: Global Online Shopping in South Africa Market Revenue billion Forecast, by B2B ecommerce 2020 & 2033
- Table 87: Global Online Shopping in South Africa Market Revenue billion Forecast, by Country 2020 & 2033
- Table 88: China Online Shopping in South Africa Market Revenue (billion) Forecast, by Application 2020 & 2033
- Table 89: India Online Shopping in South Africa Market Revenue (billion) Forecast, by Application 2020 & 2033
- Table 90: Japan Online Shopping in South Africa Market Revenue (billion) Forecast, by Application 2020 & 2033
- Table 91: South Korea Online Shopping in South Africa Market Revenue (billion) Forecast, by Application 2020 & 2033
- Table 92: ASEAN Online Shopping in South Africa Market Revenue (billion) Forecast, by Application 2020 & 2033
- Table 93: Oceania Online Shopping in South Africa Market Revenue (billion) Forecast, by Application 2020 & 2033
- Table 94: Rest of Asia Pacific Online Shopping in South Africa Market Revenue (billion) Forecast, by Application 2020 & 2033
Frequently Asked Questions
1. What is the projected Compound Annual Growth Rate (CAGR) of the Online Shopping in South Africa Market?
The projected CAGR is approximately 8.17%.
2. Which companies are prominent players in the Online Shopping in South Africa Market?
Key companies in the market include Jumia, SoFresh, UCook, Takealot online Pty Ltd, Care to Beauty, Superbalist com, ToysRUs, Zando, Cosmetic SA, Decathlon, Evetech Pty Ltd*List Not Exhaustive.
3. What are the main segments of the Online Shopping in South Africa Market?
The market segments include B2C ecommerce, Market size (GMV) for the period of 2017-2027, Application, Beauty and Personal Care, Consumer Electronics, Fashion and Apparel, Food and Beverage, Furniture and Home, Others (Toys, DIY, Media, etc.), B2B ecommerce.
4. Can you provide details about the market size?
The market size is estimated to be USD 38.11 billion as of 2022.
5. What are some drivers contributing to market growth?
Growing Demand from Fashion Industry; Penetration of Internet and Smartphone Usage.
6. What are the notable trends driving market growth?
Fashion industry to have significant growth in the country.
7. Are there any restraints impacting market growth?
Performance Constraint of Cryocoolers.
8. Can you provide examples of recent developments in the market?
April 2021 - US-based retailer Amazon will set up a new African headquarters in Cape Town, South Africa. The government approved the proposed multipurpose development on 15 acres of land to boost the city's economy, with Amazon headquarters as the project's main tenant. Development is in stages and is expected to be completed within 3-5 years.
9. What pricing options are available for accessing the report?
Pricing options include single-user, multi-user, and enterprise licenses priced at USD 3800, USD 4500, and USD 5800 respectively.
10. Is the market size provided in terms of value or volume?
The market size is provided in terms of value, measured in billion.
11. Are there any specific market keywords associated with the report?
Yes, the market keyword associated with the report is "Online Shopping in South Africa Market," which aids in identifying and referencing the specific market segment covered.
12. How do I determine which pricing option suits my needs best?
The pricing options vary based on user requirements and access needs. Individual users may opt for single-user licenses, while businesses requiring broader access may choose multi-user or enterprise licenses for cost-effective access to the report.
13. Are there any additional resources or data provided in the Online Shopping in South Africa Market report?
While the report offers comprehensive insights, it's advisable to review the specific contents or supplementary materials provided to ascertain if additional resources or data are available.
14. How can I stay updated on further developments or reports in the Online Shopping in South Africa Market?
To stay informed about further developments, trends, and reports in the Online Shopping in South Africa Market, consider subscribing to industry newsletters, following relevant companies and organizations, or regularly checking reputable industry news sources and publications.
Methodology
Step 1 - Identification of Relevant Samples Size from Population Database


Step 2 - Approaches for Defining Global Market Size (Value, Volume* & Price*)

Note*: In applicable scenarios
Step 3 - Data Sources
Primary Research
- Web Analytics
- Survey Reports
- Research Institute
- Latest Research Reports
- Opinion Leaders
Secondary Research
- Annual Reports
- White Paper
- Latest Press Release
- Industry Association
- Paid Database
- Investor Presentations

Step 4 - Data Triangulation
Involves using different sources of information in order to increase the validity of a study
These sources are likely to be stakeholders in a program - participants, other researchers, program staff, other community members, and so on.
Then we put all data in single framework & apply various statistical tools to find out the dynamic on the market.
During the analysis stage, feedback from the stakeholder groups would be compared to determine areas of agreement as well as areas of divergence