

Key Insights
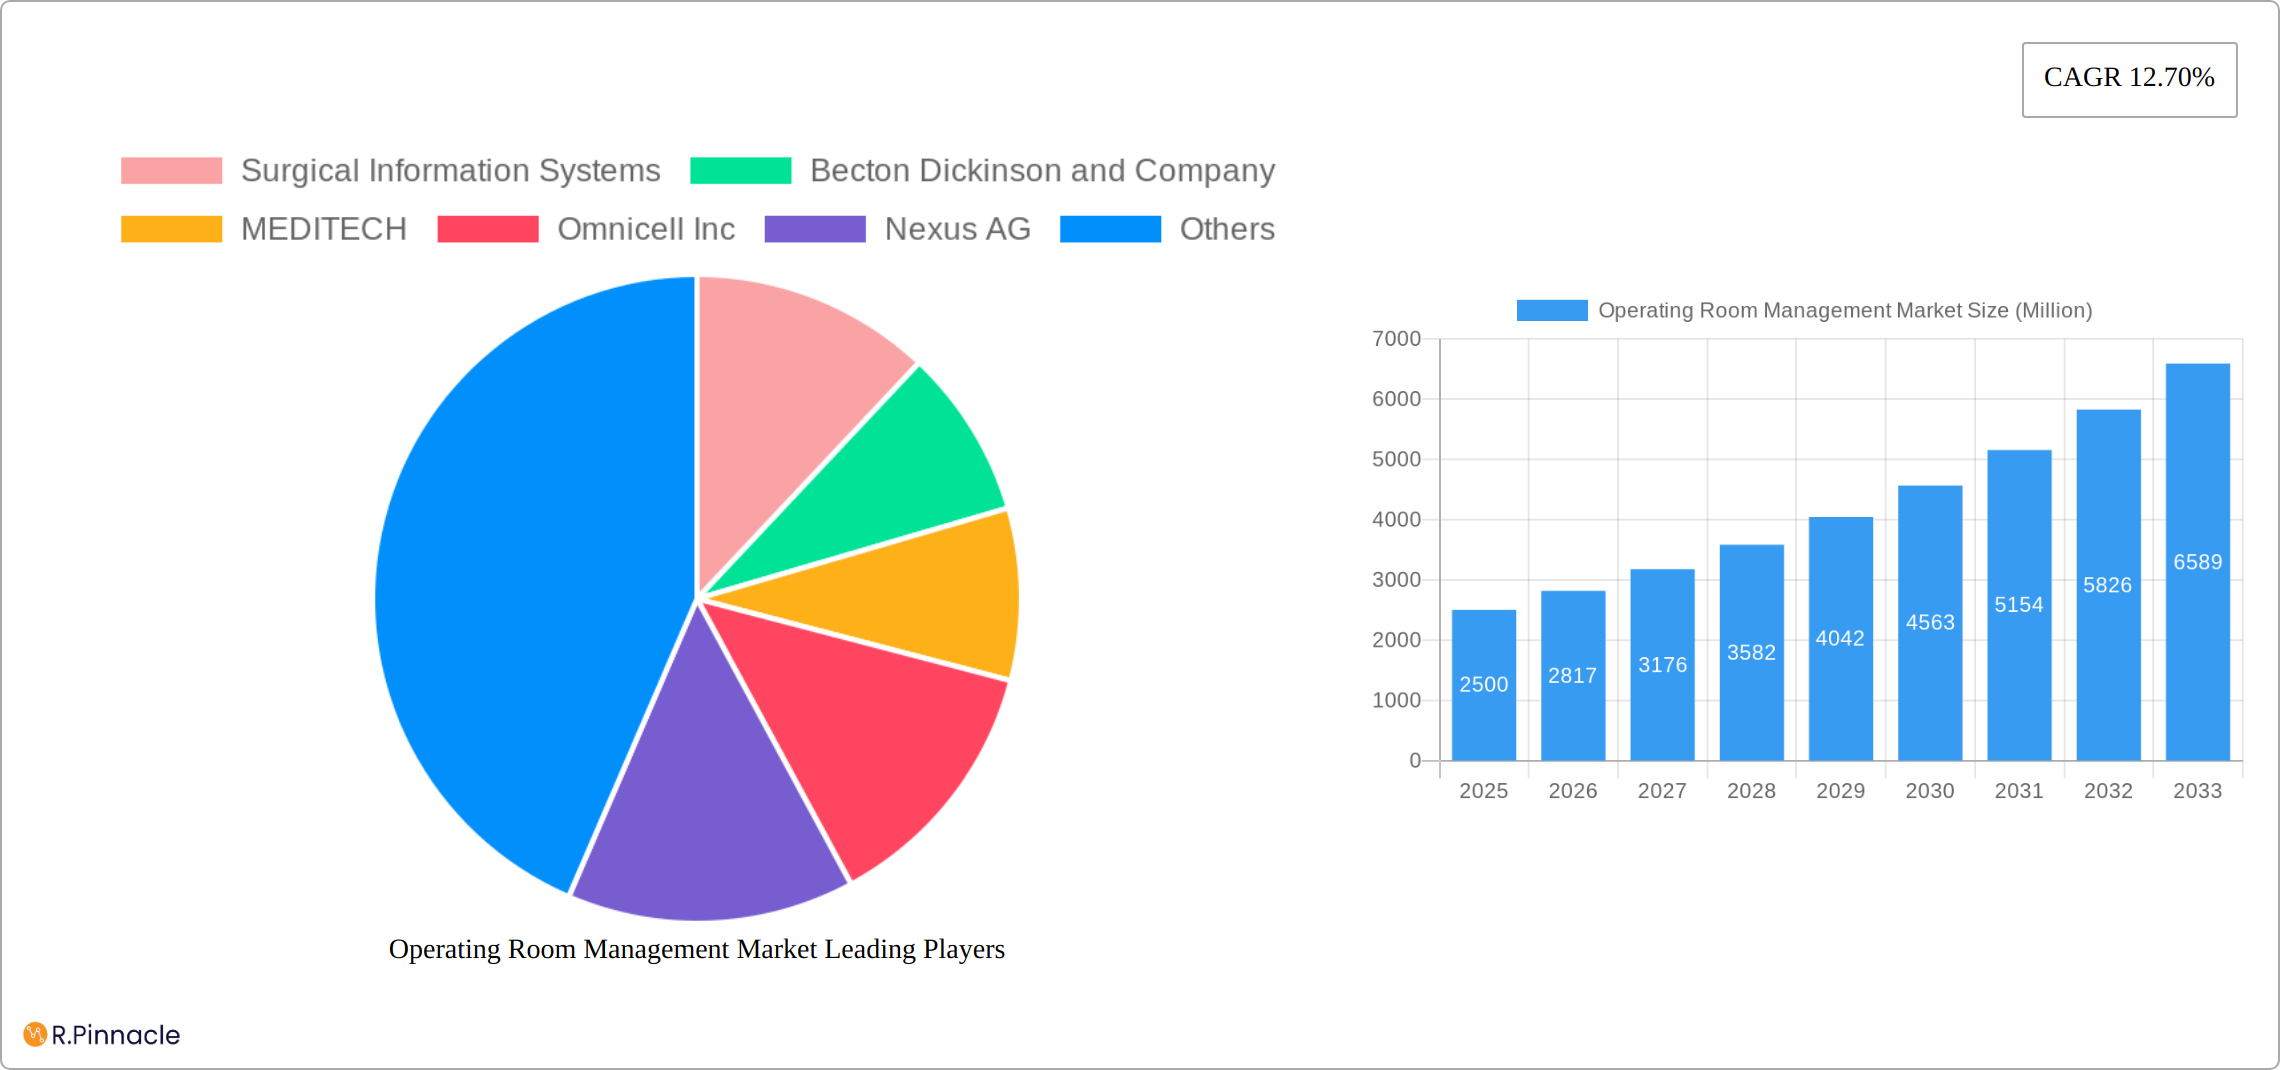
The Operating Room (OR) Management market is poised for substantial growth, driven by the imperative to enhance surgical efficiency, reduce operational costs, and elevate patient outcomes. Projecting a Compound Annual Growth Rate (CAGR) of 12.5%, the market is anticipated to reach $4.05 billion by 2025. Key growth catalysts include the escalating adoption of Electronic Health Records (EHRs) for integrated data management, the increasing preference for scalable and accessible cloud-based OR management solutions, and the growing demand for advanced analytics to optimize OR utilization and resource allocation. The market is segmented by component (software, services), solution type (data management, anesthesia information management, supply management, scheduling, performance management), delivery mode (on-premise, cloud-based), and end-user (hospitals, ambulatory surgery centers). This expansion is further supported by the global rise in surgical procedures and a heightened focus on minimizing surgical delays and improving patient flow.
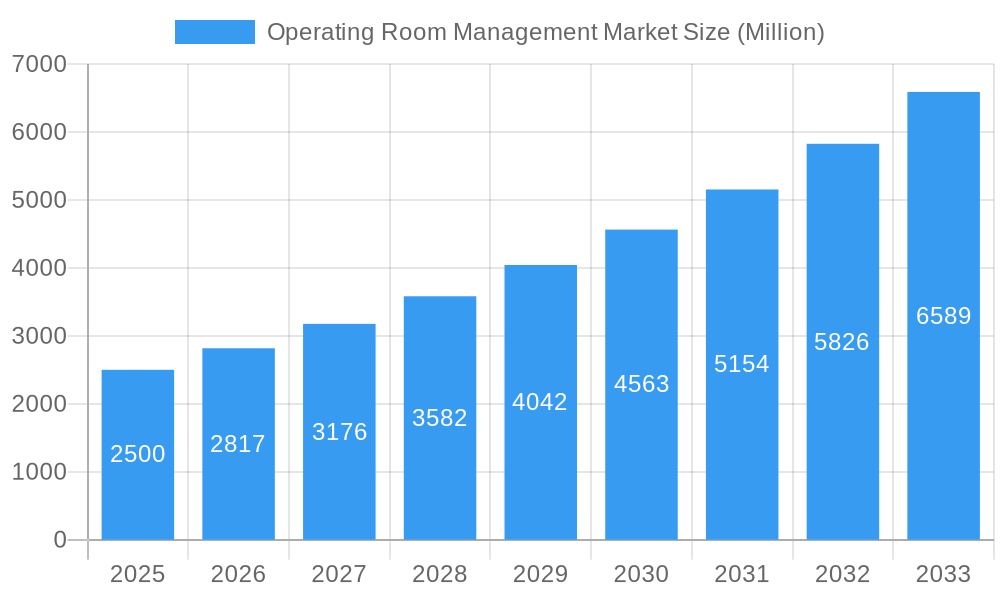
Operating Room Management Market Market Size (In Billion)
North America currently dominates the market, attributed to its advanced healthcare infrastructure and early adoption of cutting-edge technologies. Nevertheless, the Asia-Pacific region is projected to experience robust expansion, propelled by increasing healthcare investments and the modernization of healthcare facilities. The competitive environment features a dynamic mix of established market leaders and innovative technology providers, fostering continuous advancements and the introduction of novel solutions. Software solutions are increasingly favored for their ability to streamline workflows, enhance decision-making, and foster improved communication among surgical teams. The trend towards cloud-based OR management solutions is a significant development, offering greater flexibility and cost-efficiency over traditional on-premise deployments. While data security and integration challenges may present some market restraints, the overall outlook for the OR Management market remains highly positive, indicating significant opportunities for expansion and innovation.
Operating Room Management Market Company Market Share
Operating Room Management Market: A Comprehensive Report (2019-2033)
This comprehensive report provides a detailed analysis of the Operating Room Management Market, offering actionable insights for industry professionals and strategic decision-makers. The study period spans from 2019 to 2033, with 2025 serving as the base and estimated year. The report covers market segmentation by component (Software, Services), solution (Data Management & Communication, Anesthesia Information Management System, Operating Room Supply Management, Operating Room Scheduling, Performance Management, Other Solutions), delivery mode (On-premise, Cloud-based), and end-user (Hospital, Ambulatory Surgery Center, Other). Key players analyzed include Surgical Information Systems, Becton Dickinson and Company, MEDITECH, Omnicell Inc, Nexus AG, Altera Digital Health Inc, Getinge AB, Cerner Corporation, Optum Inc, Picis Clinical Solutions, Steris PLC, and McKesson Corporation. The market is projected to reach xx Million by 2033, exhibiting a CAGR of xx% during the forecast period (2025-2033).
Operating Room Management Market Structure & Innovation Trends
The Operating Room Management market exhibits a moderately concentrated structure, with a few major players holding significant market share. The market share of the top 5 players is estimated to be approximately xx%. Innovation is driven by advancements in AI, machine learning, and cloud computing, leading to improved efficiency, data analysis, and patient safety. Regulatory frameworks, such as HIPAA and GDPR, significantly impact data security and privacy practices. Product substitutes include manual processes and legacy systems, but these are gradually being replaced by more efficient digital solutions. The end-user demographic is primarily composed of hospitals and ambulatory surgery centers, with a growing adoption rate among smaller clinics. M&A activities have played a significant role in shaping market dynamics, with several large acquisitions recorded in recent years, with total deal values exceeding xx Million in the last five years. Specific examples of such activities include:
- Increased focus on strategic partnerships and collaborations to expand product offerings and market reach.
- High investment in R&D to develop innovative solutions and enhance existing products.
- Growing demand for cloud-based solutions is driving market consolidation and partnerships.
Operating Room Management Market Dynamics & Trends
The Operating Room Management market is experiencing robust growth fueled by several factors. The increasing volume of surgical procedures, coupled with the need for enhanced efficiency and reduced costs, is driving demand for advanced management solutions. Technological advancements, particularly in AI and data analytics, are enabling better resource allocation, improved surgical outcomes, and reduced errors. The shift towards value-based care is further influencing the adoption of these solutions, as healthcare providers seek to optimize resource utilization and improve patient satisfaction. Furthermore, consumer preferences are shifting towards more user-friendly and integrated systems that enhance collaboration among surgical teams. Competitive dynamics are characterized by both organic growth and acquisitions, with major players focusing on expanding their product portfolios and market reach through strategic partnerships and technological advancements. The market is projected to grow at a CAGR of xx% during the forecast period (2025-2033), driven primarily by the adoption of cloud-based solutions and an increasing preference for integrated platforms. Market penetration of cloud-based solutions is estimated at xx% in 2025, projected to reach xx% by 2033.
Dominant Regions & Segments in Operating Room Management Market
North America currently holds the largest market share, followed by Europe and Asia-Pacific. Key drivers for this dominance include robust healthcare infrastructure, high technological adoption rates, and substantial investments in healthcare IT.
Key Drivers by Region:
- North America: High healthcare expenditure, stringent regulatory frameworks driving adoption of advanced technologies, and a large number of hospitals and ambulatory surgery centers.
- Europe: Growing adoption of electronic health records (EHRs), increasing focus on improving healthcare efficiency, and supportive government initiatives.
- Asia-Pacific: Rapid economic growth, rising healthcare expenditure, and a growing number of hospitals and surgical centers.
Dominant Segments:
- Component: Software solutions are dominating the market, owing to their ability to automate processes, enhance communication, and improve data analysis.
- Solution: Data Management and Communication solutions hold a significant market share due to the increasing need for efficient data management and seamless communication among surgical teams.
- Delivery Mode: Cloud-based solutions are experiencing rapid growth due to their scalability, cost-effectiveness, and accessibility.
- End-User: Hospitals represent the largest segment due to the high volume of surgical procedures performed and the need for advanced management systems.
Detailed dominance analysis reveals that the North American hospital segment using cloud-based software solutions is experiencing the most significant growth.
Operating Room Management Market Product Innovations
Recent product innovations focus on integrating AI and machine learning to optimize resource allocation, predict surgical needs, and enhance surgical workflow. Several companies are launching cloud-based platforms for enhanced collaboration and data accessibility. These innovations provide competitive advantages by improving efficiency, reducing costs, and enhancing patient safety. The market trend is towards integrated, user-friendly solutions that cater to the evolving needs of healthcare providers.
Report Scope & Segmentation Analysis
This comprehensive report meticulously segments the Operating Room Management market, offering granular insights into key areas. The segmentation is based on:
- Component: Differentiating between Software and Services, highlighting their respective market contributions and growth trajectories.
- Solution: A detailed breakdown including Data Management and Communication Solution, Anesthesia Information Management System, Operating Room Supply Management Solution, Operating Room Scheduling Solution, Performance Management Solution, and Other niche solutions, analyzing their individual market penetration and potential.
- Delivery Mode: Examining the market share and adoption rates of On-premise Solutions versus the rapidly expanding Cloud-based Solutions.
- End-User: Categorizing the market by Hospital, Ambulatory Surgery Center, and Other End Users to understand diverse adoption patterns.
Key Drivers of Operating Room Management Market Growth
The growth of the Operating Room Management market is driven by several key factors. Firstly, the increasing volume of surgical procedures worldwide fuels the demand for efficient management solutions. Secondly, the technological advancements in AI, machine learning, and cloud computing are transforming operating room workflows and improving surgical outcomes. Finally, regulatory pressures and the shift towards value-based healthcare are driving adoption of these solutions as healthcare providers seek to optimize efficiency and reduce costs.
Challenges in the Operating Room Management Market Sector
The Operating Room Management market, while experiencing robust growth, is not without its hurdles. Key challenges include:
- High Implementation and Maintenance Costs: The initial investment and ongoing operational expenses associated with sophisticated OR management systems can be a significant deterrent, particularly for smaller healthcare facilities with limited budgets.
- Data Security and Privacy Concerns: The handling of highly sensitive patient health information (PHI) necessitates stringent data security and privacy protocols. Ensuring compliance with regulations like HIPAA and GDPR is paramount and can be complex.
- Integration Complexity: Seamlessly integrating new OR management systems with existing, often disparate, healthcare IT infrastructure (EHR, PACS, etc.) presents a substantial technical challenge, often requiring specialized expertise and considerable time.
- Vendor Competition and Innovation Pressure: The competitive landscape is dynamic, leading to price pressures and the constant need for vendors to innovate and differentiate their offerings to maintain market relevance and capture market share.
- Resistance to Change and Workforce Training: The successful adoption of new technologies hinges on overcoming user resistance and providing comprehensive training to surgical staff and administrators, which can be resource-intensive.
Emerging Opportunities in Operating Room Management Market
The Operating Room Management market is ripe with emerging opportunities driven by technological advancements and evolving healthcare paradigms:
- Telehealth and Remote Patient Monitoring Integration: As telehealth and remote monitoring become more prevalent, there's a growing demand for OR management solutions that can seamlessly integrate with these platforms, facilitating continuous patient care and post-operative management.
- Precision Medicine and Advanced Data Analytics: The shift towards precision medicine and personalized healthcare necessitates sophisticated data analytics capabilities. OR management systems that can collect, analyze, and leverage vast amounts of surgical data for improved decision-making and outcome prediction are highly sought after.
- Robotic Surgery and Minimally Invasive Procedures: The increasing adoption of robotic surgery and minimally invasive techniques requires advanced OR management systems capable of supporting these complex procedures, managing specialized equipment, and optimizing workflow for these innovative approaches.
- AI and Machine Learning Applications: The integration of Artificial Intelligence (AI) and Machine Learning (ML) offers transformative potential. Opportunities exist in AI-powered predictive analytics for scheduling, resource allocation, risk assessment, and even real-time intraoperative guidance.
- Interoperability and Standardization: The development of more interoperable systems and industry-wide standardization will unlock new opportunities by enabling smoother data exchange between different healthcare IT components and facilitating easier adoption of new solutions.
Leading Players in the Operating Room Management Market Market
Key Developments in Operating Room Management Market Industry
- June 2022: Proximie secured USD 80 Million in Series C funding to develop its operating room platform for connected surgical care. This signifies the substantial investment in innovative technologies for enhanced operating room management.
- March 2022: Medtronic partnered with Vizient to integrate its AI-powered surgical video management platform into Vizient's offerings. This collaboration expands the reach of AI-driven surgical solutions within the market.
Future Outlook for Operating Room Management Market Market
The future outlook for the Operating Room Management market is exceptionally robust and optimistic, underpinned by several powerful growth drivers. Continued technological advancements, a persistent increase in the volume and complexity of surgical procedures globally, and an unwavering focus on enhancing healthcare efficiency and patient outcomes are collectively propelling the market forward.
Strategic opportunities abound for vendors and healthcare providers alike. The development and adoption of innovative solutions that adeptly leverage advanced technologies such as Artificial Intelligence (AI), Machine Learning (ML), and cloud computing will be critical. These technologies offer immense potential to significantly improve surgical outcomes, foster enhanced collaboration and communication among surgical teams, and contribute to substantial reductions in healthcare costs.
The market is strategically positioned for significant and sustained growth. This expansion will likely be fueled by a combination of organic market growth, driven by increasing demand, and strategic mergers and acquisitions (M&A) as larger players seek to consolidate their positions or acquire innovative capabilities. This dynamic environment will undoubtedly create lucrative prospects and attractive investment opportunities for both established, market-leading companies and agile, emerging players poised to disrupt the status quo.
Operating Room Management Market Segmentation
-
1. Component
- 1.1. Software
- 1.2. Services
-
2. Solution
- 2.1. Data Management and Communication Solution
- 2.2. Anesthesia Information Management System
- 2.3. Operating Room Supply Management Solution
- 2.4. Operating Room Scheduling Solution
- 2.5. Performance Management Solution
- 2.6. Other Solutions
-
3. Delivery Mode
- 3.1. On-premise Solution
- 3.2. Cloud-based Solution
-
4. End User
- 4.1. Hospital
- 4.2. Ambulatory Surgery Center
- 4.3. Other End Users
Operating Room Management Market Segmentation By Geography
-
1. North America
- 1.1. United States
- 1.2. Canada
- 1.3. Mexico
-
2. Europe
- 2.1. Germany
- 2.2. United Kingdom
- 2.3. France
- 2.4. Italy
- 2.5. Spain
- 2.6. Rest of Europe
-
3. Asia Pacific
- 3.1. China
- 3.2. Japan
- 3.3. India
- 3.4. Australia
- 3.5. South Korea
- 3.6. Rest of Asia Pacific
-
4. Middle East and Africa
- 4.1. GCC
- 4.2. South Africa
- 4.3. Rest of Middle East and Africa
-
5. South America
- 5.1. Brazil
- 5.2. Argentina
- 5.3. Rest of South America
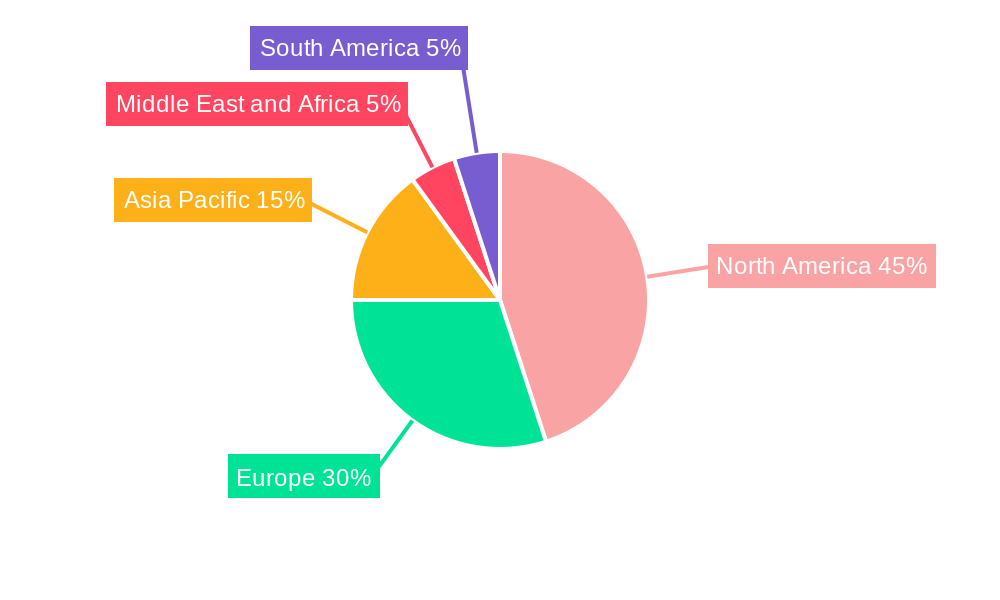
Operating Room Management Market Regional Market Share
Geographic Coverage of Operating Room Management Market
Operating Room Management Market REPORT HIGHLIGHTS
| Aspects | Details |
|---|---|
| Study Period | 2020-2034 |
| Base Year | 2025 |
| Estimated Year | 2026 |
| Forecast Period | 2026-2034 |
| Historical Period | 2020-2025 |
| Growth Rate | CAGR of 12.5% from 2020-2034 |
| Segmentation |
|
Table of Contents
- 1. Introduction
- 1.1. Research Scope
- 1.2. Market Segmentation
- 1.3. Research Methodology
- 1.4. Definitions and Assumptions
- 2. Executive Summary
- 2.1. Introduction
- 3. Market Dynamics
- 3.1. Introduction
- 3.2. Market Drivers
- 3.2.1. Requirement for Efficient Improvement in the Operating Room (OR); Emphasis on the Reduction of Cost in the OR; Increasing Number of Surgical Procedures
- 3.3. Market Restrains
- 3.3.1. High Setup Cost for Patient Engagement Solutions
- 3.4. Market Trends
- 3.4.1. Software Segment holds a Major Share in the Operating Room Management Market
- 4. Market Factor Analysis
- 4.1. Porters Five Forces
- 4.2. Supply/Value Chain
- 4.3. PESTEL analysis
- 4.4. Market Entropy
- 4.5. Patent/Trademark Analysis
- 5. Global Operating Room Management Market Analysis, Insights and Forecast, 2020-2032
- 5.1. Market Analysis, Insights and Forecast - by Component
- 5.1.1. Software
- 5.1.2. Services
- 5.2. Market Analysis, Insights and Forecast - by Solution
- 5.2.1. Data Management and Communication Solution
- 5.2.2. Anesthesia Information Management System
- 5.2.3. Operating Room Supply Management Solution
- 5.2.4. Operating Room Scheduling Solution
- 5.2.5. Performance Management Solution
- 5.2.6. Other Solutions
- 5.3. Market Analysis, Insights and Forecast - by Delivery Mode
- 5.3.1. On-premise Solution
- 5.3.2. Cloud-based Solution
- 5.4. Market Analysis, Insights and Forecast - by End User
- 5.4.1. Hospital
- 5.4.2. Ambulatory Surgery Center
- 5.4.3. Other End Users
- 5.5. Market Analysis, Insights and Forecast - by Region
- 5.5.1. North America
- 5.5.2. Europe
- 5.5.3. Asia Pacific
- 5.5.4. Middle East and Africa
- 5.5.5. South America
- 5.1. Market Analysis, Insights and Forecast - by Component
- 6. North America Operating Room Management Market Analysis, Insights and Forecast, 2020-2032
- 6.1. Market Analysis, Insights and Forecast - by Component
- 6.1.1. Software
- 6.1.2. Services
- 6.2. Market Analysis, Insights and Forecast - by Solution
- 6.2.1. Data Management and Communication Solution
- 6.2.2. Anesthesia Information Management System
- 6.2.3. Operating Room Supply Management Solution
- 6.2.4. Operating Room Scheduling Solution
- 6.2.5. Performance Management Solution
- 6.2.6. Other Solutions
- 6.3. Market Analysis, Insights and Forecast - by Delivery Mode
- 6.3.1. On-premise Solution
- 6.3.2. Cloud-based Solution
- 6.4. Market Analysis, Insights and Forecast - by End User
- 6.4.1. Hospital
- 6.4.2. Ambulatory Surgery Center
- 6.4.3. Other End Users
- 6.1. Market Analysis, Insights and Forecast - by Component
- 7. Europe Operating Room Management Market Analysis, Insights and Forecast, 2020-2032
- 7.1. Market Analysis, Insights and Forecast - by Component
- 7.1.1. Software
- 7.1.2. Services
- 7.2. Market Analysis, Insights and Forecast - by Solution
- 7.2.1. Data Management and Communication Solution
- 7.2.2. Anesthesia Information Management System
- 7.2.3. Operating Room Supply Management Solution
- 7.2.4. Operating Room Scheduling Solution
- 7.2.5. Performance Management Solution
- 7.2.6. Other Solutions
- 7.3. Market Analysis, Insights and Forecast - by Delivery Mode
- 7.3.1. On-premise Solution
- 7.3.2. Cloud-based Solution
- 7.4. Market Analysis, Insights and Forecast - by End User
- 7.4.1. Hospital
- 7.4.2. Ambulatory Surgery Center
- 7.4.3. Other End Users
- 7.1. Market Analysis, Insights and Forecast - by Component
- 8. Asia Pacific Operating Room Management Market Analysis, Insights and Forecast, 2020-2032
- 8.1. Market Analysis, Insights and Forecast - by Component
- 8.1.1. Software
- 8.1.2. Services
- 8.2. Market Analysis, Insights and Forecast - by Solution
- 8.2.1. Data Management and Communication Solution
- 8.2.2. Anesthesia Information Management System
- 8.2.3. Operating Room Supply Management Solution
- 8.2.4. Operating Room Scheduling Solution
- 8.2.5. Performance Management Solution
- 8.2.6. Other Solutions
- 8.3. Market Analysis, Insights and Forecast - by Delivery Mode
- 8.3.1. On-premise Solution
- 8.3.2. Cloud-based Solution
- 8.4. Market Analysis, Insights and Forecast - by End User
- 8.4.1. Hospital
- 8.4.2. Ambulatory Surgery Center
- 8.4.3. Other End Users
- 8.1. Market Analysis, Insights and Forecast - by Component
- 9. Middle East and Africa Operating Room Management Market Analysis, Insights and Forecast, 2020-2032
- 9.1. Market Analysis, Insights and Forecast - by Component
- 9.1.1. Software
- 9.1.2. Services
- 9.2. Market Analysis, Insights and Forecast - by Solution
- 9.2.1. Data Management and Communication Solution
- 9.2.2. Anesthesia Information Management System
- 9.2.3. Operating Room Supply Management Solution
- 9.2.4. Operating Room Scheduling Solution
- 9.2.5. Performance Management Solution
- 9.2.6. Other Solutions
- 9.3. Market Analysis, Insights and Forecast - by Delivery Mode
- 9.3.1. On-premise Solution
- 9.3.2. Cloud-based Solution
- 9.4. Market Analysis, Insights and Forecast - by End User
- 9.4.1. Hospital
- 9.4.2. Ambulatory Surgery Center
- 9.4.3. Other End Users
- 9.1. Market Analysis, Insights and Forecast - by Component
- 10. South America Operating Room Management Market Analysis, Insights and Forecast, 2020-2032
- 10.1. Market Analysis, Insights and Forecast - by Component
- 10.1.1. Software
- 10.1.2. Services
- 10.2. Market Analysis, Insights and Forecast - by Solution
- 10.2.1. Data Management and Communication Solution
- 10.2.2. Anesthesia Information Management System
- 10.2.3. Operating Room Supply Management Solution
- 10.2.4. Operating Room Scheduling Solution
- 10.2.5. Performance Management Solution
- 10.2.6. Other Solutions
- 10.3. Market Analysis, Insights and Forecast - by Delivery Mode
- 10.3.1. On-premise Solution
- 10.3.2. Cloud-based Solution
- 10.4. Market Analysis, Insights and Forecast - by End User
- 10.4.1. Hospital
- 10.4.2. Ambulatory Surgery Center
- 10.4.3. Other End Users
- 10.1. Market Analysis, Insights and Forecast - by Component
- 11. Competitive Analysis
- 11.1. Global Market Share Analysis 2025
- 11.2. Company Profiles
- 11.2.1 Surgical Information Systems
- 11.2.1.1. Overview
- 11.2.1.2. Products
- 11.2.1.3. SWOT Analysis
- 11.2.1.4. Recent Developments
- 11.2.1.5. Financials (Based on Availability)
- 11.2.2 Becton Dickinson and Company
- 11.2.2.1. Overview
- 11.2.2.2. Products
- 11.2.2.3. SWOT Analysis
- 11.2.2.4. Recent Developments
- 11.2.2.5. Financials (Based on Availability)
- 11.2.3 MEDITECH
- 11.2.3.1. Overview
- 11.2.3.2. Products
- 11.2.3.3. SWOT Analysis
- 11.2.3.4. Recent Developments
- 11.2.3.5. Financials (Based on Availability)
- 11.2.4 Omnicell Inc
- 11.2.4.1. Overview
- 11.2.4.2. Products
- 11.2.4.3. SWOT Analysis
- 11.2.4.4. Recent Developments
- 11.2.4.5. Financials (Based on Availability)
- 11.2.5 Nexus AG
- 11.2.5.1. Overview
- 11.2.5.2. Products
- 11.2.5.3. SWOT Analysis
- 11.2.5.4. Recent Developments
- 11.2.5.5. Financials (Based on Availability)
- 11.2.6 Altera Digital Health Inc
- 11.2.6.1. Overview
- 11.2.6.2. Products
- 11.2.6.3. SWOT Analysis
- 11.2.6.4. Recent Developments
- 11.2.6.5. Financials (Based on Availability)
- 11.2.7 Getinge AB
- 11.2.7.1. Overview
- 11.2.7.2. Products
- 11.2.7.3. SWOT Analysis
- 11.2.7.4. Recent Developments
- 11.2.7.5. Financials (Based on Availability)
- 11.2.8 Cerner Corporation
- 11.2.8.1. Overview
- 11.2.8.2. Products
- 11.2.8.3. SWOT Analysis
- 11.2.8.4. Recent Developments
- 11.2.8.5. Financials (Based on Availability)
- 11.2.9 Optum Inc
- 11.2.9.1. Overview
- 11.2.9.2. Products
- 11.2.9.3. SWOT Analysis
- 11.2.9.4. Recent Developments
- 11.2.9.5. Financials (Based on Availability)
- 11.2.10 Picis Clinical Solutions
- 11.2.10.1. Overview
- 11.2.10.2. Products
- 11.2.10.3. SWOT Analysis
- 11.2.10.4. Recent Developments
- 11.2.10.5. Financials (Based on Availability)
- 11.2.11 Steris PLC
- 11.2.11.1. Overview
- 11.2.11.2. Products
- 11.2.11.3. SWOT Analysis
- 11.2.11.4. Recent Developments
- 11.2.11.5. Financials (Based on Availability)
- 11.2.12 McKesson Corporation
- 11.2.12.1. Overview
- 11.2.12.2. Products
- 11.2.12.3. SWOT Analysis
- 11.2.12.4. Recent Developments
- 11.2.12.5. Financials (Based on Availability)
- 11.2.1 Surgical Information Systems
List of Figures
- Figure 1: Global Operating Room Management Market Revenue Breakdown (billion, %) by Region 2025 & 2033
- Figure 2: Global Operating Room Management Market Volume Breakdown (K Unit, %) by Region 2025 & 2033
- Figure 3: North America Operating Room Management Market Revenue (billion), by Component 2025 & 2033
- Figure 4: North America Operating Room Management Market Volume (K Unit), by Component 2025 & 2033
- Figure 5: North America Operating Room Management Market Revenue Share (%), by Component 2025 & 2033
- Figure 6: North America Operating Room Management Market Volume Share (%), by Component 2025 & 2033
- Figure 7: North America Operating Room Management Market Revenue (billion), by Solution 2025 & 2033
- Figure 8: North America Operating Room Management Market Volume (K Unit), by Solution 2025 & 2033
- Figure 9: North America Operating Room Management Market Revenue Share (%), by Solution 2025 & 2033
- Figure 10: North America Operating Room Management Market Volume Share (%), by Solution 2025 & 2033
- Figure 11: North America Operating Room Management Market Revenue (billion), by Delivery Mode 2025 & 2033
- Figure 12: North America Operating Room Management Market Volume (K Unit), by Delivery Mode 2025 & 2033
- Figure 13: North America Operating Room Management Market Revenue Share (%), by Delivery Mode 2025 & 2033
- Figure 14: North America Operating Room Management Market Volume Share (%), by Delivery Mode 2025 & 2033
- Figure 15: North America Operating Room Management Market Revenue (billion), by End User 2025 & 2033
- Figure 16: North America Operating Room Management Market Volume (K Unit), by End User 2025 & 2033
- Figure 17: North America Operating Room Management Market Revenue Share (%), by End User 2025 & 2033
- Figure 18: North America Operating Room Management Market Volume Share (%), by End User 2025 & 2033
- Figure 19: North America Operating Room Management Market Revenue (billion), by Country 2025 & 2033
- Figure 20: North America Operating Room Management Market Volume (K Unit), by Country 2025 & 2033
- Figure 21: North America Operating Room Management Market Revenue Share (%), by Country 2025 & 2033
- Figure 22: North America Operating Room Management Market Volume Share (%), by Country 2025 & 2033
- Figure 23: Europe Operating Room Management Market Revenue (billion), by Component 2025 & 2033
- Figure 24: Europe Operating Room Management Market Volume (K Unit), by Component 2025 & 2033
- Figure 25: Europe Operating Room Management Market Revenue Share (%), by Component 2025 & 2033
- Figure 26: Europe Operating Room Management Market Volume Share (%), by Component 2025 & 2033
- Figure 27: Europe Operating Room Management Market Revenue (billion), by Solution 2025 & 2033
- Figure 28: Europe Operating Room Management Market Volume (K Unit), by Solution 2025 & 2033
- Figure 29: Europe Operating Room Management Market Revenue Share (%), by Solution 2025 & 2033
- Figure 30: Europe Operating Room Management Market Volume Share (%), by Solution 2025 & 2033
- Figure 31: Europe Operating Room Management Market Revenue (billion), by Delivery Mode 2025 & 2033
- Figure 32: Europe Operating Room Management Market Volume (K Unit), by Delivery Mode 2025 & 2033
- Figure 33: Europe Operating Room Management Market Revenue Share (%), by Delivery Mode 2025 & 2033
- Figure 34: Europe Operating Room Management Market Volume Share (%), by Delivery Mode 2025 & 2033
- Figure 35: Europe Operating Room Management Market Revenue (billion), by End User 2025 & 2033
- Figure 36: Europe Operating Room Management Market Volume (K Unit), by End User 2025 & 2033
- Figure 37: Europe Operating Room Management Market Revenue Share (%), by End User 2025 & 2033
- Figure 38: Europe Operating Room Management Market Volume Share (%), by End User 2025 & 2033
- Figure 39: Europe Operating Room Management Market Revenue (billion), by Country 2025 & 2033
- Figure 40: Europe Operating Room Management Market Volume (K Unit), by Country 2025 & 2033
- Figure 41: Europe Operating Room Management Market Revenue Share (%), by Country 2025 & 2033
- Figure 42: Europe Operating Room Management Market Volume Share (%), by Country 2025 & 2033
- Figure 43: Asia Pacific Operating Room Management Market Revenue (billion), by Component 2025 & 2033
- Figure 44: Asia Pacific Operating Room Management Market Volume (K Unit), by Component 2025 & 2033
- Figure 45: Asia Pacific Operating Room Management Market Revenue Share (%), by Component 2025 & 2033
- Figure 46: Asia Pacific Operating Room Management Market Volume Share (%), by Component 2025 & 2033
- Figure 47: Asia Pacific Operating Room Management Market Revenue (billion), by Solution 2025 & 2033
- Figure 48: Asia Pacific Operating Room Management Market Volume (K Unit), by Solution 2025 & 2033
- Figure 49: Asia Pacific Operating Room Management Market Revenue Share (%), by Solution 2025 & 2033
- Figure 50: Asia Pacific Operating Room Management Market Volume Share (%), by Solution 2025 & 2033
- Figure 51: Asia Pacific Operating Room Management Market Revenue (billion), by Delivery Mode 2025 & 2033
- Figure 52: Asia Pacific Operating Room Management Market Volume (K Unit), by Delivery Mode 2025 & 2033
- Figure 53: Asia Pacific Operating Room Management Market Revenue Share (%), by Delivery Mode 2025 & 2033
- Figure 54: Asia Pacific Operating Room Management Market Volume Share (%), by Delivery Mode 2025 & 2033
- Figure 55: Asia Pacific Operating Room Management Market Revenue (billion), by End User 2025 & 2033
- Figure 56: Asia Pacific Operating Room Management Market Volume (K Unit), by End User 2025 & 2033
- Figure 57: Asia Pacific Operating Room Management Market Revenue Share (%), by End User 2025 & 2033
- Figure 58: Asia Pacific Operating Room Management Market Volume Share (%), by End User 2025 & 2033
- Figure 59: Asia Pacific Operating Room Management Market Revenue (billion), by Country 2025 & 2033
- Figure 60: Asia Pacific Operating Room Management Market Volume (K Unit), by Country 2025 & 2033
- Figure 61: Asia Pacific Operating Room Management Market Revenue Share (%), by Country 2025 & 2033
- Figure 62: Asia Pacific Operating Room Management Market Volume Share (%), by Country 2025 & 2033
- Figure 63: Middle East and Africa Operating Room Management Market Revenue (billion), by Component 2025 & 2033
- Figure 64: Middle East and Africa Operating Room Management Market Volume (K Unit), by Component 2025 & 2033
- Figure 65: Middle East and Africa Operating Room Management Market Revenue Share (%), by Component 2025 & 2033
- Figure 66: Middle East and Africa Operating Room Management Market Volume Share (%), by Component 2025 & 2033
- Figure 67: Middle East and Africa Operating Room Management Market Revenue (billion), by Solution 2025 & 2033
- Figure 68: Middle East and Africa Operating Room Management Market Volume (K Unit), by Solution 2025 & 2033
- Figure 69: Middle East and Africa Operating Room Management Market Revenue Share (%), by Solution 2025 & 2033
- Figure 70: Middle East and Africa Operating Room Management Market Volume Share (%), by Solution 2025 & 2033
- Figure 71: Middle East and Africa Operating Room Management Market Revenue (billion), by Delivery Mode 2025 & 2033
- Figure 72: Middle East and Africa Operating Room Management Market Volume (K Unit), by Delivery Mode 2025 & 2033
- Figure 73: Middle East and Africa Operating Room Management Market Revenue Share (%), by Delivery Mode 2025 & 2033
- Figure 74: Middle East and Africa Operating Room Management Market Volume Share (%), by Delivery Mode 2025 & 2033
- Figure 75: Middle East and Africa Operating Room Management Market Revenue (billion), by End User 2025 & 2033
- Figure 76: Middle East and Africa Operating Room Management Market Volume (K Unit), by End User 2025 & 2033
- Figure 77: Middle East and Africa Operating Room Management Market Revenue Share (%), by End User 2025 & 2033
- Figure 78: Middle East and Africa Operating Room Management Market Volume Share (%), by End User 2025 & 2033
- Figure 79: Middle East and Africa Operating Room Management Market Revenue (billion), by Country 2025 & 2033
- Figure 80: Middle East and Africa Operating Room Management Market Volume (K Unit), by Country 2025 & 2033
- Figure 81: Middle East and Africa Operating Room Management Market Revenue Share (%), by Country 2025 & 2033
- Figure 82: Middle East and Africa Operating Room Management Market Volume Share (%), by Country 2025 & 2033
- Figure 83: South America Operating Room Management Market Revenue (billion), by Component 2025 & 2033
- Figure 84: South America Operating Room Management Market Volume (K Unit), by Component 2025 & 2033
- Figure 85: South America Operating Room Management Market Revenue Share (%), by Component 2025 & 2033
- Figure 86: South America Operating Room Management Market Volume Share (%), by Component 2025 & 2033
- Figure 87: South America Operating Room Management Market Revenue (billion), by Solution 2025 & 2033
- Figure 88: South America Operating Room Management Market Volume (K Unit), by Solution 2025 & 2033
- Figure 89: South America Operating Room Management Market Revenue Share (%), by Solution 2025 & 2033
- Figure 90: South America Operating Room Management Market Volume Share (%), by Solution 2025 & 2033
- Figure 91: South America Operating Room Management Market Revenue (billion), by Delivery Mode 2025 & 2033
- Figure 92: South America Operating Room Management Market Volume (K Unit), by Delivery Mode 2025 & 2033
- Figure 93: South America Operating Room Management Market Revenue Share (%), by Delivery Mode 2025 & 2033
- Figure 94: South America Operating Room Management Market Volume Share (%), by Delivery Mode 2025 & 2033
- Figure 95: South America Operating Room Management Market Revenue (billion), by End User 2025 & 2033
- Figure 96: South America Operating Room Management Market Volume (K Unit), by End User 2025 & 2033
- Figure 97: South America Operating Room Management Market Revenue Share (%), by End User 2025 & 2033
- Figure 98: South America Operating Room Management Market Volume Share (%), by End User 2025 & 2033
- Figure 99: South America Operating Room Management Market Revenue (billion), by Country 2025 & 2033
- Figure 100: South America Operating Room Management Market Volume (K Unit), by Country 2025 & 2033
- Figure 101: South America Operating Room Management Market Revenue Share (%), by Country 2025 & 2033
- Figure 102: South America Operating Room Management Market Volume Share (%), by Country 2025 & 2033
List of Tables
- Table 1: Global Operating Room Management Market Revenue billion Forecast, by Component 2020 & 2033
- Table 2: Global Operating Room Management Market Volume K Unit Forecast, by Component 2020 & 2033
- Table 3: Global Operating Room Management Market Revenue billion Forecast, by Solution 2020 & 2033
- Table 4: Global Operating Room Management Market Volume K Unit Forecast, by Solution 2020 & 2033
- Table 5: Global Operating Room Management Market Revenue billion Forecast, by Delivery Mode 2020 & 2033
- Table 6: Global Operating Room Management Market Volume K Unit Forecast, by Delivery Mode 2020 & 2033
- Table 7: Global Operating Room Management Market Revenue billion Forecast, by End User 2020 & 2033
- Table 8: Global Operating Room Management Market Volume K Unit Forecast, by End User 2020 & 2033
- Table 9: Global Operating Room Management Market Revenue billion Forecast, by Region 2020 & 2033
- Table 10: Global Operating Room Management Market Volume K Unit Forecast, by Region 2020 & 2033
- Table 11: Global Operating Room Management Market Revenue billion Forecast, by Component 2020 & 2033
- Table 12: Global Operating Room Management Market Volume K Unit Forecast, by Component 2020 & 2033
- Table 13: Global Operating Room Management Market Revenue billion Forecast, by Solution 2020 & 2033
- Table 14: Global Operating Room Management Market Volume K Unit Forecast, by Solution 2020 & 2033
- Table 15: Global Operating Room Management Market Revenue billion Forecast, by Delivery Mode 2020 & 2033
- Table 16: Global Operating Room Management Market Volume K Unit Forecast, by Delivery Mode 2020 & 2033
- Table 17: Global Operating Room Management Market Revenue billion Forecast, by End User 2020 & 2033
- Table 18: Global Operating Room Management Market Volume K Unit Forecast, by End User 2020 & 2033
- Table 19: Global Operating Room Management Market Revenue billion Forecast, by Country 2020 & 2033
- Table 20: Global Operating Room Management Market Volume K Unit Forecast, by Country 2020 & 2033
- Table 21: United States Operating Room Management Market Revenue (billion) Forecast, by Application 2020 & 2033
- Table 22: United States Operating Room Management Market Volume (K Unit) Forecast, by Application 2020 & 2033
- Table 23: Canada Operating Room Management Market Revenue (billion) Forecast, by Application 2020 & 2033
- Table 24: Canada Operating Room Management Market Volume (K Unit) Forecast, by Application 2020 & 2033
- Table 25: Mexico Operating Room Management Market Revenue (billion) Forecast, by Application 2020 & 2033
- Table 26: Mexico Operating Room Management Market Volume (K Unit) Forecast, by Application 2020 & 2033
- Table 27: Global Operating Room Management Market Revenue billion Forecast, by Component 2020 & 2033
- Table 28: Global Operating Room Management Market Volume K Unit Forecast, by Component 2020 & 2033
- Table 29: Global Operating Room Management Market Revenue billion Forecast, by Solution 2020 & 2033
- Table 30: Global Operating Room Management Market Volume K Unit Forecast, by Solution 2020 & 2033
- Table 31: Global Operating Room Management Market Revenue billion Forecast, by Delivery Mode 2020 & 2033
- Table 32: Global Operating Room Management Market Volume K Unit Forecast, by Delivery Mode 2020 & 2033
- Table 33: Global Operating Room Management Market Revenue billion Forecast, by End User 2020 & 2033
- Table 34: Global Operating Room Management Market Volume K Unit Forecast, by End User 2020 & 2033
- Table 35: Global Operating Room Management Market Revenue billion Forecast, by Country 2020 & 2033
- Table 36: Global Operating Room Management Market Volume K Unit Forecast, by Country 2020 & 2033
- Table 37: Germany Operating Room Management Market Revenue (billion) Forecast, by Application 2020 & 2033
- Table 38: Germany Operating Room Management Market Volume (K Unit) Forecast, by Application 2020 & 2033
- Table 39: United Kingdom Operating Room Management Market Revenue (billion) Forecast, by Application 2020 & 2033
- Table 40: United Kingdom Operating Room Management Market Volume (K Unit) Forecast, by Application 2020 & 2033
- Table 41: France Operating Room Management Market Revenue (billion) Forecast, by Application 2020 & 2033
- Table 42: France Operating Room Management Market Volume (K Unit) Forecast, by Application 2020 & 2033
- Table 43: Italy Operating Room Management Market Revenue (billion) Forecast, by Application 2020 & 2033
- Table 44: Italy Operating Room Management Market Volume (K Unit) Forecast, by Application 2020 & 2033
- Table 45: Spain Operating Room Management Market Revenue (billion) Forecast, by Application 2020 & 2033
- Table 46: Spain Operating Room Management Market Volume (K Unit) Forecast, by Application 2020 & 2033
- Table 47: Rest of Europe Operating Room Management Market Revenue (billion) Forecast, by Application 2020 & 2033
- Table 48: Rest of Europe Operating Room Management Market Volume (K Unit) Forecast, by Application 2020 & 2033
- Table 49: Global Operating Room Management Market Revenue billion Forecast, by Component 2020 & 2033
- Table 50: Global Operating Room Management Market Volume K Unit Forecast, by Component 2020 & 2033
- Table 51: Global Operating Room Management Market Revenue billion Forecast, by Solution 2020 & 2033
- Table 52: Global Operating Room Management Market Volume K Unit Forecast, by Solution 2020 & 2033
- Table 53: Global Operating Room Management Market Revenue billion Forecast, by Delivery Mode 2020 & 2033
- Table 54: Global Operating Room Management Market Volume K Unit Forecast, by Delivery Mode 2020 & 2033
- Table 55: Global Operating Room Management Market Revenue billion Forecast, by End User 2020 & 2033
- Table 56: Global Operating Room Management Market Volume K Unit Forecast, by End User 2020 & 2033
- Table 57: Global Operating Room Management Market Revenue billion Forecast, by Country 2020 & 2033
- Table 58: Global Operating Room Management Market Volume K Unit Forecast, by Country 2020 & 2033
- Table 59: China Operating Room Management Market Revenue (billion) Forecast, by Application 2020 & 2033
- Table 60: China Operating Room Management Market Volume (K Unit) Forecast, by Application 2020 & 2033
- Table 61: Japan Operating Room Management Market Revenue (billion) Forecast, by Application 2020 & 2033
- Table 62: Japan Operating Room Management Market Volume (K Unit) Forecast, by Application 2020 & 2033
- Table 63: India Operating Room Management Market Revenue (billion) Forecast, by Application 2020 & 2033
- Table 64: India Operating Room Management Market Volume (K Unit) Forecast, by Application 2020 & 2033
- Table 65: Australia Operating Room Management Market Revenue (billion) Forecast, by Application 2020 & 2033
- Table 66: Australia Operating Room Management Market Volume (K Unit) Forecast, by Application 2020 & 2033
- Table 67: South Korea Operating Room Management Market Revenue (billion) Forecast, by Application 2020 & 2033
- Table 68: South Korea Operating Room Management Market Volume (K Unit) Forecast, by Application 2020 & 2033
- Table 69: Rest of Asia Pacific Operating Room Management Market Revenue (billion) Forecast, by Application 2020 & 2033
- Table 70: Rest of Asia Pacific Operating Room Management Market Volume (K Unit) Forecast, by Application 2020 & 2033
- Table 71: Global Operating Room Management Market Revenue billion Forecast, by Component 2020 & 2033
- Table 72: Global Operating Room Management Market Volume K Unit Forecast, by Component 2020 & 2033
- Table 73: Global Operating Room Management Market Revenue billion Forecast, by Solution 2020 & 2033
- Table 74: Global Operating Room Management Market Volume K Unit Forecast, by Solution 2020 & 2033
- Table 75: Global Operating Room Management Market Revenue billion Forecast, by Delivery Mode 2020 & 2033
- Table 76: Global Operating Room Management Market Volume K Unit Forecast, by Delivery Mode 2020 & 2033
- Table 77: Global Operating Room Management Market Revenue billion Forecast, by End User 2020 & 2033
- Table 78: Global Operating Room Management Market Volume K Unit Forecast, by End User 2020 & 2033
- Table 79: Global Operating Room Management Market Revenue billion Forecast, by Country 2020 & 2033
- Table 80: Global Operating Room Management Market Volume K Unit Forecast, by Country 2020 & 2033
- Table 81: GCC Operating Room Management Market Revenue (billion) Forecast, by Application 2020 & 2033
- Table 82: GCC Operating Room Management Market Volume (K Unit) Forecast, by Application 2020 & 2033
- Table 83: South Africa Operating Room Management Market Revenue (billion) Forecast, by Application 2020 & 2033
- Table 84: South Africa Operating Room Management Market Volume (K Unit) Forecast, by Application 2020 & 2033
- Table 85: Rest of Middle East and Africa Operating Room Management Market Revenue (billion) Forecast, by Application 2020 & 2033
- Table 86: Rest of Middle East and Africa Operating Room Management Market Volume (K Unit) Forecast, by Application 2020 & 2033
- Table 87: Global Operating Room Management Market Revenue billion Forecast, by Component 2020 & 2033
- Table 88: Global Operating Room Management Market Volume K Unit Forecast, by Component 2020 & 2033
- Table 89: Global Operating Room Management Market Revenue billion Forecast, by Solution 2020 & 2033
- Table 90: Global Operating Room Management Market Volume K Unit Forecast, by Solution 2020 & 2033
- Table 91: Global Operating Room Management Market Revenue billion Forecast, by Delivery Mode 2020 & 2033
- Table 92: Global Operating Room Management Market Volume K Unit Forecast, by Delivery Mode 2020 & 2033
- Table 93: Global Operating Room Management Market Revenue billion Forecast, by End User 2020 & 2033
- Table 94: Global Operating Room Management Market Volume K Unit Forecast, by End User 2020 & 2033
- Table 95: Global Operating Room Management Market Revenue billion Forecast, by Country 2020 & 2033
- Table 96: Global Operating Room Management Market Volume K Unit Forecast, by Country 2020 & 2033
- Table 97: Brazil Operating Room Management Market Revenue (billion) Forecast, by Application 2020 & 2033
- Table 98: Brazil Operating Room Management Market Volume (K Unit) Forecast, by Application 2020 & 2033
- Table 99: Argentina Operating Room Management Market Revenue (billion) Forecast, by Application 2020 & 2033
- Table 100: Argentina Operating Room Management Market Volume (K Unit) Forecast, by Application 2020 & 2033
- Table 101: Rest of South America Operating Room Management Market Revenue (billion) Forecast, by Application 2020 & 2033
- Table 102: Rest of South America Operating Room Management Market Volume (K Unit) Forecast, by Application 2020 & 2033
Frequently Asked Questions
1. What is the projected Compound Annual Growth Rate (CAGR) of the Operating Room Management Market?
The projected CAGR is approximately 12.5%.
2. Which companies are prominent players in the Operating Room Management Market?
Key companies in the market include Surgical Information Systems, Becton Dickinson and Company, MEDITECH, Omnicell Inc, Nexus AG, Altera Digital Health Inc, Getinge AB, Cerner Corporation, Optum Inc, Picis Clinical Solutions, Steris PLC, McKesson Corporation.
3. What are the main segments of the Operating Room Management Market?
The market segments include Component, Solution, Delivery Mode, End User.
4. Can you provide details about the market size?
The market size is estimated to be USD 4.05 billion as of 2022.
5. What are some drivers contributing to market growth?
Requirement for Efficient Improvement in the Operating Room (OR); Emphasis on the Reduction of Cost in the OR; Increasing Number of Surgical Procedures.
6. What are the notable trends driving market growth?
Software Segment holds a Major Share in the Operating Room Management Market.
7. Are there any restraints impacting market growth?
High Setup Cost for Patient Engagement Solutions.
8. Can you provide examples of recent developments in the market?
In June 2022, Proximie successfully raised USD 80 million in Series C equity financing to accelerate the development and scale of Proximie's Operating System for the operating room, a centralized platform delivering connected surgical care.
9. What pricing options are available for accessing the report?
Pricing options include single-user, multi-user, and enterprise licenses priced at USD 4750, USD 5250, and USD 8750 respectively.
10. Is the market size provided in terms of value or volume?
The market size is provided in terms of value, measured in billion and volume, measured in K Unit.
11. Are there any specific market keywords associated with the report?
Yes, the market keyword associated with the report is "Operating Room Management Market," which aids in identifying and referencing the specific market segment covered.
12. How do I determine which pricing option suits my needs best?
The pricing options vary based on user requirements and access needs. Individual users may opt for single-user licenses, while businesses requiring broader access may choose multi-user or enterprise licenses for cost-effective access to the report.
13. Are there any additional resources or data provided in the Operating Room Management Market report?
While the report offers comprehensive insights, it's advisable to review the specific contents or supplementary materials provided to ascertain if additional resources or data are available.
14. How can I stay updated on further developments or reports in the Operating Room Management Market?
To stay informed about further developments, trends, and reports in the Operating Room Management Market, consider subscribing to industry newsletters, following relevant companies and organizations, or regularly checking reputable industry news sources and publications.
Methodology
Step 1 - Identification of Relevant Samples Size from Population Database


Step 2 - Approaches for Defining Global Market Size (Value, Volume* & Price*)

Note*: In applicable scenarios
Step 3 - Data Sources
Primary Research
- Web Analytics
- Survey Reports
- Research Institute
- Latest Research Reports
- Opinion Leaders
Secondary Research
- Annual Reports
- White Paper
- Latest Press Release
- Industry Association
- Paid Database
- Investor Presentations

Step 4 - Data Triangulation
Involves using different sources of information in order to increase the validity of a study
These sources are likely to be stakeholders in a program - participants, other researchers, program staff, other community members, and so on.
Then we put all data in single framework & apply various statistical tools to find out the dynamic on the market.
During the analysis stage, feedback from the stakeholder groups would be compared to determine areas of agreement as well as areas of divergence