
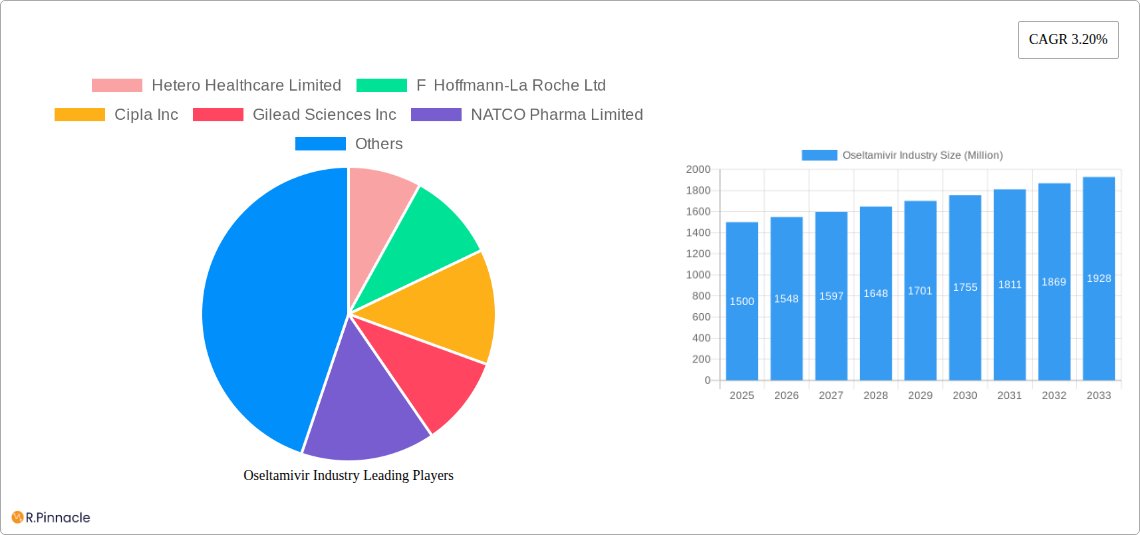
Key Insights
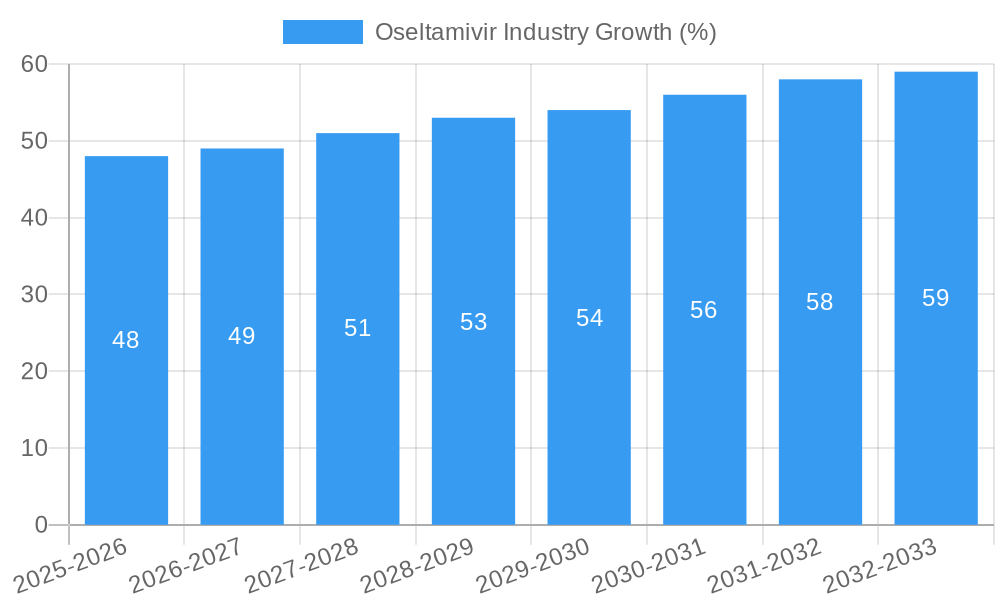
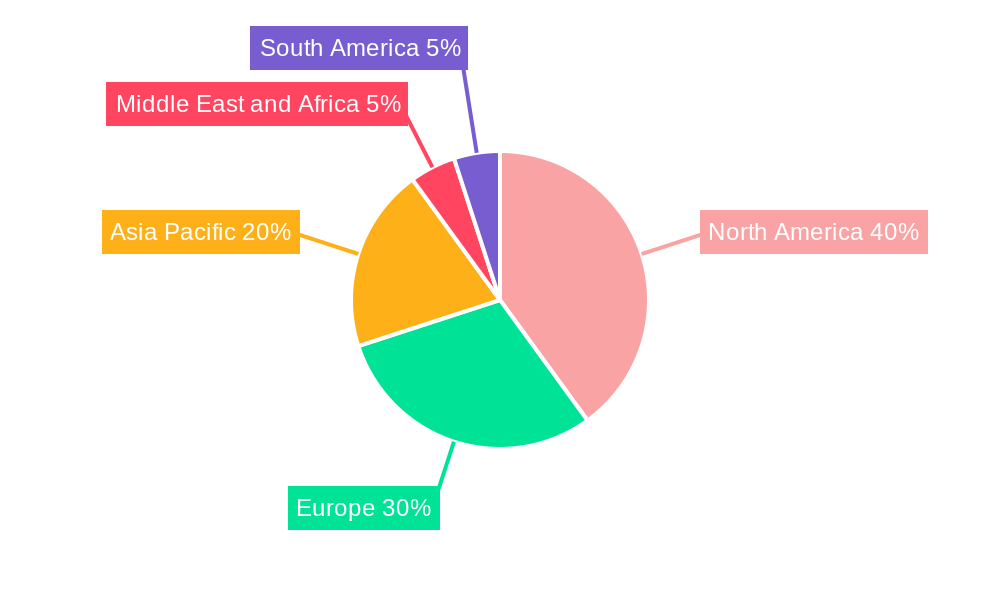
The global Oseltamivir market, valued at approximately $1.5 billion in 2025, is projected to experience steady growth, driven primarily by the persistent threat of influenza outbreaks and increasing demand for effective antiviral treatments. A Compound Annual Growth Rate (CAGR) of 3.20% from 2025 to 2033 indicates a gradual but consistent expansion. This growth is fueled by several factors, including rising awareness of influenza prevention and treatment, particularly among vulnerable populations like the elderly and those with chronic health conditions. Furthermore, the development of new formulations and delivery methods, such as improved capsules and suspensions, are contributing to market expansion. However, factors such as the emergence of antiviral-resistant influenza strains and the potential for side effects associated with Oseltamivir pose challenges to market growth. The market is segmented by product type (capsule, suspension, and others) and application (influenza A, influenza B, and others), with capsules currently holding the largest market share due to ease of administration and widespread acceptance. Geographically, North America and Europe are expected to maintain significant market shares, driven by robust healthcare infrastructure and high prevalence of influenza. However, rapidly developing economies in Asia Pacific are showing significant potential for growth in Oseltamivir consumption due to increasing disposable incomes and healthcare spending. The competitive landscape includes major pharmaceutical companies such as Hetero Healthcare Limited, Roche, Cipla, and Gilead Sciences, each striving to maintain market presence through innovation and strategic partnerships.
The forecast period (2025-2033) suggests continued market expansion, although the rate of growth might be influenced by factors such as the development of new influenza vaccines and the evolving prevalence of different influenza strains. The ongoing research and development in the antiviral medication sector may lead to the introduction of more effective or safer alternatives, presenting both opportunities and threats to the Oseltamivir market. The success of individual companies will depend on factors including their research capabilities, regulatory approvals, and effective marketing and distribution strategies. Strategic partnerships and acquisitions may further reshape the competitive dynamics within the Oseltamivir market. Long-term market growth will depend on mitigating the challenges of antiviral resistance and maintaining strong public health awareness about influenza prevention and treatment.
Oseltamivir Industry Report: 2019-2033 Forecast
This comprehensive report provides an in-depth analysis of the global Oseltamivir industry, covering market size, growth drivers, competitive landscape, and future outlook. The study period spans from 2019 to 2033, with 2025 as the base and estimated year. This report is essential for industry professionals, investors, and strategic decision-makers seeking actionable insights into this dynamic market.
Oseltamivir Industry Market Structure & Innovation Trends
The Oseltamivir market is characterized by a moderately concentrated structure, with key players holding significant market share. While exact figures for market share are proprietary data, F Hoffmann-La Roche Ltd, and Gilead Sciences Inc. historically held substantial portions. The market is driven by innovation in formulation (capsules, suspensions, etc.), ongoing research into efficacy against evolving influenza strains, and regulatory approvals for generic versions. Mergers and acquisitions (M&A) have played a role in shaping the competitive landscape; however, precise deal values for the period are unavailable (xx Million). The regulatory framework varies across geographies, influencing pricing and market access. Product substitutes, like baloxavir, are emerging, creating both challenges and opportunities. End-users are primarily healthcare providers and pharmaceutical distributors, with demographics largely reflecting the global distribution of influenza cases.
Oseltamivir Industry Market Dynamics & Trends
The global Oseltamivir market is projected to experience a Compound Annual Growth Rate (CAGR) of xx% during the forecast period (2025-2033). Market penetration varies considerably across regions, with developed countries showing higher adoption rates. Growth is fueled by factors such as the persistent threat of seasonal and pandemic influenza, increasing healthcare expenditure, and rising awareness of antiviral treatments. Technological advancements in drug delivery systems contribute to improved patient compliance and efficacy. However, the emergence of antiviral resistance and the development of alternative treatments pose challenges. Competitive dynamics are influenced by pricing pressures from generic drug manufacturers and the ongoing efforts of established players to maintain market share through innovative formulations and clinical trials. Consumer preference leans towards convenient formulations like oral suspensions, driving segment growth.
Dominant Regions & Segments in Oseltamivir Industry
Leading Region/Country: North America historically held a leading position due to higher healthcare expenditure and influenza prevalence. However, Asia Pacific is showing significant growth potential driven by expanding healthcare infrastructure and increasing population density.
Dominant Segments:
- By Product Type: Capsules remain a dominant segment, though suspensions are gaining popularity, particularly for pediatric populations. Other product types (e.g., inhalers) represent a smaller, niche market.
- By Application: Influenza A remains the primary application, however, treatment for Influenza B is also significant. Other applications are limited, and more research may expand this segment.
Key drivers in North America include strong regulatory support and well-established healthcare systems. In Asia Pacific, factors such as government initiatives to improve public health infrastructure and increasing awareness about preventive healthcare are driving market growth.
Oseltamivir Industry Product Innovations
Recent innovations focus on improving drug delivery systems (e.g., extended-release formulations, novel delivery methods) and enhancing efficacy against resistant strains. There's a significant push to develop combination therapies to tackle emerging resistance issues. These innovations are mainly driven by the need to provide more effective and convenient treatment options to patients. The market fit is largely determined by regulatory approvals and patient acceptance.
Report Scope & Segmentation Analysis
By Product Type: The report segments the market by Capsule, Suspension, and Other Product Types, analyzing growth projections, market size, and competitive dynamics within each segment.
By Application: The report segments the market by Influenza A, Influenza B, and Other Applications, providing a detailed analysis of each segment's market size, growth drivers, and challenges.
Growth projections for each segment are based on various factors like disease prevalence, healthcare expenditure, and technological advancements. Competitive dynamics are influenced by the presence of both innovator and generic drug manufacturers.
Key Drivers of Oseltamivir Industry Growth
The Oseltamivir market's growth is primarily driven by the increasing prevalence of influenza infections globally, particularly seasonal flu outbreaks. Technological advancements in drug delivery systems improve patient adherence. Regulatory approvals of generic versions expand access and lower costs. Economic factors like rising healthcare expenditure and increasing disposable incomes influence market demand.
Challenges in the Oseltamivir Industry Sector
Key challenges include the emergence of antiviral resistance, leading to reduced drug efficacy. Supply chain disruptions can impact product availability and pricing. Intense competition from generic manufacturers puts pressure on profit margins. Strict regulatory pathways delay product launches and increase development costs. These factors combine to impact market growth and profitability.
Emerging Opportunities in Oseltamivir Industry
Emerging opportunities lie in developing novel formulations, focusing on improved bioavailability and reduced side effects. Expansion into underpenetrated markets in developing countries presents significant growth potential. The development of combination therapies and prophylaxis options to tackle antiviral resistance could significantly impact the market.
Leading Players in the Oseltamivir Industry Market
- Hetero Healthcare Limited
- F Hoffmann-La Roche Ltd
- Cipla Inc
- Gilead Sciences Inc
- NATCO Pharma Limited
- Strides Pharma Science Limited
- Amneal Pharmaceuticals LLC
- Lupin Limited
- Alembic Pharmaceuticals Limited
- Macleods Pharmaceuticals Ltd
- Zydus Cadila
Key Developments in Oseltamivir Industry
- October 2021: M.D. Anderson Cancer Center initiated a Phase II clinical study on the effect of baloxavir in combination with oseltamivir in treating severe influenza infection in patients who have previously received a hematopoietic (blood) stem cell transplant. This highlights the ongoing research into combination therapies.
- January 2022: Strides Pharma Science Ltd received approval from the U.S. health regulator for its generic version of oseltamivir phosphate for oral suspension. This increased competition in the market.
Future Outlook for Oseltamivir Industry Market
The future of the Oseltamivir market looks promising, driven by the persistent threat of influenza, ongoing research into new formulations, and expanding access to healthcare in developing countries. Strategic partnerships and collaborations between pharmaceutical companies and research institutions are expected to drive innovation and market growth. The focus will be on managing antiviral resistance and developing more effective and convenient treatment options.
Oseltamivir Industry Segmentation
-
1. Product Type
- 1.1. Capsule
- 1.2. Suspension
- 1.3. Other Product Types
-
2. Industry vertical
- 2.1. Influenza A
- 2.2. Influenza B
- 2.3. Other
Oseltamivir Industry Segmentation By Geography
-
1. North America
- 1.1. United States
- 1.2. Canada
- 1.3. Mexico
-
2. Europe
- 2.1. Germany
- 2.2. United Kingdom
- 2.3. France
- 2.4. Italy
- 2.5. Spain
- 2.6. Rest of Europe
-
3. Asia Pacific
- 3.1. China
- 3.2. Japan
- 3.3. India
- 3.4. Australia
- 3.5. South Korea
- 3.6. Rest of Asia Pacific
-
4. Middle East and Africa
- 4.1. GCC
- 4.2. South Africa
- 4.3. Rest of Middle East and Africa
-
5. South America
- 5.1. Brazil
- 5.2. Argentina
- 5.3. Rest of South America
Oseltamivir Industry REPORT HIGHLIGHTS
| Aspects | Details |
|---|---|
| Study Period | 2019-2033 |
| Base Year | 2024 |
| Estimated Year | 2025 |
| Forecast Period | 2025-2033 |
| Historical Period | 2019-2024 |
| Growth Rate | CAGR of 3.20% from 2019-2033 |
| Segmentation |
|
Table of Contents
- 1. Introduction
- 1.1. Research Scope
- 1.2. Market Segmentation
- 1.3. Research Methodology
- 1.4. Definitions and Assumptions
- 2. Executive Summary
- 2.1. Introduction
- 3. Market Dynamics
- 3.1. Introduction
- 3.2. Market Drivers
- 3.2.1. Rising Prevalence of Influenza Virus Infections; Increase in the Number of Research and Development Activities
- 3.3. Market Restrains
- 3.3.1. Side Effects Associated with Oseltamivir Treatment
- 3.4. Market Trends
- 3.4.1. Influenza A Segment Expects to Register a High CAGR Over the Forecast Period
- 4. Market Factor Analysis
- 4.1. Porters Five Forces
- 4.2. Supply/Value Chain
- 4.3. PESTEL analysis
- 4.4. Market Entropy
- 4.5. Patent/Trademark Analysis
- 5. Global Oseltamivir Industry Analysis, Insights and Forecast, 2019-2031
- 5.1. Market Analysis, Insights and Forecast - by Product Type
- 5.1.1. Capsule
- 5.1.2. Suspension
- 5.1.3. Other Product Types
- 5.2. Market Analysis, Insights and Forecast - by Industry vertical
- 5.2.1. Influenza A
- 5.2.2. Influenza B
- 5.2.3. Other
- 5.3. Market Analysis, Insights and Forecast - by Region
- 5.3.1. North America
- 5.3.2. Europe
- 5.3.3. Asia Pacific
- 5.3.4. Middle East and Africa
- 5.3.5. South America
- 5.1. Market Analysis, Insights and Forecast - by Product Type
- 6. North America Oseltamivir Industry Analysis, Insights and Forecast, 2019-2031
- 6.1. Market Analysis, Insights and Forecast - by Product Type
- 6.1.1. Capsule
- 6.1.2. Suspension
- 6.1.3. Other Product Types
- 6.2. Market Analysis, Insights and Forecast - by Industry vertical
- 6.2.1. Influenza A
- 6.2.2. Influenza B
- 6.2.3. Other
- 6.1. Market Analysis, Insights and Forecast - by Product Type
- 7. Europe Oseltamivir Industry Analysis, Insights and Forecast, 2019-2031
- 7.1. Market Analysis, Insights and Forecast - by Product Type
- 7.1.1. Capsule
- 7.1.2. Suspension
- 7.1.3. Other Product Types
- 7.2. Market Analysis, Insights and Forecast - by Industry vertical
- 7.2.1. Influenza A
- 7.2.2. Influenza B
- 7.2.3. Other
- 7.1. Market Analysis, Insights and Forecast - by Product Type
- 8. Asia Pacific Oseltamivir Industry Analysis, Insights and Forecast, 2019-2031
- 8.1. Market Analysis, Insights and Forecast - by Product Type
- 8.1.1. Capsule
- 8.1.2. Suspension
- 8.1.3. Other Product Types
- 8.2. Market Analysis, Insights and Forecast - by Industry vertical
- 8.2.1. Influenza A
- 8.2.2. Influenza B
- 8.2.3. Other
- 8.1. Market Analysis, Insights and Forecast - by Product Type
- 9. Middle East and Africa Oseltamivir Industry Analysis, Insights and Forecast, 2019-2031
- 9.1. Market Analysis, Insights and Forecast - by Product Type
- 9.1.1. Capsule
- 9.1.2. Suspension
- 9.1.3. Other Product Types
- 9.2. Market Analysis, Insights and Forecast - by Industry vertical
- 9.2.1. Influenza A
- 9.2.2. Influenza B
- 9.2.3. Other
- 9.1. Market Analysis, Insights and Forecast - by Product Type
- 10. South America Oseltamivir Industry Analysis, Insights and Forecast, 2019-2031
- 10.1. Market Analysis, Insights and Forecast - by Product Type
- 10.1.1. Capsule
- 10.1.2. Suspension
- 10.1.3. Other Product Types
- 10.2. Market Analysis, Insights and Forecast - by Industry vertical
- 10.2.1. Influenza A
- 10.2.2. Influenza B
- 10.2.3. Other
- 10.1. Market Analysis, Insights and Forecast - by Product Type
- 11. North America Oseltamivir Industry Analysis, Insights and Forecast, 2019-2031
- 11.1. Market Analysis, Insights and Forecast - By Country/Sub-region
- 11.1.1 United States
- 11.1.2 Canada
- 11.1.3 Mexico
- 12. Europe Oseltamivir Industry Analysis, Insights and Forecast, 2019-2031
- 12.1. Market Analysis, Insights and Forecast - By Country/Sub-region
- 12.1.1 Germany
- 12.1.2 United Kingdom
- 12.1.3 France
- 12.1.4 Italy
- 12.1.5 Spain
- 12.1.6 Rest of Europe
- 13. Asia Pacific Oseltamivir Industry Analysis, Insights and Forecast, 2019-2031
- 13.1. Market Analysis, Insights and Forecast - By Country/Sub-region
- 13.1.1 China
- 13.1.2 Japan
- 13.1.3 India
- 13.1.4 Australia
- 13.1.5 South Korea
- 13.1.6 Rest of Asia Pacific
- 14. Middle East and Africa Oseltamivir Industry Analysis, Insights and Forecast, 2019-2031
- 14.1. Market Analysis, Insights and Forecast - By Country/Sub-region
- 14.1.1 GCC
- 14.1.2 South Africa
- 14.1.3 Rest of Middle East and Africa
- 15. South America Oseltamivir Industry Analysis, Insights and Forecast, 2019-2031
- 15.1. Market Analysis, Insights and Forecast - By Country/Sub-region
- 15.1.1 Brazil
- 15.1.2 Argentina
- 15.1.3 Rest of South America
- 16. Competitive Analysis
- 16.1. Global Market Share Analysis 2024
- 16.2. Company Profiles
- 16.2.1 Hetero Healthcare Limited
- 16.2.1.1. Overview
- 16.2.1.2. Products
- 16.2.1.3. SWOT Analysis
- 16.2.1.4. Recent Developments
- 16.2.1.5. Financials (Based on Availability)
- 16.2.2 F Hoffmann-La Roche Ltd
- 16.2.2.1. Overview
- 16.2.2.2. Products
- 16.2.2.3. SWOT Analysis
- 16.2.2.4. Recent Developments
- 16.2.2.5. Financials (Based on Availability)
- 16.2.3 Cipla Inc
- 16.2.3.1. Overview
- 16.2.3.2. Products
- 16.2.3.3. SWOT Analysis
- 16.2.3.4. Recent Developments
- 16.2.3.5. Financials (Based on Availability)
- 16.2.4 Gilead Sciences Inc
- 16.2.4.1. Overview
- 16.2.4.2. Products
- 16.2.4.3. SWOT Analysis
- 16.2.4.4. Recent Developments
- 16.2.4.5. Financials (Based on Availability)
- 16.2.5 NATCO Pharma Limited
- 16.2.5.1. Overview
- 16.2.5.2. Products
- 16.2.5.3. SWOT Analysis
- 16.2.5.4. Recent Developments
- 16.2.5.5. Financials (Based on Availability)
- 16.2.6 Strides Pharma Science Limited
- 16.2.6.1. Overview
- 16.2.6.2. Products
- 16.2.6.3. SWOT Analysis
- 16.2.6.4. Recent Developments
- 16.2.6.5. Financials (Based on Availability)
- 16.2.7 Amneal Pharmaceuticals LLC
- 16.2.7.1. Overview
- 16.2.7.2. Products
- 16.2.7.3. SWOT Analysis
- 16.2.7.4. Recent Developments
- 16.2.7.5. Financials (Based on Availability)
- 16.2.8 Lupin Limited
- 16.2.8.1. Overview
- 16.2.8.2. Products
- 16.2.8.3. SWOT Analysis
- 16.2.8.4. Recent Developments
- 16.2.8.5. Financials (Based on Availability)
- 16.2.9 Alembic Pharmaceuticals Limited
- 16.2.9.1. Overview
- 16.2.9.2. Products
- 16.2.9.3. SWOT Analysis
- 16.2.9.4. Recent Developments
- 16.2.9.5. Financials (Based on Availability)
- 16.2.10 Macleods Pharmaceuticals Ltd
- 16.2.10.1. Overview
- 16.2.10.2. Products
- 16.2.10.3. SWOT Analysis
- 16.2.10.4. Recent Developments
- 16.2.10.5. Financials (Based on Availability)
- 16.2.11 Zydus Cadila
- 16.2.11.1. Overview
- 16.2.11.2. Products
- 16.2.11.3. SWOT Analysis
- 16.2.11.4. Recent Developments
- 16.2.11.5. Financials (Based on Availability)
- 16.2.1 Hetero Healthcare Limited
List of Figures
- Figure 1: Global Oseltamivir Industry Revenue Breakdown (Million, %) by Region 2024 & 2032
- Figure 2: Global Oseltamivir Industry Volume Breakdown (K Unit, %) by Region 2024 & 2032
- Figure 3: North America Oseltamivir Industry Revenue (Million), by Country 2024 & 2032
- Figure 4: North America Oseltamivir Industry Volume (K Unit), by Country 2024 & 2032
- Figure 5: North America Oseltamivir Industry Revenue Share (%), by Country 2024 & 2032
- Figure 6: North America Oseltamivir Industry Volume Share (%), by Country 2024 & 2032
- Figure 7: Europe Oseltamivir Industry Revenue (Million), by Country 2024 & 2032
- Figure 8: Europe Oseltamivir Industry Volume (K Unit), by Country 2024 & 2032
- Figure 9: Europe Oseltamivir Industry Revenue Share (%), by Country 2024 & 2032
- Figure 10: Europe Oseltamivir Industry Volume Share (%), by Country 2024 & 2032
- Figure 11: Asia Pacific Oseltamivir Industry Revenue (Million), by Country 2024 & 2032
- Figure 12: Asia Pacific Oseltamivir Industry Volume (K Unit), by Country 2024 & 2032
- Figure 13: Asia Pacific Oseltamivir Industry Revenue Share (%), by Country 2024 & 2032
- Figure 14: Asia Pacific Oseltamivir Industry Volume Share (%), by Country 2024 & 2032
- Figure 15: Middle East and Africa Oseltamivir Industry Revenue (Million), by Country 2024 & 2032
- Figure 16: Middle East and Africa Oseltamivir Industry Volume (K Unit), by Country 2024 & 2032
- Figure 17: Middle East and Africa Oseltamivir Industry Revenue Share (%), by Country 2024 & 2032
- Figure 18: Middle East and Africa Oseltamivir Industry Volume Share (%), by Country 2024 & 2032
- Figure 19: South America Oseltamivir Industry Revenue (Million), by Country 2024 & 2032
- Figure 20: South America Oseltamivir Industry Volume (K Unit), by Country 2024 & 2032
- Figure 21: South America Oseltamivir Industry Revenue Share (%), by Country 2024 & 2032
- Figure 22: South America Oseltamivir Industry Volume Share (%), by Country 2024 & 2032
- Figure 23: North America Oseltamivir Industry Revenue (Million), by Product Type 2024 & 2032
- Figure 24: North America Oseltamivir Industry Volume (K Unit), by Product Type 2024 & 2032
- Figure 25: North America Oseltamivir Industry Revenue Share (%), by Product Type 2024 & 2032
- Figure 26: North America Oseltamivir Industry Volume Share (%), by Product Type 2024 & 2032
- Figure 27: North America Oseltamivir Industry Revenue (Million), by Industry vertical 2024 & 2032
- Figure 28: North America Oseltamivir Industry Volume (K Unit), by Industry vertical 2024 & 2032
- Figure 29: North America Oseltamivir Industry Revenue Share (%), by Industry vertical 2024 & 2032
- Figure 30: North America Oseltamivir Industry Volume Share (%), by Industry vertical 2024 & 2032
- Figure 31: North America Oseltamivir Industry Revenue (Million), by Country 2024 & 2032
- Figure 32: North America Oseltamivir Industry Volume (K Unit), by Country 2024 & 2032
- Figure 33: North America Oseltamivir Industry Revenue Share (%), by Country 2024 & 2032
- Figure 34: North America Oseltamivir Industry Volume Share (%), by Country 2024 & 2032
- Figure 35: Europe Oseltamivir Industry Revenue (Million), by Product Type 2024 & 2032
- Figure 36: Europe Oseltamivir Industry Volume (K Unit), by Product Type 2024 & 2032
- Figure 37: Europe Oseltamivir Industry Revenue Share (%), by Product Type 2024 & 2032
- Figure 38: Europe Oseltamivir Industry Volume Share (%), by Product Type 2024 & 2032
- Figure 39: Europe Oseltamivir Industry Revenue (Million), by Industry vertical 2024 & 2032
- Figure 40: Europe Oseltamivir Industry Volume (K Unit), by Industry vertical 2024 & 2032
- Figure 41: Europe Oseltamivir Industry Revenue Share (%), by Industry vertical 2024 & 2032
- Figure 42: Europe Oseltamivir Industry Volume Share (%), by Industry vertical 2024 & 2032
- Figure 43: Europe Oseltamivir Industry Revenue (Million), by Country 2024 & 2032
- Figure 44: Europe Oseltamivir Industry Volume (K Unit), by Country 2024 & 2032
- Figure 45: Europe Oseltamivir Industry Revenue Share (%), by Country 2024 & 2032
- Figure 46: Europe Oseltamivir Industry Volume Share (%), by Country 2024 & 2032
- Figure 47: Asia Pacific Oseltamivir Industry Revenue (Million), by Product Type 2024 & 2032
- Figure 48: Asia Pacific Oseltamivir Industry Volume (K Unit), by Product Type 2024 & 2032
- Figure 49: Asia Pacific Oseltamivir Industry Revenue Share (%), by Product Type 2024 & 2032
- Figure 50: Asia Pacific Oseltamivir Industry Volume Share (%), by Product Type 2024 & 2032
- Figure 51: Asia Pacific Oseltamivir Industry Revenue (Million), by Industry vertical 2024 & 2032
- Figure 52: Asia Pacific Oseltamivir Industry Volume (K Unit), by Industry vertical 2024 & 2032
- Figure 53: Asia Pacific Oseltamivir Industry Revenue Share (%), by Industry vertical 2024 & 2032
- Figure 54: Asia Pacific Oseltamivir Industry Volume Share (%), by Industry vertical 2024 & 2032
- Figure 55: Asia Pacific Oseltamivir Industry Revenue (Million), by Country 2024 & 2032
- Figure 56: Asia Pacific Oseltamivir Industry Volume (K Unit), by Country 2024 & 2032
- Figure 57: Asia Pacific Oseltamivir Industry Revenue Share (%), by Country 2024 & 2032
- Figure 58: Asia Pacific Oseltamivir Industry Volume Share (%), by Country 2024 & 2032
- Figure 59: Middle East and Africa Oseltamivir Industry Revenue (Million), by Product Type 2024 & 2032
- Figure 60: Middle East and Africa Oseltamivir Industry Volume (K Unit), by Product Type 2024 & 2032
- Figure 61: Middle East and Africa Oseltamivir Industry Revenue Share (%), by Product Type 2024 & 2032
- Figure 62: Middle East and Africa Oseltamivir Industry Volume Share (%), by Product Type 2024 & 2032
- Figure 63: Middle East and Africa Oseltamivir Industry Revenue (Million), by Industry vertical 2024 & 2032
- Figure 64: Middle East and Africa Oseltamivir Industry Volume (K Unit), by Industry vertical 2024 & 2032
- Figure 65: Middle East and Africa Oseltamivir Industry Revenue Share (%), by Industry vertical 2024 & 2032
- Figure 66: Middle East and Africa Oseltamivir Industry Volume Share (%), by Industry vertical 2024 & 2032
- Figure 67: Middle East and Africa Oseltamivir Industry Revenue (Million), by Country 2024 & 2032
- Figure 68: Middle East and Africa Oseltamivir Industry Volume (K Unit), by Country 2024 & 2032
- Figure 69: Middle East and Africa Oseltamivir Industry Revenue Share (%), by Country 2024 & 2032
- Figure 70: Middle East and Africa Oseltamivir Industry Volume Share (%), by Country 2024 & 2032
- Figure 71: South America Oseltamivir Industry Revenue (Million), by Product Type 2024 & 2032
- Figure 72: South America Oseltamivir Industry Volume (K Unit), by Product Type 2024 & 2032
- Figure 73: South America Oseltamivir Industry Revenue Share (%), by Product Type 2024 & 2032
- Figure 74: South America Oseltamivir Industry Volume Share (%), by Product Type 2024 & 2032
- Figure 75: South America Oseltamivir Industry Revenue (Million), by Industry vertical 2024 & 2032
- Figure 76: South America Oseltamivir Industry Volume (K Unit), by Industry vertical 2024 & 2032
- Figure 77: South America Oseltamivir Industry Revenue Share (%), by Industry vertical 2024 & 2032
- Figure 78: South America Oseltamivir Industry Volume Share (%), by Industry vertical 2024 & 2032
- Figure 79: South America Oseltamivir Industry Revenue (Million), by Country 2024 & 2032
- Figure 80: South America Oseltamivir Industry Volume (K Unit), by Country 2024 & 2032
- Figure 81: South America Oseltamivir Industry Revenue Share (%), by Country 2024 & 2032
- Figure 82: South America Oseltamivir Industry Volume Share (%), by Country 2024 & 2032
List of Tables
- Table 1: Global Oseltamivir Industry Revenue Million Forecast, by Region 2019 & 2032
- Table 2: Global Oseltamivir Industry Volume K Unit Forecast, by Region 2019 & 2032
- Table 3: Global Oseltamivir Industry Revenue Million Forecast, by Product Type 2019 & 2032
- Table 4: Global Oseltamivir Industry Volume K Unit Forecast, by Product Type 2019 & 2032
- Table 5: Global Oseltamivir Industry Revenue Million Forecast, by Industry vertical 2019 & 2032
- Table 6: Global Oseltamivir Industry Volume K Unit Forecast, by Industry vertical 2019 & 2032
- Table 7: Global Oseltamivir Industry Revenue Million Forecast, by Region 2019 & 2032
- Table 8: Global Oseltamivir Industry Volume K Unit Forecast, by Region 2019 & 2032
- Table 9: Global Oseltamivir Industry Revenue Million Forecast, by Country 2019 & 2032
- Table 10: Global Oseltamivir Industry Volume K Unit Forecast, by Country 2019 & 2032
- Table 11: United States Oseltamivir Industry Revenue (Million) Forecast, by Application 2019 & 2032
- Table 12: United States Oseltamivir Industry Volume (K Unit) Forecast, by Application 2019 & 2032
- Table 13: Canada Oseltamivir Industry Revenue (Million) Forecast, by Application 2019 & 2032
- Table 14: Canada Oseltamivir Industry Volume (K Unit) Forecast, by Application 2019 & 2032
- Table 15: Mexico Oseltamivir Industry Revenue (Million) Forecast, by Application 2019 & 2032
- Table 16: Mexico Oseltamivir Industry Volume (K Unit) Forecast, by Application 2019 & 2032
- Table 17: Global Oseltamivir Industry Revenue Million Forecast, by Country 2019 & 2032
- Table 18: Global Oseltamivir Industry Volume K Unit Forecast, by Country 2019 & 2032
- Table 19: Germany Oseltamivir Industry Revenue (Million) Forecast, by Application 2019 & 2032
- Table 20: Germany Oseltamivir Industry Volume (K Unit) Forecast, by Application 2019 & 2032
- Table 21: United Kingdom Oseltamivir Industry Revenue (Million) Forecast, by Application 2019 & 2032
- Table 22: United Kingdom Oseltamivir Industry Volume (K Unit) Forecast, by Application 2019 & 2032
- Table 23: France Oseltamivir Industry Revenue (Million) Forecast, by Application 2019 & 2032
- Table 24: France Oseltamivir Industry Volume (K Unit) Forecast, by Application 2019 & 2032
- Table 25: Italy Oseltamivir Industry Revenue (Million) Forecast, by Application 2019 & 2032
- Table 26: Italy Oseltamivir Industry Volume (K Unit) Forecast, by Application 2019 & 2032
- Table 27: Spain Oseltamivir Industry Revenue (Million) Forecast, by Application 2019 & 2032
- Table 28: Spain Oseltamivir Industry Volume (K Unit) Forecast, by Application 2019 & 2032
- Table 29: Rest of Europe Oseltamivir Industry Revenue (Million) Forecast, by Application 2019 & 2032
- Table 30: Rest of Europe Oseltamivir Industry Volume (K Unit) Forecast, by Application 2019 & 2032
- Table 31: Global Oseltamivir Industry Revenue Million Forecast, by Country 2019 & 2032
- Table 32: Global Oseltamivir Industry Volume K Unit Forecast, by Country 2019 & 2032
- Table 33: China Oseltamivir Industry Revenue (Million) Forecast, by Application 2019 & 2032
- Table 34: China Oseltamivir Industry Volume (K Unit) Forecast, by Application 2019 & 2032
- Table 35: Japan Oseltamivir Industry Revenue (Million) Forecast, by Application 2019 & 2032
- Table 36: Japan Oseltamivir Industry Volume (K Unit) Forecast, by Application 2019 & 2032
- Table 37: India Oseltamivir Industry Revenue (Million) Forecast, by Application 2019 & 2032
- Table 38: India Oseltamivir Industry Volume (K Unit) Forecast, by Application 2019 & 2032
- Table 39: Australia Oseltamivir Industry Revenue (Million) Forecast, by Application 2019 & 2032
- Table 40: Australia Oseltamivir Industry Volume (K Unit) Forecast, by Application 2019 & 2032
- Table 41: South Korea Oseltamivir Industry Revenue (Million) Forecast, by Application 2019 & 2032
- Table 42: South Korea Oseltamivir Industry Volume (K Unit) Forecast, by Application 2019 & 2032
- Table 43: Rest of Asia Pacific Oseltamivir Industry Revenue (Million) Forecast, by Application 2019 & 2032
- Table 44: Rest of Asia Pacific Oseltamivir Industry Volume (K Unit) Forecast, by Application 2019 & 2032
- Table 45: Global Oseltamivir Industry Revenue Million Forecast, by Country 2019 & 2032
- Table 46: Global Oseltamivir Industry Volume K Unit Forecast, by Country 2019 & 2032
- Table 47: GCC Oseltamivir Industry Revenue (Million) Forecast, by Application 2019 & 2032
- Table 48: GCC Oseltamivir Industry Volume (K Unit) Forecast, by Application 2019 & 2032
- Table 49: South Africa Oseltamivir Industry Revenue (Million) Forecast, by Application 2019 & 2032
- Table 50: South Africa Oseltamivir Industry Volume (K Unit) Forecast, by Application 2019 & 2032
- Table 51: Rest of Middle East and Africa Oseltamivir Industry Revenue (Million) Forecast, by Application 2019 & 2032
- Table 52: Rest of Middle East and Africa Oseltamivir Industry Volume (K Unit) Forecast, by Application 2019 & 2032
- Table 53: Global Oseltamivir Industry Revenue Million Forecast, by Country 2019 & 2032
- Table 54: Global Oseltamivir Industry Volume K Unit Forecast, by Country 2019 & 2032
- Table 55: Brazil Oseltamivir Industry Revenue (Million) Forecast, by Application 2019 & 2032
- Table 56: Brazil Oseltamivir Industry Volume (K Unit) Forecast, by Application 2019 & 2032
- Table 57: Argentina Oseltamivir Industry Revenue (Million) Forecast, by Application 2019 & 2032
- Table 58: Argentina Oseltamivir Industry Volume (K Unit) Forecast, by Application 2019 & 2032
- Table 59: Rest of South America Oseltamivir Industry Revenue (Million) Forecast, by Application 2019 & 2032
- Table 60: Rest of South America Oseltamivir Industry Volume (K Unit) Forecast, by Application 2019 & 2032
- Table 61: Global Oseltamivir Industry Revenue Million Forecast, by Product Type 2019 & 2032
- Table 62: Global Oseltamivir Industry Volume K Unit Forecast, by Product Type 2019 & 2032
- Table 63: Global Oseltamivir Industry Revenue Million Forecast, by Industry vertical 2019 & 2032
- Table 64: Global Oseltamivir Industry Volume K Unit Forecast, by Industry vertical 2019 & 2032
- Table 65: Global Oseltamivir Industry Revenue Million Forecast, by Country 2019 & 2032
- Table 66: Global Oseltamivir Industry Volume K Unit Forecast, by Country 2019 & 2032
- Table 67: United States Oseltamivir Industry Revenue (Million) Forecast, by Application 2019 & 2032
- Table 68: United States Oseltamivir Industry Volume (K Unit) Forecast, by Application 2019 & 2032
- Table 69: Canada Oseltamivir Industry Revenue (Million) Forecast, by Application 2019 & 2032
- Table 70: Canada Oseltamivir Industry Volume (K Unit) Forecast, by Application 2019 & 2032
- Table 71: Mexico Oseltamivir Industry Revenue (Million) Forecast, by Application 2019 & 2032
- Table 72: Mexico Oseltamivir Industry Volume (K Unit) Forecast, by Application 2019 & 2032
- Table 73: Global Oseltamivir Industry Revenue Million Forecast, by Product Type 2019 & 2032
- Table 74: Global Oseltamivir Industry Volume K Unit Forecast, by Product Type 2019 & 2032
- Table 75: Global Oseltamivir Industry Revenue Million Forecast, by Industry vertical 2019 & 2032
- Table 76: Global Oseltamivir Industry Volume K Unit Forecast, by Industry vertical 2019 & 2032
- Table 77: Global Oseltamivir Industry Revenue Million Forecast, by Country 2019 & 2032
- Table 78: Global Oseltamivir Industry Volume K Unit Forecast, by Country 2019 & 2032
- Table 79: Germany Oseltamivir Industry Revenue (Million) Forecast, by Application 2019 & 2032
- Table 80: Germany Oseltamivir Industry Volume (K Unit) Forecast, by Application 2019 & 2032
- Table 81: United Kingdom Oseltamivir Industry Revenue (Million) Forecast, by Application 2019 & 2032
- Table 82: United Kingdom Oseltamivir Industry Volume (K Unit) Forecast, by Application 2019 & 2032
- Table 83: France Oseltamivir Industry Revenue (Million) Forecast, by Application 2019 & 2032
- Table 84: France Oseltamivir Industry Volume (K Unit) Forecast, by Application 2019 & 2032
- Table 85: Italy Oseltamivir Industry Revenue (Million) Forecast, by Application 2019 & 2032
- Table 86: Italy Oseltamivir Industry Volume (K Unit) Forecast, by Application 2019 & 2032
- Table 87: Spain Oseltamivir Industry Revenue (Million) Forecast, by Application 2019 & 2032
- Table 88: Spain Oseltamivir Industry Volume (K Unit) Forecast, by Application 2019 & 2032
- Table 89: Rest of Europe Oseltamivir Industry Revenue (Million) Forecast, by Application 2019 & 2032
- Table 90: Rest of Europe Oseltamivir Industry Volume (K Unit) Forecast, by Application 2019 & 2032
- Table 91: Global Oseltamivir Industry Revenue Million Forecast, by Product Type 2019 & 2032
- Table 92: Global Oseltamivir Industry Volume K Unit Forecast, by Product Type 2019 & 2032
- Table 93: Global Oseltamivir Industry Revenue Million Forecast, by Industry vertical 2019 & 2032
- Table 94: Global Oseltamivir Industry Volume K Unit Forecast, by Industry vertical 2019 & 2032
- Table 95: Global Oseltamivir Industry Revenue Million Forecast, by Country 2019 & 2032
- Table 96: Global Oseltamivir Industry Volume K Unit Forecast, by Country 2019 & 2032
- Table 97: China Oseltamivir Industry Revenue (Million) Forecast, by Application 2019 & 2032
- Table 98: China Oseltamivir Industry Volume (K Unit) Forecast, by Application 2019 & 2032
- Table 99: Japan Oseltamivir Industry Revenue (Million) Forecast, by Application 2019 & 2032
- Table 100: Japan Oseltamivir Industry Volume (K Unit) Forecast, by Application 2019 & 2032
- Table 101: India Oseltamivir Industry Revenue (Million) Forecast, by Application 2019 & 2032
- Table 102: India Oseltamivir Industry Volume (K Unit) Forecast, by Application 2019 & 2032
- Table 103: Australia Oseltamivir Industry Revenue (Million) Forecast, by Application 2019 & 2032
- Table 104: Australia Oseltamivir Industry Volume (K Unit) Forecast, by Application 2019 & 2032
- Table 105: South Korea Oseltamivir Industry Revenue (Million) Forecast, by Application 2019 & 2032
- Table 106: South Korea Oseltamivir Industry Volume (K Unit) Forecast, by Application 2019 & 2032
- Table 107: Rest of Asia Pacific Oseltamivir Industry Revenue (Million) Forecast, by Application 2019 & 2032
- Table 108: Rest of Asia Pacific Oseltamivir Industry Volume (K Unit) Forecast, by Application 2019 & 2032
- Table 109: Global Oseltamivir Industry Revenue Million Forecast, by Product Type 2019 & 2032
- Table 110: Global Oseltamivir Industry Volume K Unit Forecast, by Product Type 2019 & 2032
- Table 111: Global Oseltamivir Industry Revenue Million Forecast, by Industry vertical 2019 & 2032
- Table 112: Global Oseltamivir Industry Volume K Unit Forecast, by Industry vertical 2019 & 2032
- Table 113: Global Oseltamivir Industry Revenue Million Forecast, by Country 2019 & 2032
- Table 114: Global Oseltamivir Industry Volume K Unit Forecast, by Country 2019 & 2032
- Table 115: GCC Oseltamivir Industry Revenue (Million) Forecast, by Application 2019 & 2032
- Table 116: GCC Oseltamivir Industry Volume (K Unit) Forecast, by Application 2019 & 2032
- Table 117: South Africa Oseltamivir Industry Revenue (Million) Forecast, by Application 2019 & 2032
- Table 118: South Africa Oseltamivir Industry Volume (K Unit) Forecast, by Application 2019 & 2032
- Table 119: Rest of Middle East and Africa Oseltamivir Industry Revenue (Million) Forecast, by Application 2019 & 2032
- Table 120: Rest of Middle East and Africa Oseltamivir Industry Volume (K Unit) Forecast, by Application 2019 & 2032
- Table 121: Global Oseltamivir Industry Revenue Million Forecast, by Product Type 2019 & 2032
- Table 122: Global Oseltamivir Industry Volume K Unit Forecast, by Product Type 2019 & 2032
- Table 123: Global Oseltamivir Industry Revenue Million Forecast, by Industry vertical 2019 & 2032
- Table 124: Global Oseltamivir Industry Volume K Unit Forecast, by Industry vertical 2019 & 2032
- Table 125: Global Oseltamivir Industry Revenue Million Forecast, by Country 2019 & 2032
- Table 126: Global Oseltamivir Industry Volume K Unit Forecast, by Country 2019 & 2032
- Table 127: Brazil Oseltamivir Industry Revenue (Million) Forecast, by Application 2019 & 2032
- Table 128: Brazil Oseltamivir Industry Volume (K Unit) Forecast, by Application 2019 & 2032
- Table 129: Argentina Oseltamivir Industry Revenue (Million) Forecast, by Application 2019 & 2032
- Table 130: Argentina Oseltamivir Industry Volume (K Unit) Forecast, by Application 2019 & 2032
- Table 131: Rest of South America Oseltamivir Industry Revenue (Million) Forecast, by Application 2019 & 2032
- Table 132: Rest of South America Oseltamivir Industry Volume (K Unit) Forecast, by Application 2019 & 2032
Frequently Asked Questions
1. What is the projected Compound Annual Growth Rate (CAGR) of the Oseltamivir Industry?
The projected CAGR is approximately 3.20%.
2. Which companies are prominent players in the Oseltamivir Industry?
Key companies in the market include Hetero Healthcare Limited, F Hoffmann-La Roche Ltd, Cipla Inc, Gilead Sciences Inc, NATCO Pharma Limited, Strides Pharma Science Limited, Amneal Pharmaceuticals LLC, Lupin Limited, Alembic Pharmaceuticals Limited, Macleods Pharmaceuticals Ltd, Zydus Cadila.
3. What are the main segments of the Oseltamivir Industry?
The market segments include Product Type, Industry vertical.
4. Can you provide details about the market size?
The market size is estimated to be USD XX Million as of 2022.
5. What are some drivers contributing to market growth?
Rising Prevalence of Influenza Virus Infections; Increase in the Number of Research and Development Activities.
6. What are the notable trends driving market growth?
Influenza A Segment Expects to Register a High CAGR Over the Forecast Period.
7. Are there any restraints impacting market growth?
Side Effects Associated with Oseltamivir Treatment.
8. Can you provide examples of recent developments in the market?
October 2021: M.D. Anderson Cancer Center initiated a Phase II clinical study on the effect of baloxavir in combination with oseltamivir in treating severe influenza infection in patients who have previously received a hematopoietic (blood) stem cell transplant.
9. What pricing options are available for accessing the report?
Pricing options include single-user, multi-user, and enterprise licenses priced at USD 4750, USD 5250, and USD 8750 respectively.
10. Is the market size provided in terms of value or volume?
The market size is provided in terms of value, measured in Million and volume, measured in K Unit.
11. Are there any specific market keywords associated with the report?
Yes, the market keyword associated with the report is "Oseltamivir Industry," which aids in identifying and referencing the specific market segment covered.
12. How do I determine which pricing option suits my needs best?
The pricing options vary based on user requirements and access needs. Individual users may opt for single-user licenses, while businesses requiring broader access may choose multi-user or enterprise licenses for cost-effective access to the report.
13. Are there any additional resources or data provided in the Oseltamivir Industry report?
While the report offers comprehensive insights, it's advisable to review the specific contents or supplementary materials provided to ascertain if additional resources or data are available.
14. How can I stay updated on further developments or reports in the Oseltamivir Industry?
To stay informed about further developments, trends, and reports in the Oseltamivir Industry, consider subscribing to industry newsletters, following relevant companies and organizations, or regularly checking reputable industry news sources and publications.
Methodology
Step 1 - Identification of Relevant Samples Size from Population Database


Step 2 - Approaches for Defining Global Market Size (Value, Volume* & Price*)

Note*: In applicable scenarios
Step 3 - Data Sources
Primary Research
- Web Analytics
- Survey Reports
- Research Institute
- Latest Research Reports
- Opinion Leaders
Secondary Research
- Annual Reports
- White Paper
- Latest Press Release
- Industry Association
- Paid Database
- Investor Presentations

Step 4 - Data Triangulation
Involves using different sources of information in order to increase the validity of a study
These sources are likely to be stakeholders in a program - participants, other researchers, program staff, other community members, and so on.
Then we put all data in single framework & apply various statistical tools to find out the dynamic on the market.
During the analysis stage, feedback from the stakeholder groups would be compared to determine areas of agreement as well as areas of divergence


