
Key Insights
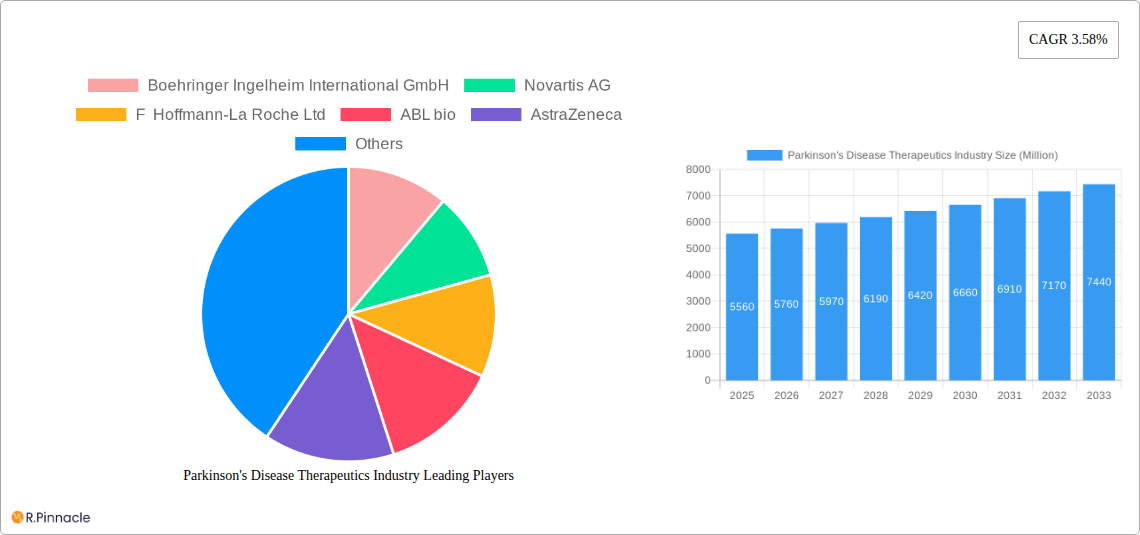
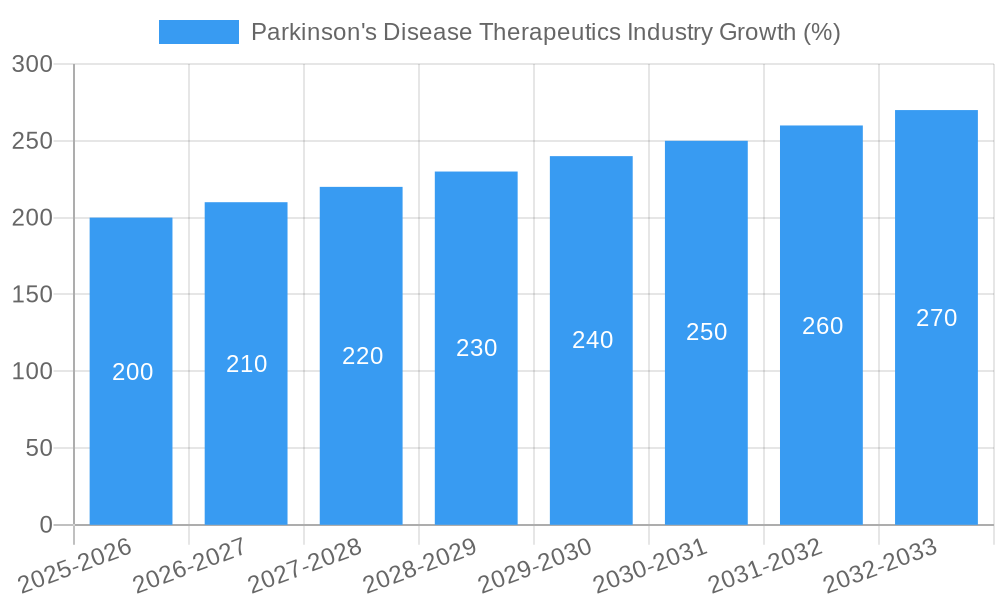
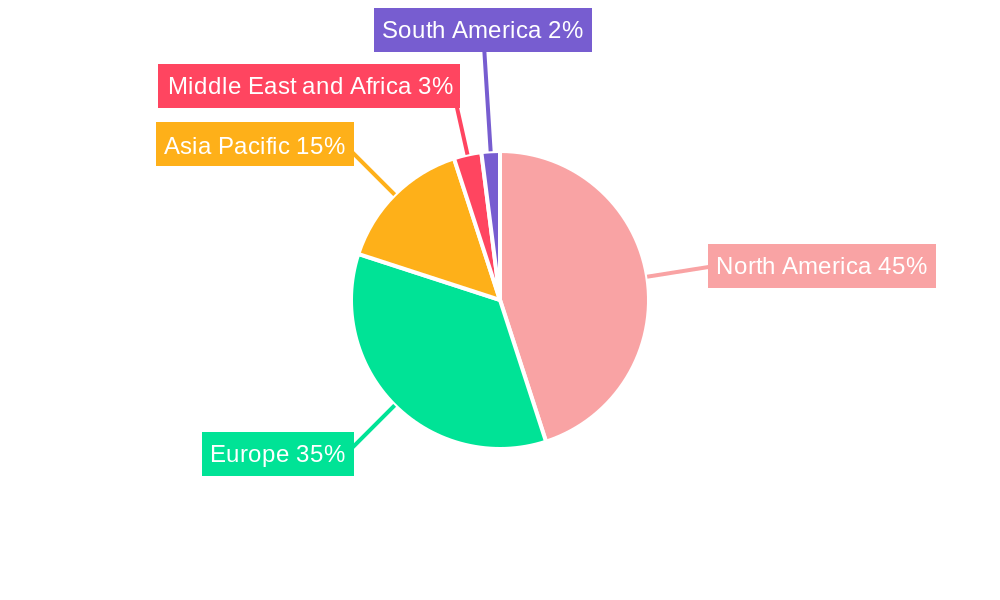
The Parkinson's Disease Therapeutics market, valued at $5.56 billion in 2025, is projected to experience steady growth, driven by an aging global population and increasing prevalence of Parkinson's disease. A compound annual growth rate (CAGR) of 3.58% from 2025 to 2033 indicates a substantial market expansion. Key growth drivers include the continuous development and introduction of novel therapies targeting different disease mechanisms, alongside increasing awareness and improved diagnostic capabilities. While the aging population fuels demand, challenges remain, such as the high cost of advanced treatments and the presence of significant side effects associated with some medications, potentially limiting market penetration in certain demographics. The market is segmented by mechanism of action, with dopamine agonists, anticholinergics, MAO-B inhibitors, amantadine, carbidopa-levodopa, COMT inhibitors, and other mechanisms contributing to the overall market value. Geographical variations exist, with North America and Europe currently holding larger market shares due to higher healthcare expenditure and established healthcare infrastructure; however, the Asia-Pacific region is expected to show considerable growth in the forecast period driven by increasing disease prevalence and rising healthcare investment. Competitive dynamics are intense, with numerous pharmaceutical companies actively involved in research, development, and commercialization of Parkinson's disease therapeutics. This leads to continuous innovation and a diverse range of treatment options available to patients, shaping the market landscape.
The market's future trajectory will significantly depend on several factors. Continued research into more effective and safer therapies, including gene therapies and disease-modifying agents, will play a pivotal role. Regulatory approvals for new drugs, pricing policies, and patient access initiatives in various regions will also influence market growth. The increasing focus on personalized medicine approaches tailored to individual patient needs, genetic profiles, and disease stages presents a significant opportunity for market expansion. Furthermore, the rising adoption of telemedicine and remote patient monitoring may improve access to care and potentially enhance treatment outcomes, contributing to the market's overall development. Addressing the challenges associated with side effects and cost will be critical for maximizing market penetration and improving the lives of those affected by Parkinson's disease.
Parkinson's Disease Therapeutics Industry Report: 2019-2033
This comprehensive report provides an in-depth analysis of the Parkinson's Disease Therapeutics market, offering crucial insights for industry professionals, investors, and researchers. Covering the period 2019-2033, with a base year of 2025 and a forecast period of 2025-2033, this report leverages rigorous data analysis to present a clear and actionable view of this dynamic market. The global market size in 2025 is estimated at xx Million.
Parkinson's Disease Therapeutics Industry Market Structure & Innovation Trends
The Parkinson's Disease Therapeutics market exhibits a moderately concentrated structure, with key players such as Boehringer Ingelheim International GmbH, Novartis AG, F Hoffmann-La Roche Ltd, and others holding significant market share. Market share distribution varies across different segments based on mechanism of action and geographical region. Innovation is driven by the persistent unmet medical needs of Parkinson's patients, fueling research and development in novel therapeutic approaches. The regulatory landscape, while stringent, encourages innovation through fast-track approvals for promising therapies. The market is characterized by continuous M&A activity, reflecting the desire to expand pipelines and consolidate market positions. Deal values have varied significantly, with larger deals exceeding USD xx Million, but many transactions remaining in the USD xx to USD xx Million range. Product substitution is limited given the disease's complexity, although competition among existing therapies remains intense. The end-user demographic predominantly consists of the elderly population, with a growing prevalence of Parkinson's disease in aging societies globally.
- Market Concentration: Moderately concentrated.
- Innovation Drivers: Unmet medical needs, R&D investment.
- Regulatory Framework: Stringent but supportive of innovation.
- M&A Activity: Significant, with deals spanning USD xx Million to USD xx Million.
- End-User Demographics: Primarily elderly population.
Parkinson's Disease Therapeutics Industry Market Dynamics & Trends
The Parkinson's Disease Therapeutics market is experiencing robust growth, driven primarily by increasing prevalence of Parkinson's disease globally, an aging population, and rising healthcare expenditure. The Compound Annual Growth Rate (CAGR) during the forecast period (2025-2033) is projected to be xx%, indicating strong market expansion. Technological disruptions, such as advancements in gene therapy and personalized medicine, are expected to further accelerate market growth. Consumer preferences are shifting towards less invasive treatments with improved efficacy and reduced side effects. Competitive dynamics are shaped by intense R&D efforts, strategic alliances, and market entry of novel therapies. Market penetration of new treatments is influenced by factors like regulatory approvals, clinical trial success, and pricing strategies. The market is also witnessing a rise in demand for combination therapies offering synergistic effects. The market penetration of newer drugs varies by region, but is gradually increasing as more advanced therapies gain approval.
Dominant Regions & Segments in Parkinson's Disease Therapeutics Industry
North America currently dominates the Parkinson's Disease Therapeutics market, driven by factors such as high healthcare expenditure, advanced healthcare infrastructure, and a large patient population. The European market is also a significant contributor, while the Asia-Pacific region demonstrates substantial growth potential due to increasing prevalence and improved healthcare access.
Dominant Segments by Mechanism of Action:
- Carbidopa-levodopa: Remains a dominant segment due to its established efficacy and widespread use.
- Dopamine Agonists: Significant market share, with continuous development of new agonists.
- MAO-B Inhibitors: Stable market presence, despite emerging newer therapies.
Key Drivers for Dominant Regions:
- North America: High healthcare spending, advanced infrastructure, large patient population.
- Europe: Well-established healthcare systems, significant R&D investment.
- Asia-Pacific: Rapidly growing aging population, increasing healthcare spending.
Parkinson's Disease Therapeutics Industry Product Innovations
Significant product innovations are reshaping the Parkinson's Disease Therapeutics landscape. This includes the development of novel therapies targeting specific disease pathways, advanced drug delivery systems, and personalized medicine approaches. Gene therapies and immunotherapies are emerging as promising avenues, while improvements in existing treatments focus on enhancing efficacy and reducing side effects. These advancements are improving patient outcomes and expanding treatment options, driving market growth and competition.
Report Scope & Segmentation Analysis
This report segments the Parkinson's Disease Therapeutics market based on mechanism of action, including Dopamine Agonists, Anticholinergic, MAO-B inhibitors, Amantadine, Carbidopa-levodopa, COMT Inhibitors, and Other Mechanisms of Action. Each segment is analyzed based on market size, growth rate, competitive landscape, and future projections. For example, the Carbidopa-levodopa segment holds a significant market share, but faces competition from newer therapies in the pipeline. Similarly, the Dopamine Agonists segment is expected to witness moderate growth driven by the introduction of new, improved formulations. The other segments are all expected to see varying rates of growth over the forecast period, influenced by factors such as R&D advancements and regulatory approvals.
Key Drivers of Parkinson's Disease Therapeutics Industry Growth
Several key factors are driving the growth of the Parkinson's Disease Therapeutics market. The increasing prevalence of Parkinson's disease globally, fueled by an aging population, is a primary driver. Technological advancements in drug development, leading to more effective and safer therapies, further accelerate market growth. Government initiatives and funding for Parkinson's research also play a crucial role. Furthermore, rising healthcare expenditure and improved access to healthcare contribute to market expansion.
Challenges in the Parkinson's Disease Therapeutics Industry Sector
The Parkinson's Disease Therapeutics industry faces several challenges. Stringent regulatory approvals for new therapies can prolong the development process and increase costs. Supply chain disruptions can impact drug availability and affordability. Intense competition among existing players and the entry of new entrants further add pressure. The high cost of developing and bringing new treatments to market poses a significant financial hurdle, impacting market accessibility.
Emerging Opportunities in Parkinson's Disease Therapeutics Industry
Significant opportunities exist in the Parkinson's Disease Therapeutics market. The emergence of novel therapies like gene therapy and immunotherapy presents significant potential. The growing focus on personalized medicine allows for targeted treatments based on individual patient characteristics. Expansion into untapped markets, particularly in developing countries with increasing prevalence, offers significant growth potential. Furthermore, development of combination therapies and advanced drug delivery systems presents further avenues for innovation.
Leading Players in the Parkinson's Disease Therapeutics Industry Market
- Boehringer Ingelheim International GmbH
- Novartis AG
- F Hoffmann-La Roche Ltd
- ABL bio
- AstraZeneca
- Teva Pharmaceuticals Industries Ltd
- Prevail Therapeutics
- Kissei Pharmaceutical Co Ltd
- Newron Pharmaceuticals SPA
- Viatris
- AbbVie Inc
- GSK plc
- Amneal Pharmaceuticals LLC
- Pfizer Inc
Key Developments in Parkinson's Disease Therapeutics Industry
- March 2022: Neuron23 raised USD 100 Million to advance Parkinson's disease therapy, planning trials for NEU-723.
- January 2022: ABL Bio Inc. partnered with Sanofi for worldwide licensing of ABL301, a bispecific antibody targeting alpha-synuclein and IGF1R.
Future Outlook for Parkinson's Disease Therapeutics Industry Market
The future of the Parkinson's Disease Therapeutics market looks promising. Continued innovation in drug development, coupled with an aging global population and increasing healthcare expenditure, will fuel significant market growth. The emergence of novel therapeutic approaches and personalized medicine strategies will further reshape the market landscape. Strategic collaborations and mergers and acquisitions will play a key role in shaping the competitive dynamics and market consolidation. The potential for significant market expansion and the introduction of transformative therapies offers substantial long-term growth prospects.
Parkinson's Disease Therapeutics Industry Segmentation
-
1. Mechanism of Action
- 1.1. Dopamine Agonists
- 1.2. Anticholinergic
- 1.3. MAO-B inhibitors
- 1.4. Amantadine
- 1.5. Carbidopa-levodopa
- 1.6. COMT Inhibitors
- 1.7. Other Mechanisms of Action
Parkinson's Disease Therapeutics Industry Segmentation By Geography
-
1. North America
- 1.1. United States
- 1.2. Canada
- 1.3. Mexico
-
2. Europe
- 2.1. Germany
- 2.2. United Kingdom
- 2.3. France
- 2.4. Italy
- 2.5. Spain
- 2.6. Rest of Europe
-
3. Asia Pacific
- 3.1. China
- 3.2. Japan
- 3.3. India
- 3.4. Australia
- 3.5. South Korea
- 3.6. Rest of Asia Pacific
-
4. Middle East and Africa
- 4.1. GCC
- 4.2. South Africa
- 4.3. Rest of Middle East and Africa
-
5. South America
- 5.1. Brazil
- 5.2. Argentina
- 5.3. Rest of South America
Parkinson's Disease Therapeutics Industry REPORT HIGHLIGHTS
| Aspects | Details |
|---|---|
| Study Period | 2019-2033 |
| Base Year | 2024 |
| Estimated Year | 2025 |
| Forecast Period | 2025-2033 |
| Historical Period | 2019-2024 |
| Growth Rate | CAGR of 3.58% from 2019-2033 |
| Segmentation |
|
Table of Contents
- 1. Introduction
- 1.1. Research Scope
- 1.2. Market Segmentation
- 1.3. Research Methodology
- 1.4. Definitions and Assumptions
- 2. Executive Summary
- 2.1. Introduction
- 3. Market Dynamics
- 3.1. Introduction
- 3.2. Market Drivers
- 3.2.1. Rising Geriatric Population and Burden of Parkinson's Disease; Growing Awareness Among the Population; Increasing R&D and Continuous Drug Approvals
- 3.3. Market Restrains
- 3.3.1. Adverse Events Associated with Therapeutics; High Cost of Treatments Followed by Extremely High R&D Expenditure
- 3.4. Market Trends
- 3.4.1. MAO-B inhibitors Segment is Expected to Dominate the Market Over the Forecast Period
- 4. Market Factor Analysis
- 4.1. Porters Five Forces
- 4.2. Supply/Value Chain
- 4.3. PESTEL analysis
- 4.4. Market Entropy
- 4.5. Patent/Trademark Analysis
- 5. Global Parkinson's Disease Therapeutics Industry Analysis, Insights and Forecast, 2019-2031
- 5.1. Market Analysis, Insights and Forecast - by Mechanism of Action
- 5.1.1. Dopamine Agonists
- 5.1.2. Anticholinergic
- 5.1.3. MAO-B inhibitors
- 5.1.4. Amantadine
- 5.1.5. Carbidopa-levodopa
- 5.1.6. COMT Inhibitors
- 5.1.7. Other Mechanisms of Action
- 5.2. Market Analysis, Insights and Forecast - by Region
- 5.2.1. North America
- 5.2.2. Europe
- 5.2.3. Asia Pacific
- 5.2.4. Middle East and Africa
- 5.2.5. South America
- 5.1. Market Analysis, Insights and Forecast - by Mechanism of Action
- 6. North America Parkinson's Disease Therapeutics Industry Analysis, Insights and Forecast, 2019-2031
- 6.1. Market Analysis, Insights and Forecast - by Mechanism of Action
- 6.1.1. Dopamine Agonists
- 6.1.2. Anticholinergic
- 6.1.3. MAO-B inhibitors
- 6.1.4. Amantadine
- 6.1.5. Carbidopa-levodopa
- 6.1.6. COMT Inhibitors
- 6.1.7. Other Mechanisms of Action
- 6.1. Market Analysis, Insights and Forecast - by Mechanism of Action
- 7. Europe Parkinson's Disease Therapeutics Industry Analysis, Insights and Forecast, 2019-2031
- 7.1. Market Analysis, Insights and Forecast - by Mechanism of Action
- 7.1.1. Dopamine Agonists
- 7.1.2. Anticholinergic
- 7.1.3. MAO-B inhibitors
- 7.1.4. Amantadine
- 7.1.5. Carbidopa-levodopa
- 7.1.6. COMT Inhibitors
- 7.1.7. Other Mechanisms of Action
- 7.1. Market Analysis, Insights and Forecast - by Mechanism of Action
- 8. Asia Pacific Parkinson's Disease Therapeutics Industry Analysis, Insights and Forecast, 2019-2031
- 8.1. Market Analysis, Insights and Forecast - by Mechanism of Action
- 8.1.1. Dopamine Agonists
- 8.1.2. Anticholinergic
- 8.1.3. MAO-B inhibitors
- 8.1.4. Amantadine
- 8.1.5. Carbidopa-levodopa
- 8.1.6. COMT Inhibitors
- 8.1.7. Other Mechanisms of Action
- 8.1. Market Analysis, Insights and Forecast - by Mechanism of Action
- 9. Middle East and Africa Parkinson's Disease Therapeutics Industry Analysis, Insights and Forecast, 2019-2031
- 9.1. Market Analysis, Insights and Forecast - by Mechanism of Action
- 9.1.1. Dopamine Agonists
- 9.1.2. Anticholinergic
- 9.1.3. MAO-B inhibitors
- 9.1.4. Amantadine
- 9.1.5. Carbidopa-levodopa
- 9.1.6. COMT Inhibitors
- 9.1.7. Other Mechanisms of Action
- 9.1. Market Analysis, Insights and Forecast - by Mechanism of Action
- 10. South America Parkinson's Disease Therapeutics Industry Analysis, Insights and Forecast, 2019-2031
- 10.1. Market Analysis, Insights and Forecast - by Mechanism of Action
- 10.1.1. Dopamine Agonists
- 10.1.2. Anticholinergic
- 10.1.3. MAO-B inhibitors
- 10.1.4. Amantadine
- 10.1.5. Carbidopa-levodopa
- 10.1.6. COMT Inhibitors
- 10.1.7. Other Mechanisms of Action
- 10.1. Market Analysis, Insights and Forecast - by Mechanism of Action
- 11. North America Parkinson's Disease Therapeutics Industry Analysis, Insights and Forecast, 2019-2031
- 11.1. Market Analysis, Insights and Forecast - By Country/Sub-region
- 11.1.1 United States
- 11.1.2 Canada
- 11.1.3 Mexico
- 12. Europe Parkinson's Disease Therapeutics Industry Analysis, Insights and Forecast, 2019-2031
- 12.1. Market Analysis, Insights and Forecast - By Country/Sub-region
- 12.1.1 Germany
- 12.1.2 United Kingdom
- 12.1.3 France
- 12.1.4 Italy
- 12.1.5 Spain
- 12.1.6 Rest of Europe
- 13. Asia Pacific Parkinson's Disease Therapeutics Industry Analysis, Insights and Forecast, 2019-2031
- 13.1. Market Analysis, Insights and Forecast - By Country/Sub-region
- 13.1.1 China
- 13.1.2 Japan
- 13.1.3 India
- 13.1.4 Australia
- 13.1.5 South Korea
- 13.1.6 Rest of Asia Pacific
- 14. Middle East and Africa Parkinson's Disease Therapeutics Industry Analysis, Insights and Forecast, 2019-2031
- 14.1. Market Analysis, Insights and Forecast - By Country/Sub-region
- 14.1.1 GCC
- 14.1.2 South Africa
- 14.1.3 Rest of Middle East and Africa
- 15. South America Parkinson's Disease Therapeutics Industry Analysis, Insights and Forecast, 2019-2031
- 15.1. Market Analysis, Insights and Forecast - By Country/Sub-region
- 15.1.1 Brazil
- 15.1.2 Argentina
- 15.1.3 Rest of South America
- 16. Competitive Analysis
- 16.1. Global Market Share Analysis 2024
- 16.2. Company Profiles
- 16.2.1 Boehringer Ingelheim International GmbH
- 16.2.1.1. Overview
- 16.2.1.2. Products
- 16.2.1.3. SWOT Analysis
- 16.2.1.4. Recent Developments
- 16.2.1.5. Financials (Based on Availability)
- 16.2.2 Novartis AG
- 16.2.2.1. Overview
- 16.2.2.2. Products
- 16.2.2.3. SWOT Analysis
- 16.2.2.4. Recent Developments
- 16.2.2.5. Financials (Based on Availability)
- 16.2.3 F Hoffmann-La Roche Ltd
- 16.2.3.1. Overview
- 16.2.3.2. Products
- 16.2.3.3. SWOT Analysis
- 16.2.3.4. Recent Developments
- 16.2.3.5. Financials (Based on Availability)
- 16.2.4 ABL bio
- 16.2.4.1. Overview
- 16.2.4.2. Products
- 16.2.4.3. SWOT Analysis
- 16.2.4.4. Recent Developments
- 16.2.4.5. Financials (Based on Availability)
- 16.2.5 AstraZeneca
- 16.2.5.1. Overview
- 16.2.5.2. Products
- 16.2.5.3. SWOT Analysis
- 16.2.5.4. Recent Developments
- 16.2.5.5. Financials (Based on Availability)
- 16.2.6 Teva Pharmaceuticals Industries Ltd
- 16.2.6.1. Overview
- 16.2.6.2. Products
- 16.2.6.3. SWOT Analysis
- 16.2.6.4. Recent Developments
- 16.2.6.5. Financials (Based on Availability)
- 16.2.7 Prevail Therapeutics
- 16.2.7.1. Overview
- 16.2.7.2. Products
- 16.2.7.3. SWOT Analysis
- 16.2.7.4. Recent Developments
- 16.2.7.5. Financials (Based on Availability)
- 16.2.8 Kissei Pharmaceutical Co Ltd
- 16.2.8.1. Overview
- 16.2.8.2. Products
- 16.2.8.3. SWOT Analysis
- 16.2.8.4. Recent Developments
- 16.2.8.5. Financials (Based on Availability)
- 16.2.9 Newron Pharmaceuticals SPA
- 16.2.9.1. Overview
- 16.2.9.2. Products
- 16.2.9.3. SWOT Analysis
- 16.2.9.4. Recent Developments
- 16.2.9.5. Financials (Based on Availability)
- 16.2.10 Viatris
- 16.2.10.1. Overview
- 16.2.10.2. Products
- 16.2.10.3. SWOT Analysis
- 16.2.10.4. Recent Developments
- 16.2.10.5. Financials (Based on Availability)
- 16.2.11 AbbVie Inc
- 16.2.11.1. Overview
- 16.2.11.2. Products
- 16.2.11.3. SWOT Analysis
- 16.2.11.4. Recent Developments
- 16.2.11.5. Financials (Based on Availability)
- 16.2.12 GSK plc
- 16.2.12.1. Overview
- 16.2.12.2. Products
- 16.2.12.3. SWOT Analysis
- 16.2.12.4. Recent Developments
- 16.2.12.5. Financials (Based on Availability)
- 16.2.13 Amneal Pharmaceuticals LLC
- 16.2.13.1. Overview
- 16.2.13.2. Products
- 16.2.13.3. SWOT Analysis
- 16.2.13.4. Recent Developments
- 16.2.13.5. Financials (Based on Availability)
- 16.2.14 Pfizer Inc
- 16.2.14.1. Overview
- 16.2.14.2. Products
- 16.2.14.3. SWOT Analysis
- 16.2.14.4. Recent Developments
- 16.2.14.5. Financials (Based on Availability)
- 16.2.1 Boehringer Ingelheim International GmbH
List of Figures
- Figure 1: Global Parkinson's Disease Therapeutics Industry Revenue Breakdown (Million, %) by Region 2024 & 2032
- Figure 2: Global Parkinson's Disease Therapeutics Industry Volume Breakdown (K Unit, %) by Region 2024 & 2032
- Figure 3: North America Parkinson's Disease Therapeutics Industry Revenue (Million), by Country 2024 & 2032
- Figure 4: North America Parkinson's Disease Therapeutics Industry Volume (K Unit), by Country 2024 & 2032
- Figure 5: North America Parkinson's Disease Therapeutics Industry Revenue Share (%), by Country 2024 & 2032
- Figure 6: North America Parkinson's Disease Therapeutics Industry Volume Share (%), by Country 2024 & 2032
- Figure 7: Europe Parkinson's Disease Therapeutics Industry Revenue (Million), by Country 2024 & 2032
- Figure 8: Europe Parkinson's Disease Therapeutics Industry Volume (K Unit), by Country 2024 & 2032
- Figure 9: Europe Parkinson's Disease Therapeutics Industry Revenue Share (%), by Country 2024 & 2032
- Figure 10: Europe Parkinson's Disease Therapeutics Industry Volume Share (%), by Country 2024 & 2032
- Figure 11: Asia Pacific Parkinson's Disease Therapeutics Industry Revenue (Million), by Country 2024 & 2032
- Figure 12: Asia Pacific Parkinson's Disease Therapeutics Industry Volume (K Unit), by Country 2024 & 2032
- Figure 13: Asia Pacific Parkinson's Disease Therapeutics Industry Revenue Share (%), by Country 2024 & 2032
- Figure 14: Asia Pacific Parkinson's Disease Therapeutics Industry Volume Share (%), by Country 2024 & 2032
- Figure 15: Middle East and Africa Parkinson's Disease Therapeutics Industry Revenue (Million), by Country 2024 & 2032
- Figure 16: Middle East and Africa Parkinson's Disease Therapeutics Industry Volume (K Unit), by Country 2024 & 2032
- Figure 17: Middle East and Africa Parkinson's Disease Therapeutics Industry Revenue Share (%), by Country 2024 & 2032
- Figure 18: Middle East and Africa Parkinson's Disease Therapeutics Industry Volume Share (%), by Country 2024 & 2032
- Figure 19: South America Parkinson's Disease Therapeutics Industry Revenue (Million), by Country 2024 & 2032
- Figure 20: South America Parkinson's Disease Therapeutics Industry Volume (K Unit), by Country 2024 & 2032
- Figure 21: South America Parkinson's Disease Therapeutics Industry Revenue Share (%), by Country 2024 & 2032
- Figure 22: South America Parkinson's Disease Therapeutics Industry Volume Share (%), by Country 2024 & 2032
- Figure 23: North America Parkinson's Disease Therapeutics Industry Revenue (Million), by Mechanism of Action 2024 & 2032
- Figure 24: North America Parkinson's Disease Therapeutics Industry Volume (K Unit), by Mechanism of Action 2024 & 2032
- Figure 25: North America Parkinson's Disease Therapeutics Industry Revenue Share (%), by Mechanism of Action 2024 & 2032
- Figure 26: North America Parkinson's Disease Therapeutics Industry Volume Share (%), by Mechanism of Action 2024 & 2032
- Figure 27: North America Parkinson's Disease Therapeutics Industry Revenue (Million), by Country 2024 & 2032
- Figure 28: North America Parkinson's Disease Therapeutics Industry Volume (K Unit), by Country 2024 & 2032
- Figure 29: North America Parkinson's Disease Therapeutics Industry Revenue Share (%), by Country 2024 & 2032
- Figure 30: North America Parkinson's Disease Therapeutics Industry Volume Share (%), by Country 2024 & 2032
- Figure 31: Europe Parkinson's Disease Therapeutics Industry Revenue (Million), by Mechanism of Action 2024 & 2032
- Figure 32: Europe Parkinson's Disease Therapeutics Industry Volume (K Unit), by Mechanism of Action 2024 & 2032
- Figure 33: Europe Parkinson's Disease Therapeutics Industry Revenue Share (%), by Mechanism of Action 2024 & 2032
- Figure 34: Europe Parkinson's Disease Therapeutics Industry Volume Share (%), by Mechanism of Action 2024 & 2032
- Figure 35: Europe Parkinson's Disease Therapeutics Industry Revenue (Million), by Country 2024 & 2032
- Figure 36: Europe Parkinson's Disease Therapeutics Industry Volume (K Unit), by Country 2024 & 2032
- Figure 37: Europe Parkinson's Disease Therapeutics Industry Revenue Share (%), by Country 2024 & 2032
- Figure 38: Europe Parkinson's Disease Therapeutics Industry Volume Share (%), by Country 2024 & 2032
- Figure 39: Asia Pacific Parkinson's Disease Therapeutics Industry Revenue (Million), by Mechanism of Action 2024 & 2032
- Figure 40: Asia Pacific Parkinson's Disease Therapeutics Industry Volume (K Unit), by Mechanism of Action 2024 & 2032
- Figure 41: Asia Pacific Parkinson's Disease Therapeutics Industry Revenue Share (%), by Mechanism of Action 2024 & 2032
- Figure 42: Asia Pacific Parkinson's Disease Therapeutics Industry Volume Share (%), by Mechanism of Action 2024 & 2032
- Figure 43: Asia Pacific Parkinson's Disease Therapeutics Industry Revenue (Million), by Country 2024 & 2032
- Figure 44: Asia Pacific Parkinson's Disease Therapeutics Industry Volume (K Unit), by Country 2024 & 2032
- Figure 45: Asia Pacific Parkinson's Disease Therapeutics Industry Revenue Share (%), by Country 2024 & 2032
- Figure 46: Asia Pacific Parkinson's Disease Therapeutics Industry Volume Share (%), by Country 2024 & 2032
- Figure 47: Middle East and Africa Parkinson's Disease Therapeutics Industry Revenue (Million), by Mechanism of Action 2024 & 2032
- Figure 48: Middle East and Africa Parkinson's Disease Therapeutics Industry Volume (K Unit), by Mechanism of Action 2024 & 2032
- Figure 49: Middle East and Africa Parkinson's Disease Therapeutics Industry Revenue Share (%), by Mechanism of Action 2024 & 2032
- Figure 50: Middle East and Africa Parkinson's Disease Therapeutics Industry Volume Share (%), by Mechanism of Action 2024 & 2032
- Figure 51: Middle East and Africa Parkinson's Disease Therapeutics Industry Revenue (Million), by Country 2024 & 2032
- Figure 52: Middle East and Africa Parkinson's Disease Therapeutics Industry Volume (K Unit), by Country 2024 & 2032
- Figure 53: Middle East and Africa Parkinson's Disease Therapeutics Industry Revenue Share (%), by Country 2024 & 2032
- Figure 54: Middle East and Africa Parkinson's Disease Therapeutics Industry Volume Share (%), by Country 2024 & 2032
- Figure 55: South America Parkinson's Disease Therapeutics Industry Revenue (Million), by Mechanism of Action 2024 & 2032
- Figure 56: South America Parkinson's Disease Therapeutics Industry Volume (K Unit), by Mechanism of Action 2024 & 2032
- Figure 57: South America Parkinson's Disease Therapeutics Industry Revenue Share (%), by Mechanism of Action 2024 & 2032
- Figure 58: South America Parkinson's Disease Therapeutics Industry Volume Share (%), by Mechanism of Action 2024 & 2032
- Figure 59: South America Parkinson's Disease Therapeutics Industry Revenue (Million), by Country 2024 & 2032
- Figure 60: South America Parkinson's Disease Therapeutics Industry Volume (K Unit), by Country 2024 & 2032
- Figure 61: South America Parkinson's Disease Therapeutics Industry Revenue Share (%), by Country 2024 & 2032
- Figure 62: South America Parkinson's Disease Therapeutics Industry Volume Share (%), by Country 2024 & 2032
List of Tables
- Table 1: Global Parkinson's Disease Therapeutics Industry Revenue Million Forecast, by Region 2019 & 2032
- Table 2: Global Parkinson's Disease Therapeutics Industry Volume K Unit Forecast, by Region 2019 & 2032
- Table 3: Global Parkinson's Disease Therapeutics Industry Revenue Million Forecast, by Mechanism of Action 2019 & 2032
- Table 4: Global Parkinson's Disease Therapeutics Industry Volume K Unit Forecast, by Mechanism of Action 2019 & 2032
- Table 5: Global Parkinson's Disease Therapeutics Industry Revenue Million Forecast, by Region 2019 & 2032
- Table 6: Global Parkinson's Disease Therapeutics Industry Volume K Unit Forecast, by Region 2019 & 2032
- Table 7: Global Parkinson's Disease Therapeutics Industry Revenue Million Forecast, by Country 2019 & 2032
- Table 8: Global Parkinson's Disease Therapeutics Industry Volume K Unit Forecast, by Country 2019 & 2032
- Table 9: United States Parkinson's Disease Therapeutics Industry Revenue (Million) Forecast, by Application 2019 & 2032
- Table 10: United States Parkinson's Disease Therapeutics Industry Volume (K Unit) Forecast, by Application 2019 & 2032
- Table 11: Canada Parkinson's Disease Therapeutics Industry Revenue (Million) Forecast, by Application 2019 & 2032
- Table 12: Canada Parkinson's Disease Therapeutics Industry Volume (K Unit) Forecast, by Application 2019 & 2032
- Table 13: Mexico Parkinson's Disease Therapeutics Industry Revenue (Million) Forecast, by Application 2019 & 2032
- Table 14: Mexico Parkinson's Disease Therapeutics Industry Volume (K Unit) Forecast, by Application 2019 & 2032
- Table 15: Global Parkinson's Disease Therapeutics Industry Revenue Million Forecast, by Country 2019 & 2032
- Table 16: Global Parkinson's Disease Therapeutics Industry Volume K Unit Forecast, by Country 2019 & 2032
- Table 17: Germany Parkinson's Disease Therapeutics Industry Revenue (Million) Forecast, by Application 2019 & 2032
- Table 18: Germany Parkinson's Disease Therapeutics Industry Volume (K Unit) Forecast, by Application 2019 & 2032
- Table 19: United Kingdom Parkinson's Disease Therapeutics Industry Revenue (Million) Forecast, by Application 2019 & 2032
- Table 20: United Kingdom Parkinson's Disease Therapeutics Industry Volume (K Unit) Forecast, by Application 2019 & 2032
- Table 21: France Parkinson's Disease Therapeutics Industry Revenue (Million) Forecast, by Application 2019 & 2032
- Table 22: France Parkinson's Disease Therapeutics Industry Volume (K Unit) Forecast, by Application 2019 & 2032
- Table 23: Italy Parkinson's Disease Therapeutics Industry Revenue (Million) Forecast, by Application 2019 & 2032
- Table 24: Italy Parkinson's Disease Therapeutics Industry Volume (K Unit) Forecast, by Application 2019 & 2032
- Table 25: Spain Parkinson's Disease Therapeutics Industry Revenue (Million) Forecast, by Application 2019 & 2032
- Table 26: Spain Parkinson's Disease Therapeutics Industry Volume (K Unit) Forecast, by Application 2019 & 2032
- Table 27: Rest of Europe Parkinson's Disease Therapeutics Industry Revenue (Million) Forecast, by Application 2019 & 2032
- Table 28: Rest of Europe Parkinson's Disease Therapeutics Industry Volume (K Unit) Forecast, by Application 2019 & 2032
- Table 29: Global Parkinson's Disease Therapeutics Industry Revenue Million Forecast, by Country 2019 & 2032
- Table 30: Global Parkinson's Disease Therapeutics Industry Volume K Unit Forecast, by Country 2019 & 2032
- Table 31: China Parkinson's Disease Therapeutics Industry Revenue (Million) Forecast, by Application 2019 & 2032
- Table 32: China Parkinson's Disease Therapeutics Industry Volume (K Unit) Forecast, by Application 2019 & 2032
- Table 33: Japan Parkinson's Disease Therapeutics Industry Revenue (Million) Forecast, by Application 2019 & 2032
- Table 34: Japan Parkinson's Disease Therapeutics Industry Volume (K Unit) Forecast, by Application 2019 & 2032
- Table 35: India Parkinson's Disease Therapeutics Industry Revenue (Million) Forecast, by Application 2019 & 2032
- Table 36: India Parkinson's Disease Therapeutics Industry Volume (K Unit) Forecast, by Application 2019 & 2032
- Table 37: Australia Parkinson's Disease Therapeutics Industry Revenue (Million) Forecast, by Application 2019 & 2032
- Table 38: Australia Parkinson's Disease Therapeutics Industry Volume (K Unit) Forecast, by Application 2019 & 2032
- Table 39: South Korea Parkinson's Disease Therapeutics Industry Revenue (Million) Forecast, by Application 2019 & 2032
- Table 40: South Korea Parkinson's Disease Therapeutics Industry Volume (K Unit) Forecast, by Application 2019 & 2032
- Table 41: Rest of Asia Pacific Parkinson's Disease Therapeutics Industry Revenue (Million) Forecast, by Application 2019 & 2032
- Table 42: Rest of Asia Pacific Parkinson's Disease Therapeutics Industry Volume (K Unit) Forecast, by Application 2019 & 2032
- Table 43: Global Parkinson's Disease Therapeutics Industry Revenue Million Forecast, by Country 2019 & 2032
- Table 44: Global Parkinson's Disease Therapeutics Industry Volume K Unit Forecast, by Country 2019 & 2032
- Table 45: GCC Parkinson's Disease Therapeutics Industry Revenue (Million) Forecast, by Application 2019 & 2032
- Table 46: GCC Parkinson's Disease Therapeutics Industry Volume (K Unit) Forecast, by Application 2019 & 2032
- Table 47: South Africa Parkinson's Disease Therapeutics Industry Revenue (Million) Forecast, by Application 2019 & 2032
- Table 48: South Africa Parkinson's Disease Therapeutics Industry Volume (K Unit) Forecast, by Application 2019 & 2032
- Table 49: Rest of Middle East and Africa Parkinson's Disease Therapeutics Industry Revenue (Million) Forecast, by Application 2019 & 2032
- Table 50: Rest of Middle East and Africa Parkinson's Disease Therapeutics Industry Volume (K Unit) Forecast, by Application 2019 & 2032
- Table 51: Global Parkinson's Disease Therapeutics Industry Revenue Million Forecast, by Country 2019 & 2032
- Table 52: Global Parkinson's Disease Therapeutics Industry Volume K Unit Forecast, by Country 2019 & 2032
- Table 53: Brazil Parkinson's Disease Therapeutics Industry Revenue (Million) Forecast, by Application 2019 & 2032
- Table 54: Brazil Parkinson's Disease Therapeutics Industry Volume (K Unit) Forecast, by Application 2019 & 2032
- Table 55: Argentina Parkinson's Disease Therapeutics Industry Revenue (Million) Forecast, by Application 2019 & 2032
- Table 56: Argentina Parkinson's Disease Therapeutics Industry Volume (K Unit) Forecast, by Application 2019 & 2032
- Table 57: Rest of South America Parkinson's Disease Therapeutics Industry Revenue (Million) Forecast, by Application 2019 & 2032
- Table 58: Rest of South America Parkinson's Disease Therapeutics Industry Volume (K Unit) Forecast, by Application 2019 & 2032
- Table 59: Global Parkinson's Disease Therapeutics Industry Revenue Million Forecast, by Mechanism of Action 2019 & 2032
- Table 60: Global Parkinson's Disease Therapeutics Industry Volume K Unit Forecast, by Mechanism of Action 2019 & 2032
- Table 61: Global Parkinson's Disease Therapeutics Industry Revenue Million Forecast, by Country 2019 & 2032
- Table 62: Global Parkinson's Disease Therapeutics Industry Volume K Unit Forecast, by Country 2019 & 2032
- Table 63: United States Parkinson's Disease Therapeutics Industry Revenue (Million) Forecast, by Application 2019 & 2032
- Table 64: United States Parkinson's Disease Therapeutics Industry Volume (K Unit) Forecast, by Application 2019 & 2032
- Table 65: Canada Parkinson's Disease Therapeutics Industry Revenue (Million) Forecast, by Application 2019 & 2032
- Table 66: Canada Parkinson's Disease Therapeutics Industry Volume (K Unit) Forecast, by Application 2019 & 2032
- Table 67: Mexico Parkinson's Disease Therapeutics Industry Revenue (Million) Forecast, by Application 2019 & 2032
- Table 68: Mexico Parkinson's Disease Therapeutics Industry Volume (K Unit) Forecast, by Application 2019 & 2032
- Table 69: Global Parkinson's Disease Therapeutics Industry Revenue Million Forecast, by Mechanism of Action 2019 & 2032
- Table 70: Global Parkinson's Disease Therapeutics Industry Volume K Unit Forecast, by Mechanism of Action 2019 & 2032
- Table 71: Global Parkinson's Disease Therapeutics Industry Revenue Million Forecast, by Country 2019 & 2032
- Table 72: Global Parkinson's Disease Therapeutics Industry Volume K Unit Forecast, by Country 2019 & 2032
- Table 73: Germany Parkinson's Disease Therapeutics Industry Revenue (Million) Forecast, by Application 2019 & 2032
- Table 74: Germany Parkinson's Disease Therapeutics Industry Volume (K Unit) Forecast, by Application 2019 & 2032
- Table 75: United Kingdom Parkinson's Disease Therapeutics Industry Revenue (Million) Forecast, by Application 2019 & 2032
- Table 76: United Kingdom Parkinson's Disease Therapeutics Industry Volume (K Unit) Forecast, by Application 2019 & 2032
- Table 77: France Parkinson's Disease Therapeutics Industry Revenue (Million) Forecast, by Application 2019 & 2032
- Table 78: France Parkinson's Disease Therapeutics Industry Volume (K Unit) Forecast, by Application 2019 & 2032
- Table 79: Italy Parkinson's Disease Therapeutics Industry Revenue (Million) Forecast, by Application 2019 & 2032
- Table 80: Italy Parkinson's Disease Therapeutics Industry Volume (K Unit) Forecast, by Application 2019 & 2032
- Table 81: Spain Parkinson's Disease Therapeutics Industry Revenue (Million) Forecast, by Application 2019 & 2032
- Table 82: Spain Parkinson's Disease Therapeutics Industry Volume (K Unit) Forecast, by Application 2019 & 2032
- Table 83: Rest of Europe Parkinson's Disease Therapeutics Industry Revenue (Million) Forecast, by Application 2019 & 2032
- Table 84: Rest of Europe Parkinson's Disease Therapeutics Industry Volume (K Unit) Forecast, by Application 2019 & 2032
- Table 85: Global Parkinson's Disease Therapeutics Industry Revenue Million Forecast, by Mechanism of Action 2019 & 2032
- Table 86: Global Parkinson's Disease Therapeutics Industry Volume K Unit Forecast, by Mechanism of Action 2019 & 2032
- Table 87: Global Parkinson's Disease Therapeutics Industry Revenue Million Forecast, by Country 2019 & 2032
- Table 88: Global Parkinson's Disease Therapeutics Industry Volume K Unit Forecast, by Country 2019 & 2032
- Table 89: China Parkinson's Disease Therapeutics Industry Revenue (Million) Forecast, by Application 2019 & 2032
- Table 90: China Parkinson's Disease Therapeutics Industry Volume (K Unit) Forecast, by Application 2019 & 2032
- Table 91: Japan Parkinson's Disease Therapeutics Industry Revenue (Million) Forecast, by Application 2019 & 2032
- Table 92: Japan Parkinson's Disease Therapeutics Industry Volume (K Unit) Forecast, by Application 2019 & 2032
- Table 93: India Parkinson's Disease Therapeutics Industry Revenue (Million) Forecast, by Application 2019 & 2032
- Table 94: India Parkinson's Disease Therapeutics Industry Volume (K Unit) Forecast, by Application 2019 & 2032
- Table 95: Australia Parkinson's Disease Therapeutics Industry Revenue (Million) Forecast, by Application 2019 & 2032
- Table 96: Australia Parkinson's Disease Therapeutics Industry Volume (K Unit) Forecast, by Application 2019 & 2032
- Table 97: South Korea Parkinson's Disease Therapeutics Industry Revenue (Million) Forecast, by Application 2019 & 2032
- Table 98: South Korea Parkinson's Disease Therapeutics Industry Volume (K Unit) Forecast, by Application 2019 & 2032
- Table 99: Rest of Asia Pacific Parkinson's Disease Therapeutics Industry Revenue (Million) Forecast, by Application 2019 & 2032
- Table 100: Rest of Asia Pacific Parkinson's Disease Therapeutics Industry Volume (K Unit) Forecast, by Application 2019 & 2032
- Table 101: Global Parkinson's Disease Therapeutics Industry Revenue Million Forecast, by Mechanism of Action 2019 & 2032
- Table 102: Global Parkinson's Disease Therapeutics Industry Volume K Unit Forecast, by Mechanism of Action 2019 & 2032
- Table 103: Global Parkinson's Disease Therapeutics Industry Revenue Million Forecast, by Country 2019 & 2032
- Table 104: Global Parkinson's Disease Therapeutics Industry Volume K Unit Forecast, by Country 2019 & 2032
- Table 105: GCC Parkinson's Disease Therapeutics Industry Revenue (Million) Forecast, by Application 2019 & 2032
- Table 106: GCC Parkinson's Disease Therapeutics Industry Volume (K Unit) Forecast, by Application 2019 & 2032
- Table 107: South Africa Parkinson's Disease Therapeutics Industry Revenue (Million) Forecast, by Application 2019 & 2032
- Table 108: South Africa Parkinson's Disease Therapeutics Industry Volume (K Unit) Forecast, by Application 2019 & 2032
- Table 109: Rest of Middle East and Africa Parkinson's Disease Therapeutics Industry Revenue (Million) Forecast, by Application 2019 & 2032
- Table 110: Rest of Middle East and Africa Parkinson's Disease Therapeutics Industry Volume (K Unit) Forecast, by Application 2019 & 2032
- Table 111: Global Parkinson's Disease Therapeutics Industry Revenue Million Forecast, by Mechanism of Action 2019 & 2032
- Table 112: Global Parkinson's Disease Therapeutics Industry Volume K Unit Forecast, by Mechanism of Action 2019 & 2032
- Table 113: Global Parkinson's Disease Therapeutics Industry Revenue Million Forecast, by Country 2019 & 2032
- Table 114: Global Parkinson's Disease Therapeutics Industry Volume K Unit Forecast, by Country 2019 & 2032
- Table 115: Brazil Parkinson's Disease Therapeutics Industry Revenue (Million) Forecast, by Application 2019 & 2032
- Table 116: Brazil Parkinson's Disease Therapeutics Industry Volume (K Unit) Forecast, by Application 2019 & 2032
- Table 117: Argentina Parkinson's Disease Therapeutics Industry Revenue (Million) Forecast, by Application 2019 & 2032
- Table 118: Argentina Parkinson's Disease Therapeutics Industry Volume (K Unit) Forecast, by Application 2019 & 2032
- Table 119: Rest of South America Parkinson's Disease Therapeutics Industry Revenue (Million) Forecast, by Application 2019 & 2032
- Table 120: Rest of South America Parkinson's Disease Therapeutics Industry Volume (K Unit) Forecast, by Application 2019 & 2032
Frequently Asked Questions
1. What is the projected Compound Annual Growth Rate (CAGR) of the Parkinson's Disease Therapeutics Industry?
The projected CAGR is approximately 3.58%.
2. Which companies are prominent players in the Parkinson's Disease Therapeutics Industry?
Key companies in the market include Boehringer Ingelheim International GmbH, Novartis AG, F Hoffmann-La Roche Ltd, ABL bio, AstraZeneca, Teva Pharmaceuticals Industries Ltd, Prevail Therapeutics, Kissei Pharmaceutical Co Ltd, Newron Pharmaceuticals SPA, Viatris, AbbVie Inc, GSK plc, Amneal Pharmaceuticals LLC, Pfizer Inc.
3. What are the main segments of the Parkinson's Disease Therapeutics Industry?
The market segments include Mechanism of Action.
4. Can you provide details about the market size?
The market size is estimated to be USD 5.56 Million as of 2022.
5. What are some drivers contributing to market growth?
Rising Geriatric Population and Burden of Parkinson's Disease; Growing Awareness Among the Population; Increasing R&D and Continuous Drug Approvals.
6. What are the notable trends driving market growth?
MAO-B inhibitors Segment is Expected to Dominate the Market Over the Forecast Period.
7. Are there any restraints impacting market growth?
Adverse Events Associated with Therapeutics; High Cost of Treatments Followed by Extremely High R&D Expenditure.
8. Can you provide examples of recent developments in the market?
In March 2022, Neuron23 raised USD 100 million to advance Parkinson's disease therapy. The company intends to commence the trials of NEU-723 to potentially treat Parkinson's disease by the end of this year.
9. What pricing options are available for accessing the report?
Pricing options include single-user, multi-user, and enterprise licenses priced at USD 4750, USD 5250, and USD 8750 respectively.
10. Is the market size provided in terms of value or volume?
The market size is provided in terms of value, measured in Million and volume, measured in K Unit.
11. Are there any specific market keywords associated with the report?
Yes, the market keyword associated with the report is "Parkinson's Disease Therapeutics Industry," which aids in identifying and referencing the specific market segment covered.
12. How do I determine which pricing option suits my needs best?
The pricing options vary based on user requirements and access needs. Individual users may opt for single-user licenses, while businesses requiring broader access may choose multi-user or enterprise licenses for cost-effective access to the report.
13. Are there any additional resources or data provided in the Parkinson's Disease Therapeutics Industry report?
While the report offers comprehensive insights, it's advisable to review the specific contents or supplementary materials provided to ascertain if additional resources or data are available.
14. How can I stay updated on further developments or reports in the Parkinson's Disease Therapeutics Industry?
To stay informed about further developments, trends, and reports in the Parkinson's Disease Therapeutics Industry, consider subscribing to industry newsletters, following relevant companies and organizations, or regularly checking reputable industry news sources and publications.
Methodology
Step 1 - Identification of Relevant Samples Size from Population Database


Step 2 - Approaches for Defining Global Market Size (Value, Volume* & Price*)

Note*: In applicable scenarios
Step 3 - Data Sources
Primary Research
- Web Analytics
- Survey Reports
- Research Institute
- Latest Research Reports
- Opinion Leaders
Secondary Research
- Annual Reports
- White Paper
- Latest Press Release
- Industry Association
- Paid Database
- Investor Presentations

Step 4 - Data Triangulation
Involves using different sources of information in order to increase the validity of a study
These sources are likely to be stakeholders in a program - participants, other researchers, program staff, other community members, and so on.
Then we put all data in single framework & apply various statistical tools to find out the dynamic on the market.
During the analysis stage, feedback from the stakeholder groups would be compared to determine areas of agreement as well as areas of divergence


