

Key Insights
The global Partially Hydrolyzed PVA market is poised for robust expansion, projected to reach $1327.1 million in 2025, driven by a healthy CAGR of 6.54% through 2033. This significant growth is underpinned by escalating demand across diverse applications, most notably in the chemical industry, where its unique properties as a binder, emulsifier, and protective colloid are highly valued. The adhesive sector also presents a substantial opportunity, leveraging Partially Hydrolyzed PVA for its excellent tack and cohesive strength in various bonding applications. Furthermore, its increasing utility in the textile industry for warp sizing and finishing, as well as in paper manufacturing for improved strength and printability, are key growth catalysts. The pharmaceutical industry's adoption for drug delivery systems and tablet coatings further diversifies its market penetration.

Partially Hydrolyzed PVA Market Size (In Billion)
The market's trajectory is further shaped by key trends such as the development of advanced grades with tailored hydrolysis degrees, catering to specific end-user requirements. Innovations in production processes are also contributing to improved product quality and cost-effectiveness. While the market exhibits strong growth potential, it faces certain restraints. Fluctuations in raw material prices, particularly for vinyl acetate monomer, can impact profit margins. Additionally, the development of alternative synthetic polymers and increasing environmental regulations regarding chemical usage might pose challenges. However, the inherent versatility and cost-effectiveness of Partially Hydrolyzed PVA, coupled with ongoing research and development efforts to enhance its sustainability profile, are expected to mitigate these restraints and propel sustained market growth. The market is segmented by degree of hydrolysis, with both above and below 85.0% showing distinct application niches and growth rates, reflecting the market's adaptability to specific performance demands.

Partially Hydrolyzed PVA Company Market Share
Unlock critical insights into the global Partially Hydrolyzed PVA (PH-PVA) market with this in-depth, data-driven report. Covering the historical period of 2019-2024, the base year of 2025, and a robust forecast period extending to 2033, this research provides unparalleled intelligence for industry stakeholders. We delve into market structure, dynamics, regional dominance, product innovations, key drivers, challenges, emerging opportunities, leading players, and pivotal industry developments. This report is essential for understanding the evolving landscape of PH-PVA, a crucial material with widespread applications across chemical, adhesive, textile, paper, and pharmaceutical industries.
Partially Hydrolyzed PVA Market Structure & Innovation Trends
The Partially Hydrolyzed PVA market exhibits a moderately concentrated structure, with a few key global players holding significant market share. These include Sekisui Chemical Co. Ltd., Kuraray Co. Ltd., and Sinopec Sichuan Vinylon, among others. Innovation is a critical differentiator, driven by advancements in polymerization techniques and a growing demand for specialized PH-PVA grades with tailored properties for high-performance applications. Key innovation drivers include the development of PH-PVA with enhanced water solubility, superior adhesion, and improved biodegradability. Regulatory frameworks, particularly concerning environmental impact and chemical safety, are increasingly influencing product development and market entry. The threat of product substitutes, while present in some niche applications, is generally low due to PH-PVA's unique combination of properties. End-user demographics are shifting towards industries prioritizing sustainability and performance efficiency. Mergers and Acquisitions (M&A) activities, valued in the hundreds of millions, are strategically employed by major players to expand geographical reach, acquire new technologies, and consolidate market positions.
- Market Concentration: Moderately concentrated, with leading players dominating significant market share.
- Innovation Drivers: Enhanced water solubility, superior adhesion, biodegradability, specialized grades.
- Regulatory Impact: Increasing influence on product development and market access.
- M&A Activity: Strategic consolidation and technology acquisition, with deal values in the hundreds of millions.
Partially Hydrolyzed PVA Market Dynamics & Trends
The global Partially Hydrolyzed PVA market is projected to experience robust growth, driven by an expanding array of applications and increasing industrialization worldwide. The market is anticipated to witness a Compound Annual Growth Rate (CAGR) of xx% between 2025 and 2033. A primary growth driver is the escalating demand from the chemical industry, where PH-PVA serves as a vital intermediate and additive in the production of various chemicals and polymers. The adhesive industry also presents significant opportunities, with PH-PVA’s excellent binding properties making it indispensable in the formulation of high-performance adhesives for packaging, construction, and automotive sectors. Technological disruptions, such as advancements in synthesis methods leading to more cost-effective production and the development of novel PH-PVA grades with enhanced functionalities, are actively shaping market dynamics. Consumer preferences are increasingly leaning towards eco-friendly and sustainable materials, pushing manufacturers to develop bio-based or biodegradable PH-PVA alternatives. The competitive landscape is characterized by intense R&D efforts and strategic partnerships aimed at gaining market penetration. The market penetration of PH-PVA is expected to rise, particularly in emerging economies where industrial growth is rapid. The textile industry’s demand for sizing agents and finishing treatments, coupled with the paper industry’s need for surface sizing and coating binders, further fuels market expansion. Pharmaceutical applications, though smaller in volume, are witnessing growth due to PH-PVA's use in drug delivery systems and excipients. The forecast for market growth is highly optimistic, supported by ongoing innovation and a broadening application base.
Dominant Regions & Segments in Partially Hydrolyzed PVA
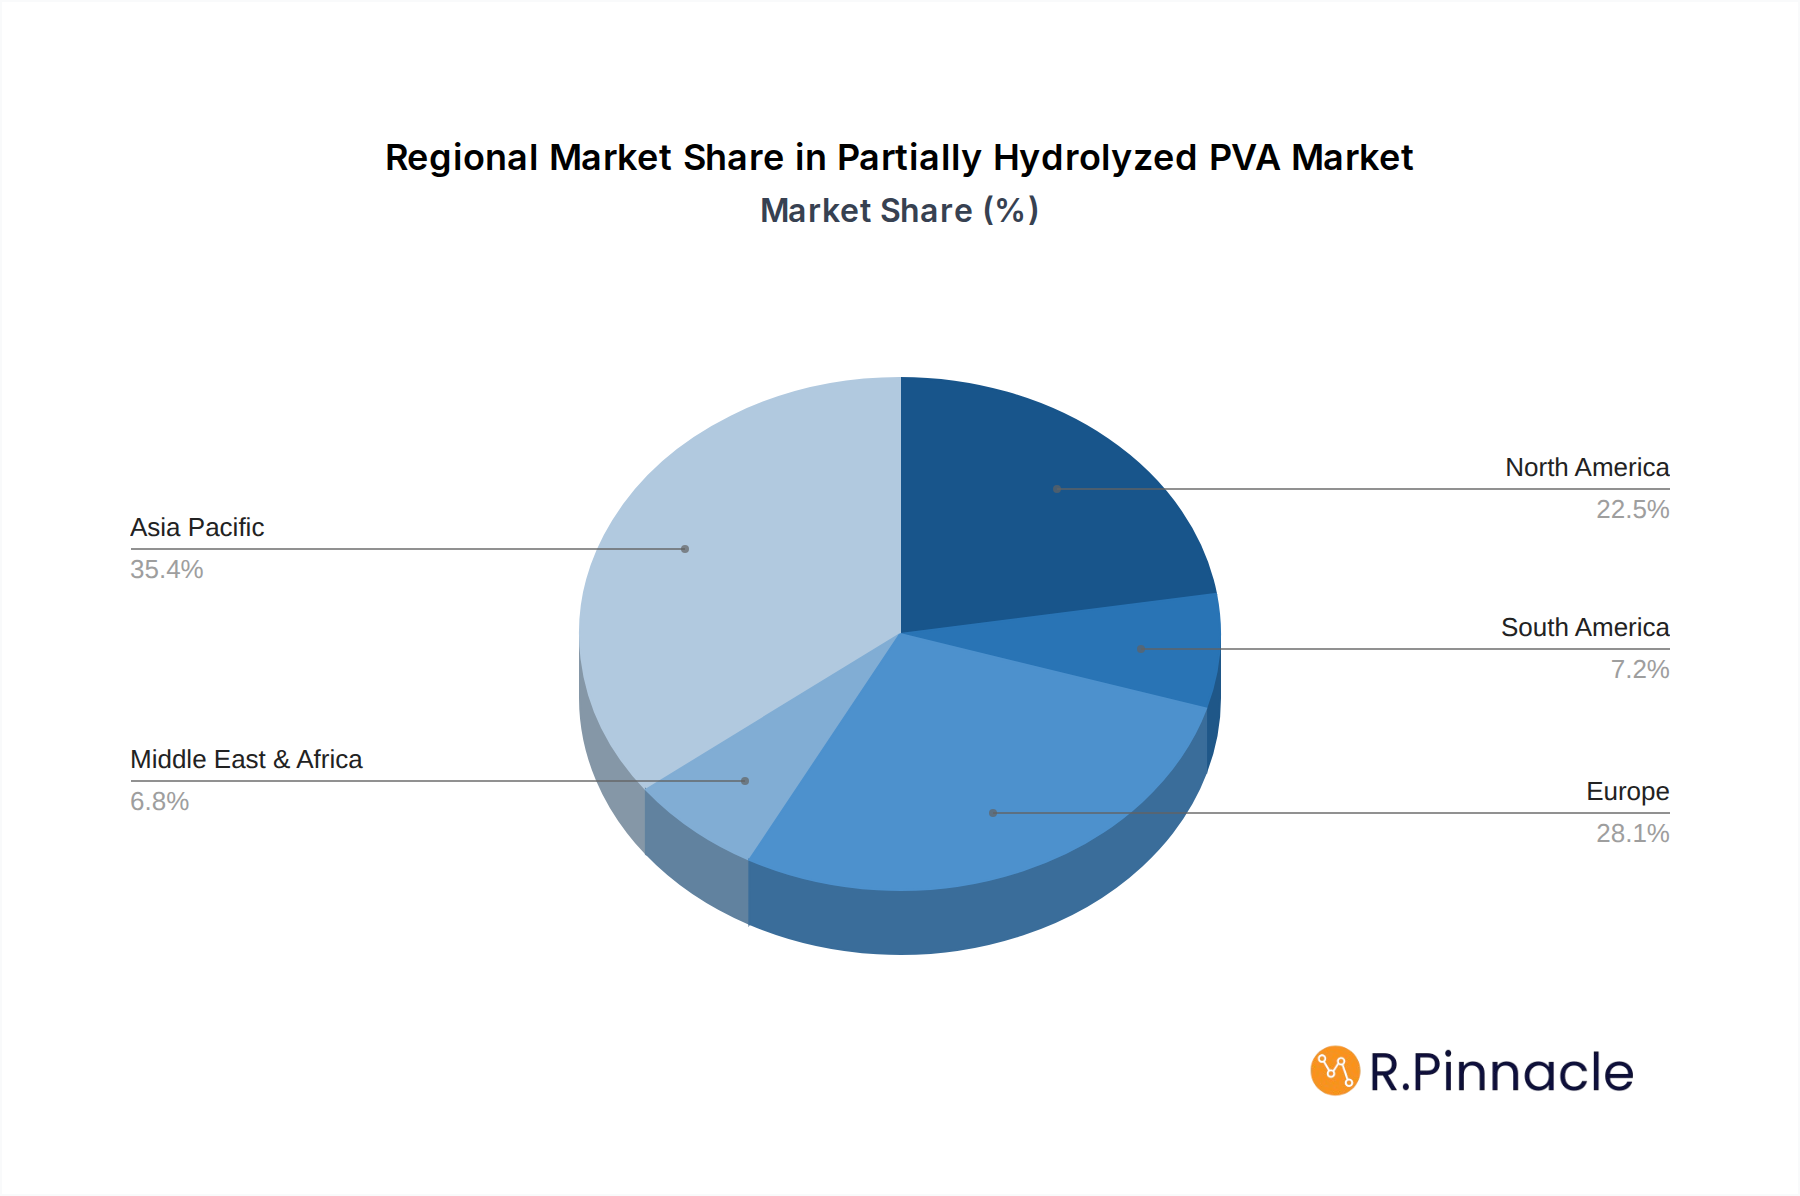
The Asia Pacific region stands as the dominant force in the global Partially Hydrolyzed PVA market, driven by robust industrial growth, a burgeoning manufacturing sector, and significant investments in infrastructure. Countries like China, with its vast chemical and manufacturing capabilities, and Japan, a leader in advanced materials and technological innovation, are key contributors to this regional dominance. The Chemical Industry segment is the largest application, accounting for an estimated xx% of the total market share in 2025, owing to PH-PVA's critical role as a raw material and processing aid in numerous chemical synthesis processes.
- Leading Region: Asia Pacific
- Key Drivers: Rapid industrialization, strong manufacturing base, substantial infrastructure investments, increasing domestic demand.
- Dominant Countries: China, Japan, South Korea, India.
- Leading Application Segment: Chemical Industry
- Drivers: Versatile use as a binder, emulsifier, and protective colloid; demand in polymer production and specialty chemicals.
- Market Size (2025): Estimated at xx million USD.
- Dominant Type Segment: Degree of Hydrolysis above 85.0 %
- Drivers: Superior water solubility and film-forming properties make it ideal for high-performance applications in adhesives and textiles.
- Market Share (2025): Anticipated to capture xx% of the market.
- Key Growth Segments:
- Adhesive Industry: Driven by demand in packaging, construction, and automotive.
- Textile Industry: Essential for warp sizing and finishing.
- Paper Industry: Used in surface sizing and coating for improved printability and strength.
Partially Hydrolyzed PVA Product Innovations
Recent product innovations in the Partially Hydrolyzed PVA sector focus on developing grades with enhanced performance characteristics and expanded application potential. Key developments include the creation of low-viscosity PH-PVA for improved processing in high-speed textile operations and the introduction of environmentally friendly PH-PVA variants with reduced volatile organic compounds (VOCs). These innovations are driven by a need for greater efficiency, sustainability, and adherence to stringent environmental regulations. The competitive advantage lies in offering customized solutions that meet specific end-user requirements, such as improved adhesion in challenging substrates or enhanced water resistance in paper coatings. These advancements are crucial for maintaining market relevance and capturing new opportunities.
Report Scope & Segmentation Analysis
This comprehensive report segments the Partially Hydrolyzed PVA market across key applications and product types.
- Application Segments:
- Chemical Industry: Encompasses its use as an intermediate, binder, and additive in various chemical processes. Market size in 2025 is estimated at xx million USD, with a projected CAGR of xx% during the forecast period.
- Adhesive Industry: Focuses on its role in formulating industrial and consumer adhesives. Expected market size of xx million USD in 2025, growing at xx% CAGR.
- Textile Industry: Covers its application in warp sizing, finishing, and printing. Market size in 2025 estimated at xx million USD, with a CAGR of xx%.
- Paper Industry: Includes its use in surface sizing and coating. Projected market size of xx million USD in 2025, with xx% CAGR.
- Pharmaceutical Industry: Addresses its application in drug delivery and excipients. Expected market size of xx million USD in 2025, with a CAGR of xx%.
- Other: Captures miscellaneous applications.
- Type Segments:
- Degree of Hydrolysis above 85.0 %: Characterized by higher water solubility and film-forming capabilities. Anticipated market size of xx million USD in 2025, growing at xx% CAGR.
- Degree of Hydrolysis below 85.0 %: Offers different solubility and viscosity profiles. Projected market size of xx million USD in 2025, with xx% CAGR.
Key Drivers of Partially Hydrolyzed PVA Growth
The growth of the Partially Hydrolyzed PVA market is propelled by several interconnected factors. Firstly, the escalating demand for high-performance adhesives across various industries, including packaging, construction, and automotive, significantly boosts PH-PVA consumption. Secondly, the expanding textile industry, particularly in emerging economies, drives demand for PH-PVA as a crucial warp sizing agent, enhancing yarn strength and reducing breakage during weaving. Thirdly, advancements in manufacturing technologies that improve the efficiency and cost-effectiveness of PH-PVA production contribute to its broader adoption. Furthermore, increasing environmental consciousness and regulatory pushes towards sustainable materials are creating opportunities for specialized, eco-friendly PH-PVA grades. The steady growth in the paper industry, requiring improved paper quality and printability, also underpins demand.
Challenges in the Partially Hydrolyzed PVA Sector
Despite its growth potential, the Partially Hydrolyzed PVA sector faces several challenges. Fluctuations in raw material prices, primarily vinyl acetate monomer (VAM), can impact production costs and profitability. Stringent environmental regulations and evolving waste management policies in different regions can necessitate significant investment in compliance and process upgrades. Supply chain disruptions, as witnessed in recent global events, can affect the availability and timely delivery of PH-PVA, impacting downstream industries. Intense competition from both established players and emerging manufacturers can lead to price pressures and reduced profit margins. The development and adoption of alternative materials in specific applications also pose a competitive threat.
Emerging Opportunities in Partially Hydrolyzed PVA
The Partially Hydrolyzed PVA market is ripe with emerging opportunities. The growing demand for sustainable and biodegradable materials presents a significant avenue for innovation, with the development of bio-based PH-PVA gaining traction. Expansion into new geographic markets, particularly in developing economies with nascent industrial sectors, offers substantial growth potential. The increasing adoption of advanced manufacturing techniques and smart technologies within the PH-PVA production process can lead to enhanced efficiency and cost savings. Furthermore, research into novel applications, such as in advanced composites, 3D printing materials, and specialized coatings, could unlock entirely new market segments. The pharmaceutical sector, with its continuous need for advanced excipients and drug delivery systems, also represents a promising growth area.
Leading Players in the Partially Hydrolyzed PVA Market
- Sekisui Chemical Co. Ltd.
- Kuraray Co. Ltd.
- Sinopec Sichuan Vinylon
- Synthomer
- JAPAN VAM & POVAL CO.,LTD.
- Anhui Wanwei Group Co.,Ltd.
- SNP, Inc.
- Mitsubishi Chemical Corporation
- Chang Chun Group
- Denka Company Limited
- Shuangxin
- NINGXIA DADI CIRCULAR
Key Developments in Partially Hydrolyzed PVA Industry
- 2023/09: Kuraray Co. Ltd. launched a new grade of polyvinyl alcohol (PVA) with enhanced biodegradability, targeting eco-conscious applications.
- 2022/05: Sekisui Chemical Co. Ltd. announced an expansion of its PH-PVA production capacity to meet growing demand in Asia.
- 2021/11: Sinopec Sichuan Vinylon invested in R&D for high-performance PH-PVA for the automotive sector.
- 2020/07: Synthomer acquired a specialized chemical company, expanding its portfolio in adhesive raw materials.
- 2019/02: Mitsubishi Chemical Corporation introduced a new PH-PVA variant with improved water resistance for paper coating applications.
Future Outlook for Partially Hydrolyzed PVA Market
The future outlook for the Partially Hydrolyzed PVA market is exceptionally positive, driven by sustained demand across its core applications and the emergence of innovative uses. Continued investment in R&D will fuel the development of next-generation PH-PVA products with superior performance and environmental profiles, such as fully biodegradable or bio-based variants. The increasing focus on sustainability and circular economy principles will likely see further adoption of PH-PVA in applications requiring reduced environmental impact. Expansion into untapped geographical markets and diversification into niche, high-value applications will be key growth accelerators. Strategic collaborations and M&A activities are expected to continue shaping the competitive landscape, leading to market consolidation and enhanced technological capabilities. The PH-PVA market is poised for significant growth, offering attractive strategic opportunities for stakeholders.
Partially Hydrolyzed PVA Segmentation
-
1. Application
- 1.1. Chemical Industry
- 1.2. Adhesive Industry
- 1.3. Textile Industry
- 1.4. Paper Industry
- 1.5. Pharmaceutical Industry
- 1.6. Other
-
2. Types
- 2.1. Degree of Hydrolysis above 85.0 %
- 2.2. Degree of Hydrolysis below 85.0 %
Partially Hydrolyzed PVA Segmentation By Geography
-
1. North America
- 1.1. United States
- 1.2. Canada
- 1.3. Mexico
-
2. South America
- 2.1. Brazil
- 2.2. Argentina
- 2.3. Rest of South America
-
3. Europe
- 3.1. United Kingdom
- 3.2. Germany
- 3.3. France
- 3.4. Italy
- 3.5. Spain
- 3.6. Russia
- 3.7. Benelux
- 3.8. Nordics
- 3.9. Rest of Europe
-
4. Middle East & Africa
- 4.1. Turkey
- 4.2. Israel
- 4.3. GCC
- 4.4. North Africa
- 4.5. South Africa
- 4.6. Rest of Middle East & Africa
-
5. Asia Pacific
- 5.1. China
- 5.2. India
- 5.3. Japan
- 5.4. South Korea
- 5.5. ASEAN
- 5.6. Oceania
- 5.7. Rest of Asia Pacific
Partially Hydrolyzed PVA Regional Market Share
Geographic Coverage of Partially Hydrolyzed PVA
Partially Hydrolyzed PVA REPORT HIGHLIGHTS
| Aspects | Details |
|---|---|
| Study Period | 2020-2034 |
| Base Year | 2025 |
| Estimated Year | 2026 |
| Forecast Period | 2026-2034 |
| Historical Period | 2020-2025 |
| Growth Rate | CAGR of 6.54% from 2020-2034 |
| Segmentation |
|
Table of Contents
- 1. Introduction
- 1.1. Research Scope
- 1.2. Market Segmentation
- 1.3. Research Methodology
- 1.4. Definitions and Assumptions
- 2. Executive Summary
- 2.1. Introduction
- 3. Market Dynamics
- 3.1. Introduction
- 3.2. Market Drivers
- 3.3. Market Restrains
- 3.4. Market Trends
- 4. Market Factor Analysis
- 4.1. Porters Five Forces
- 4.2. Supply/Value Chain
- 4.3. PESTEL analysis
- 4.4. Market Entropy
- 4.5. Patent/Trademark Analysis
- 5. Global Partially Hydrolyzed PVA Analysis, Insights and Forecast, 2020-2032
- 5.1. Market Analysis, Insights and Forecast - by Application
- 5.1.1. Chemical Industry
- 5.1.2. Adhesive Industry
- 5.1.3. Textile Industry
- 5.1.4. Paper Industry
- 5.1.5. Pharmaceutical Industry
- 5.1.6. Other
- 5.2. Market Analysis, Insights and Forecast - by Types
- 5.2.1. Degree of Hydrolysis above 85.0 %
- 5.2.2. Degree of Hydrolysis below 85.0 %
- 5.3. Market Analysis, Insights and Forecast - by Region
- 5.3.1. North America
- 5.3.2. South America
- 5.3.3. Europe
- 5.3.4. Middle East & Africa
- 5.3.5. Asia Pacific
- 5.1. Market Analysis, Insights and Forecast - by Application
- 6. North America Partially Hydrolyzed PVA Analysis, Insights and Forecast, 2020-2032
- 6.1. Market Analysis, Insights and Forecast - by Application
- 6.1.1. Chemical Industry
- 6.1.2. Adhesive Industry
- 6.1.3. Textile Industry
- 6.1.4. Paper Industry
- 6.1.5. Pharmaceutical Industry
- 6.1.6. Other
- 6.2. Market Analysis, Insights and Forecast - by Types
- 6.2.1. Degree of Hydrolysis above 85.0 %
- 6.2.2. Degree of Hydrolysis below 85.0 %
- 6.1. Market Analysis, Insights and Forecast - by Application
- 7. South America Partially Hydrolyzed PVA Analysis, Insights and Forecast, 2020-2032
- 7.1. Market Analysis, Insights and Forecast - by Application
- 7.1.1. Chemical Industry
- 7.1.2. Adhesive Industry
- 7.1.3. Textile Industry
- 7.1.4. Paper Industry
- 7.1.5. Pharmaceutical Industry
- 7.1.6. Other
- 7.2. Market Analysis, Insights and Forecast - by Types
- 7.2.1. Degree of Hydrolysis above 85.0 %
- 7.2.2. Degree of Hydrolysis below 85.0 %
- 7.1. Market Analysis, Insights and Forecast - by Application
- 8. Europe Partially Hydrolyzed PVA Analysis, Insights and Forecast, 2020-2032
- 8.1. Market Analysis, Insights and Forecast - by Application
- 8.1.1. Chemical Industry
- 8.1.2. Adhesive Industry
- 8.1.3. Textile Industry
- 8.1.4. Paper Industry
- 8.1.5. Pharmaceutical Industry
- 8.1.6. Other
- 8.2. Market Analysis, Insights and Forecast - by Types
- 8.2.1. Degree of Hydrolysis above 85.0 %
- 8.2.2. Degree of Hydrolysis below 85.0 %
- 8.1. Market Analysis, Insights and Forecast - by Application
- 9. Middle East & Africa Partially Hydrolyzed PVA Analysis, Insights and Forecast, 2020-2032
- 9.1. Market Analysis, Insights and Forecast - by Application
- 9.1.1. Chemical Industry
- 9.1.2. Adhesive Industry
- 9.1.3. Textile Industry
- 9.1.4. Paper Industry
- 9.1.5. Pharmaceutical Industry
- 9.1.6. Other
- 9.2. Market Analysis, Insights and Forecast - by Types
- 9.2.1. Degree of Hydrolysis above 85.0 %
- 9.2.2. Degree of Hydrolysis below 85.0 %
- 9.1. Market Analysis, Insights and Forecast - by Application
- 10. Asia Pacific Partially Hydrolyzed PVA Analysis, Insights and Forecast, 2020-2032
- 10.1. Market Analysis, Insights and Forecast - by Application
- 10.1.1. Chemical Industry
- 10.1.2. Adhesive Industry
- 10.1.3. Textile Industry
- 10.1.4. Paper Industry
- 10.1.5. Pharmaceutical Industry
- 10.1.6. Other
- 10.2. Market Analysis, Insights and Forecast - by Types
- 10.2.1. Degree of Hydrolysis above 85.0 %
- 10.2.2. Degree of Hydrolysis below 85.0 %
- 10.1. Market Analysis, Insights and Forecast - by Application
- 11. Competitive Analysis
- 11.1. Global Market Share Analysis 2025
- 11.2. Company Profiles
- 11.2.1 Sekisui Chemical Co. Ltd.
- 11.2.1.1. Overview
- 11.2.1.2. Products
- 11.2.1.3. SWOT Analysis
- 11.2.1.4. Recent Developments
- 11.2.1.5. Financials (Based on Availability)
- 11.2.2 Kuraray Co. Ltd.
- 11.2.2.1. Overview
- 11.2.2.2. Products
- 11.2.2.3. SWOT Analysis
- 11.2.2.4. Recent Developments
- 11.2.2.5. Financials (Based on Availability)
- 11.2.3 Sinopec Sichuan Vinylon
- 11.2.3.1. Overview
- 11.2.3.2. Products
- 11.2.3.3. SWOT Analysis
- 11.2.3.4. Recent Developments
- 11.2.3.5. Financials (Based on Availability)
- 11.2.4 Synthomer
- 11.2.4.1. Overview
- 11.2.4.2. Products
- 11.2.4.3. SWOT Analysis
- 11.2.4.4. Recent Developments
- 11.2.4.5. Financials (Based on Availability)
- 11.2.5 JAPAN VAM & POVAL CO.
- 11.2.5.1. Overview
- 11.2.5.2. Products
- 11.2.5.3. SWOT Analysis
- 11.2.5.4. Recent Developments
- 11.2.5.5. Financials (Based on Availability)
- 11.2.6 LTD.
- 11.2.6.1. Overview
- 11.2.6.2. Products
- 11.2.6.3. SWOT Analysis
- 11.2.6.4. Recent Developments
- 11.2.6.5. Financials (Based on Availability)
- 11.2.7 Anhui Wanwei Group Co.
- 11.2.7.1. Overview
- 11.2.7.2. Products
- 11.2.7.3. SWOT Analysis
- 11.2.7.4. Recent Developments
- 11.2.7.5. Financials (Based on Availability)
- 11.2.8 Ltd.
- 11.2.8.1. Overview
- 11.2.8.2. Products
- 11.2.8.3. SWOT Analysis
- 11.2.8.4. Recent Developments
- 11.2.8.5. Financials (Based on Availability)
- 11.2.9 SNP
- 11.2.9.1. Overview
- 11.2.9.2. Products
- 11.2.9.3. SWOT Analysis
- 11.2.9.4. Recent Developments
- 11.2.9.5. Financials (Based on Availability)
- 11.2.10 Inc.
- 11.2.10.1. Overview
- 11.2.10.2. Products
- 11.2.10.3. SWOT Analysis
- 11.2.10.4. Recent Developments
- 11.2.10.5. Financials (Based on Availability)
- 11.2.11 Mitsubishi Chemical Corporation
- 11.2.11.1. Overview
- 11.2.11.2. Products
- 11.2.11.3. SWOT Analysis
- 11.2.11.4. Recent Developments
- 11.2.11.5. Financials (Based on Availability)
- 11.2.12 Chang Chun Group
- 11.2.12.1. Overview
- 11.2.12.2. Products
- 11.2.12.3. SWOT Analysis
- 11.2.12.4. Recent Developments
- 11.2.12.5. Financials (Based on Availability)
- 11.2.13 Denka Company Limited
- 11.2.13.1. Overview
- 11.2.13.2. Products
- 11.2.13.3. SWOT Analysis
- 11.2.13.4. Recent Developments
- 11.2.13.5. Financials (Based on Availability)
- 11.2.14 Shuangxin
- 11.2.14.1. Overview
- 11.2.14.2. Products
- 11.2.14.3. SWOT Analysis
- 11.2.14.4. Recent Developments
- 11.2.14.5. Financials (Based on Availability)
- 11.2.15 NINGXIA DADI CIRCULAR
- 11.2.15.1. Overview
- 11.2.15.2. Products
- 11.2.15.3. SWOT Analysis
- 11.2.15.4. Recent Developments
- 11.2.15.5. Financials (Based on Availability)
- 11.2.1 Sekisui Chemical Co. Ltd.
List of Figures
- Figure 1: Global Partially Hydrolyzed PVA Revenue Breakdown (undefined, %) by Region 2025 & 2033
- Figure 2: Global Partially Hydrolyzed PVA Volume Breakdown (K, %) by Region 2025 & 2033
- Figure 3: North America Partially Hydrolyzed PVA Revenue (undefined), by Application 2025 & 2033
- Figure 4: North America Partially Hydrolyzed PVA Volume (K), by Application 2025 & 2033
- Figure 5: North America Partially Hydrolyzed PVA Revenue Share (%), by Application 2025 & 2033
- Figure 6: North America Partially Hydrolyzed PVA Volume Share (%), by Application 2025 & 2033
- Figure 7: North America Partially Hydrolyzed PVA Revenue (undefined), by Types 2025 & 2033
- Figure 8: North America Partially Hydrolyzed PVA Volume (K), by Types 2025 & 2033
- Figure 9: North America Partially Hydrolyzed PVA Revenue Share (%), by Types 2025 & 2033
- Figure 10: North America Partially Hydrolyzed PVA Volume Share (%), by Types 2025 & 2033
- Figure 11: North America Partially Hydrolyzed PVA Revenue (undefined), by Country 2025 & 2033
- Figure 12: North America Partially Hydrolyzed PVA Volume (K), by Country 2025 & 2033
- Figure 13: North America Partially Hydrolyzed PVA Revenue Share (%), by Country 2025 & 2033
- Figure 14: North America Partially Hydrolyzed PVA Volume Share (%), by Country 2025 & 2033
- Figure 15: South America Partially Hydrolyzed PVA Revenue (undefined), by Application 2025 & 2033
- Figure 16: South America Partially Hydrolyzed PVA Volume (K), by Application 2025 & 2033
- Figure 17: South America Partially Hydrolyzed PVA Revenue Share (%), by Application 2025 & 2033
- Figure 18: South America Partially Hydrolyzed PVA Volume Share (%), by Application 2025 & 2033
- Figure 19: South America Partially Hydrolyzed PVA Revenue (undefined), by Types 2025 & 2033
- Figure 20: South America Partially Hydrolyzed PVA Volume (K), by Types 2025 & 2033
- Figure 21: South America Partially Hydrolyzed PVA Revenue Share (%), by Types 2025 & 2033
- Figure 22: South America Partially Hydrolyzed PVA Volume Share (%), by Types 2025 & 2033
- Figure 23: South America Partially Hydrolyzed PVA Revenue (undefined), by Country 2025 & 2033
- Figure 24: South America Partially Hydrolyzed PVA Volume (K), by Country 2025 & 2033
- Figure 25: South America Partially Hydrolyzed PVA Revenue Share (%), by Country 2025 & 2033
- Figure 26: South America Partially Hydrolyzed PVA Volume Share (%), by Country 2025 & 2033
- Figure 27: Europe Partially Hydrolyzed PVA Revenue (undefined), by Application 2025 & 2033
- Figure 28: Europe Partially Hydrolyzed PVA Volume (K), by Application 2025 & 2033
- Figure 29: Europe Partially Hydrolyzed PVA Revenue Share (%), by Application 2025 & 2033
- Figure 30: Europe Partially Hydrolyzed PVA Volume Share (%), by Application 2025 & 2033
- Figure 31: Europe Partially Hydrolyzed PVA Revenue (undefined), by Types 2025 & 2033
- Figure 32: Europe Partially Hydrolyzed PVA Volume (K), by Types 2025 & 2033
- Figure 33: Europe Partially Hydrolyzed PVA Revenue Share (%), by Types 2025 & 2033
- Figure 34: Europe Partially Hydrolyzed PVA Volume Share (%), by Types 2025 & 2033
- Figure 35: Europe Partially Hydrolyzed PVA Revenue (undefined), by Country 2025 & 2033
- Figure 36: Europe Partially Hydrolyzed PVA Volume (K), by Country 2025 & 2033
- Figure 37: Europe Partially Hydrolyzed PVA Revenue Share (%), by Country 2025 & 2033
- Figure 38: Europe Partially Hydrolyzed PVA Volume Share (%), by Country 2025 & 2033
- Figure 39: Middle East & Africa Partially Hydrolyzed PVA Revenue (undefined), by Application 2025 & 2033
- Figure 40: Middle East & Africa Partially Hydrolyzed PVA Volume (K), by Application 2025 & 2033
- Figure 41: Middle East & Africa Partially Hydrolyzed PVA Revenue Share (%), by Application 2025 & 2033
- Figure 42: Middle East & Africa Partially Hydrolyzed PVA Volume Share (%), by Application 2025 & 2033
- Figure 43: Middle East & Africa Partially Hydrolyzed PVA Revenue (undefined), by Types 2025 & 2033
- Figure 44: Middle East & Africa Partially Hydrolyzed PVA Volume (K), by Types 2025 & 2033
- Figure 45: Middle East & Africa Partially Hydrolyzed PVA Revenue Share (%), by Types 2025 & 2033
- Figure 46: Middle East & Africa Partially Hydrolyzed PVA Volume Share (%), by Types 2025 & 2033
- Figure 47: Middle East & Africa Partially Hydrolyzed PVA Revenue (undefined), by Country 2025 & 2033
- Figure 48: Middle East & Africa Partially Hydrolyzed PVA Volume (K), by Country 2025 & 2033
- Figure 49: Middle East & Africa Partially Hydrolyzed PVA Revenue Share (%), by Country 2025 & 2033
- Figure 50: Middle East & Africa Partially Hydrolyzed PVA Volume Share (%), by Country 2025 & 2033
- Figure 51: Asia Pacific Partially Hydrolyzed PVA Revenue (undefined), by Application 2025 & 2033
- Figure 52: Asia Pacific Partially Hydrolyzed PVA Volume (K), by Application 2025 & 2033
- Figure 53: Asia Pacific Partially Hydrolyzed PVA Revenue Share (%), by Application 2025 & 2033
- Figure 54: Asia Pacific Partially Hydrolyzed PVA Volume Share (%), by Application 2025 & 2033
- Figure 55: Asia Pacific Partially Hydrolyzed PVA Revenue (undefined), by Types 2025 & 2033
- Figure 56: Asia Pacific Partially Hydrolyzed PVA Volume (K), by Types 2025 & 2033
- Figure 57: Asia Pacific Partially Hydrolyzed PVA Revenue Share (%), by Types 2025 & 2033
- Figure 58: Asia Pacific Partially Hydrolyzed PVA Volume Share (%), by Types 2025 & 2033
- Figure 59: Asia Pacific Partially Hydrolyzed PVA Revenue (undefined), by Country 2025 & 2033
- Figure 60: Asia Pacific Partially Hydrolyzed PVA Volume (K), by Country 2025 & 2033
- Figure 61: Asia Pacific Partially Hydrolyzed PVA Revenue Share (%), by Country 2025 & 2033
- Figure 62: Asia Pacific Partially Hydrolyzed PVA Volume Share (%), by Country 2025 & 2033
List of Tables
- Table 1: Global Partially Hydrolyzed PVA Revenue undefined Forecast, by Application 2020 & 2033
- Table 2: Global Partially Hydrolyzed PVA Volume K Forecast, by Application 2020 & 2033
- Table 3: Global Partially Hydrolyzed PVA Revenue undefined Forecast, by Types 2020 & 2033
- Table 4: Global Partially Hydrolyzed PVA Volume K Forecast, by Types 2020 & 2033
- Table 5: Global Partially Hydrolyzed PVA Revenue undefined Forecast, by Region 2020 & 2033
- Table 6: Global Partially Hydrolyzed PVA Volume K Forecast, by Region 2020 & 2033
- Table 7: Global Partially Hydrolyzed PVA Revenue undefined Forecast, by Application 2020 & 2033
- Table 8: Global Partially Hydrolyzed PVA Volume K Forecast, by Application 2020 & 2033
- Table 9: Global Partially Hydrolyzed PVA Revenue undefined Forecast, by Types 2020 & 2033
- Table 10: Global Partially Hydrolyzed PVA Volume K Forecast, by Types 2020 & 2033
- Table 11: Global Partially Hydrolyzed PVA Revenue undefined Forecast, by Country 2020 & 2033
- Table 12: Global Partially Hydrolyzed PVA Volume K Forecast, by Country 2020 & 2033
- Table 13: United States Partially Hydrolyzed PVA Revenue (undefined) Forecast, by Application 2020 & 2033
- Table 14: United States Partially Hydrolyzed PVA Volume (K) Forecast, by Application 2020 & 2033
- Table 15: Canada Partially Hydrolyzed PVA Revenue (undefined) Forecast, by Application 2020 & 2033
- Table 16: Canada Partially Hydrolyzed PVA Volume (K) Forecast, by Application 2020 & 2033
- Table 17: Mexico Partially Hydrolyzed PVA Revenue (undefined) Forecast, by Application 2020 & 2033
- Table 18: Mexico Partially Hydrolyzed PVA Volume (K) Forecast, by Application 2020 & 2033
- Table 19: Global Partially Hydrolyzed PVA Revenue undefined Forecast, by Application 2020 & 2033
- Table 20: Global Partially Hydrolyzed PVA Volume K Forecast, by Application 2020 & 2033
- Table 21: Global Partially Hydrolyzed PVA Revenue undefined Forecast, by Types 2020 & 2033
- Table 22: Global Partially Hydrolyzed PVA Volume K Forecast, by Types 2020 & 2033
- Table 23: Global Partially Hydrolyzed PVA Revenue undefined Forecast, by Country 2020 & 2033
- Table 24: Global Partially Hydrolyzed PVA Volume K Forecast, by Country 2020 & 2033
- Table 25: Brazil Partially Hydrolyzed PVA Revenue (undefined) Forecast, by Application 2020 & 2033
- Table 26: Brazil Partially Hydrolyzed PVA Volume (K) Forecast, by Application 2020 & 2033
- Table 27: Argentina Partially Hydrolyzed PVA Revenue (undefined) Forecast, by Application 2020 & 2033
- Table 28: Argentina Partially Hydrolyzed PVA Volume (K) Forecast, by Application 2020 & 2033
- Table 29: Rest of South America Partially Hydrolyzed PVA Revenue (undefined) Forecast, by Application 2020 & 2033
- Table 30: Rest of South America Partially Hydrolyzed PVA Volume (K) Forecast, by Application 2020 & 2033
- Table 31: Global Partially Hydrolyzed PVA Revenue undefined Forecast, by Application 2020 & 2033
- Table 32: Global Partially Hydrolyzed PVA Volume K Forecast, by Application 2020 & 2033
- Table 33: Global Partially Hydrolyzed PVA Revenue undefined Forecast, by Types 2020 & 2033
- Table 34: Global Partially Hydrolyzed PVA Volume K Forecast, by Types 2020 & 2033
- Table 35: Global Partially Hydrolyzed PVA Revenue undefined Forecast, by Country 2020 & 2033
- Table 36: Global Partially Hydrolyzed PVA Volume K Forecast, by Country 2020 & 2033
- Table 37: United Kingdom Partially Hydrolyzed PVA Revenue (undefined) Forecast, by Application 2020 & 2033
- Table 38: United Kingdom Partially Hydrolyzed PVA Volume (K) Forecast, by Application 2020 & 2033
- Table 39: Germany Partially Hydrolyzed PVA Revenue (undefined) Forecast, by Application 2020 & 2033
- Table 40: Germany Partially Hydrolyzed PVA Volume (K) Forecast, by Application 2020 & 2033
- Table 41: France Partially Hydrolyzed PVA Revenue (undefined) Forecast, by Application 2020 & 2033
- Table 42: France Partially Hydrolyzed PVA Volume (K) Forecast, by Application 2020 & 2033
- Table 43: Italy Partially Hydrolyzed PVA Revenue (undefined) Forecast, by Application 2020 & 2033
- Table 44: Italy Partially Hydrolyzed PVA Volume (K) Forecast, by Application 2020 & 2033
- Table 45: Spain Partially Hydrolyzed PVA Revenue (undefined) Forecast, by Application 2020 & 2033
- Table 46: Spain Partially Hydrolyzed PVA Volume (K) Forecast, by Application 2020 & 2033
- Table 47: Russia Partially Hydrolyzed PVA Revenue (undefined) Forecast, by Application 2020 & 2033
- Table 48: Russia Partially Hydrolyzed PVA Volume (K) Forecast, by Application 2020 & 2033
- Table 49: Benelux Partially Hydrolyzed PVA Revenue (undefined) Forecast, by Application 2020 & 2033
- Table 50: Benelux Partially Hydrolyzed PVA Volume (K) Forecast, by Application 2020 & 2033
- Table 51: Nordics Partially Hydrolyzed PVA Revenue (undefined) Forecast, by Application 2020 & 2033
- Table 52: Nordics Partially Hydrolyzed PVA Volume (K) Forecast, by Application 2020 & 2033
- Table 53: Rest of Europe Partially Hydrolyzed PVA Revenue (undefined) Forecast, by Application 2020 & 2033
- Table 54: Rest of Europe Partially Hydrolyzed PVA Volume (K) Forecast, by Application 2020 & 2033
- Table 55: Global Partially Hydrolyzed PVA Revenue undefined Forecast, by Application 2020 & 2033
- Table 56: Global Partially Hydrolyzed PVA Volume K Forecast, by Application 2020 & 2033
- Table 57: Global Partially Hydrolyzed PVA Revenue undefined Forecast, by Types 2020 & 2033
- Table 58: Global Partially Hydrolyzed PVA Volume K Forecast, by Types 2020 & 2033
- Table 59: Global Partially Hydrolyzed PVA Revenue undefined Forecast, by Country 2020 & 2033
- Table 60: Global Partially Hydrolyzed PVA Volume K Forecast, by Country 2020 & 2033
- Table 61: Turkey Partially Hydrolyzed PVA Revenue (undefined) Forecast, by Application 2020 & 2033
- Table 62: Turkey Partially Hydrolyzed PVA Volume (K) Forecast, by Application 2020 & 2033
- Table 63: Israel Partially Hydrolyzed PVA Revenue (undefined) Forecast, by Application 2020 & 2033
- Table 64: Israel Partially Hydrolyzed PVA Volume (K) Forecast, by Application 2020 & 2033
- Table 65: GCC Partially Hydrolyzed PVA Revenue (undefined) Forecast, by Application 2020 & 2033
- Table 66: GCC Partially Hydrolyzed PVA Volume (K) Forecast, by Application 2020 & 2033
- Table 67: North Africa Partially Hydrolyzed PVA Revenue (undefined) Forecast, by Application 2020 & 2033
- Table 68: North Africa Partially Hydrolyzed PVA Volume (K) Forecast, by Application 2020 & 2033
- Table 69: South Africa Partially Hydrolyzed PVA Revenue (undefined) Forecast, by Application 2020 & 2033
- Table 70: South Africa Partially Hydrolyzed PVA Volume (K) Forecast, by Application 2020 & 2033
- Table 71: Rest of Middle East & Africa Partially Hydrolyzed PVA Revenue (undefined) Forecast, by Application 2020 & 2033
- Table 72: Rest of Middle East & Africa Partially Hydrolyzed PVA Volume (K) Forecast, by Application 2020 & 2033
- Table 73: Global Partially Hydrolyzed PVA Revenue undefined Forecast, by Application 2020 & 2033
- Table 74: Global Partially Hydrolyzed PVA Volume K Forecast, by Application 2020 & 2033
- Table 75: Global Partially Hydrolyzed PVA Revenue undefined Forecast, by Types 2020 & 2033
- Table 76: Global Partially Hydrolyzed PVA Volume K Forecast, by Types 2020 & 2033
- Table 77: Global Partially Hydrolyzed PVA Revenue undefined Forecast, by Country 2020 & 2033
- Table 78: Global Partially Hydrolyzed PVA Volume K Forecast, by Country 2020 & 2033
- Table 79: China Partially Hydrolyzed PVA Revenue (undefined) Forecast, by Application 2020 & 2033
- Table 80: China Partially Hydrolyzed PVA Volume (K) Forecast, by Application 2020 & 2033
- Table 81: India Partially Hydrolyzed PVA Revenue (undefined) Forecast, by Application 2020 & 2033
- Table 82: India Partially Hydrolyzed PVA Volume (K) Forecast, by Application 2020 & 2033
- Table 83: Japan Partially Hydrolyzed PVA Revenue (undefined) Forecast, by Application 2020 & 2033
- Table 84: Japan Partially Hydrolyzed PVA Volume (K) Forecast, by Application 2020 & 2033
- Table 85: South Korea Partially Hydrolyzed PVA Revenue (undefined) Forecast, by Application 2020 & 2033
- Table 86: South Korea Partially Hydrolyzed PVA Volume (K) Forecast, by Application 2020 & 2033
- Table 87: ASEAN Partially Hydrolyzed PVA Revenue (undefined) Forecast, by Application 2020 & 2033
- Table 88: ASEAN Partially Hydrolyzed PVA Volume (K) Forecast, by Application 2020 & 2033
- Table 89: Oceania Partially Hydrolyzed PVA Revenue (undefined) Forecast, by Application 2020 & 2033
- Table 90: Oceania Partially Hydrolyzed PVA Volume (K) Forecast, by Application 2020 & 2033
- Table 91: Rest of Asia Pacific Partially Hydrolyzed PVA Revenue (undefined) Forecast, by Application 2020 & 2033
- Table 92: Rest of Asia Pacific Partially Hydrolyzed PVA Volume (K) Forecast, by Application 2020 & 2033
Frequently Asked Questions
1. What is the projected Compound Annual Growth Rate (CAGR) of the Partially Hydrolyzed PVA?
The projected CAGR is approximately 6.54%.
2. Which companies are prominent players in the Partially Hydrolyzed PVA?
Key companies in the market include Sekisui Chemical Co. Ltd., Kuraray Co. Ltd., Sinopec Sichuan Vinylon, Synthomer, JAPAN VAM & POVAL CO., LTD., Anhui Wanwei Group Co., Ltd., SNP, Inc., Mitsubishi Chemical Corporation, Chang Chun Group, Denka Company Limited, Shuangxin, NINGXIA DADI CIRCULAR.
3. What are the main segments of the Partially Hydrolyzed PVA?
The market segments include Application, Types.
4. Can you provide details about the market size?
The market size is estimated to be USD XXX N/A as of 2022.
5. What are some drivers contributing to market growth?
N/A
6. What are the notable trends driving market growth?
N/A
7. Are there any restraints impacting market growth?
N/A
8. Can you provide examples of recent developments in the market?
N/A
9. What pricing options are available for accessing the report?
Pricing options include single-user, multi-user, and enterprise licenses priced at USD 3950.00, USD 5925.00, and USD 7900.00 respectively.
10. Is the market size provided in terms of value or volume?
The market size is provided in terms of value, measured in N/A and volume, measured in K.
11. Are there any specific market keywords associated with the report?
Yes, the market keyword associated with the report is "Partially Hydrolyzed PVA," which aids in identifying and referencing the specific market segment covered.
12. How do I determine which pricing option suits my needs best?
The pricing options vary based on user requirements and access needs. Individual users may opt for single-user licenses, while businesses requiring broader access may choose multi-user or enterprise licenses for cost-effective access to the report.
13. Are there any additional resources or data provided in the Partially Hydrolyzed PVA report?
While the report offers comprehensive insights, it's advisable to review the specific contents or supplementary materials provided to ascertain if additional resources or data are available.
14. How can I stay updated on further developments or reports in the Partially Hydrolyzed PVA?
To stay informed about further developments, trends, and reports in the Partially Hydrolyzed PVA, consider subscribing to industry newsletters, following relevant companies and organizations, or regularly checking reputable industry news sources and publications.
Methodology
Step 1 - Identification of Relevant Samples Size from Population Database


Step 2 - Approaches for Defining Global Market Size (Value, Volume* & Price*)

Note*: In applicable scenarios
Step 3 - Data Sources
Primary Research
- Web Analytics
- Survey Reports
- Research Institute
- Latest Research Reports
- Opinion Leaders
Secondary Research
- Annual Reports
- White Paper
- Latest Press Release
- Industry Association
- Paid Database
- Investor Presentations

Step 4 - Data Triangulation
Involves using different sources of information in order to increase the validity of a study
These sources are likely to be stakeholders in a program - participants, other researchers, program staff, other community members, and so on.
Then we put all data in single framework & apply various statistical tools to find out the dynamic on the market.
During the analysis stage, feedback from the stakeholder groups would be compared to determine areas of agreement as well as areas of divergence