

Key Insights
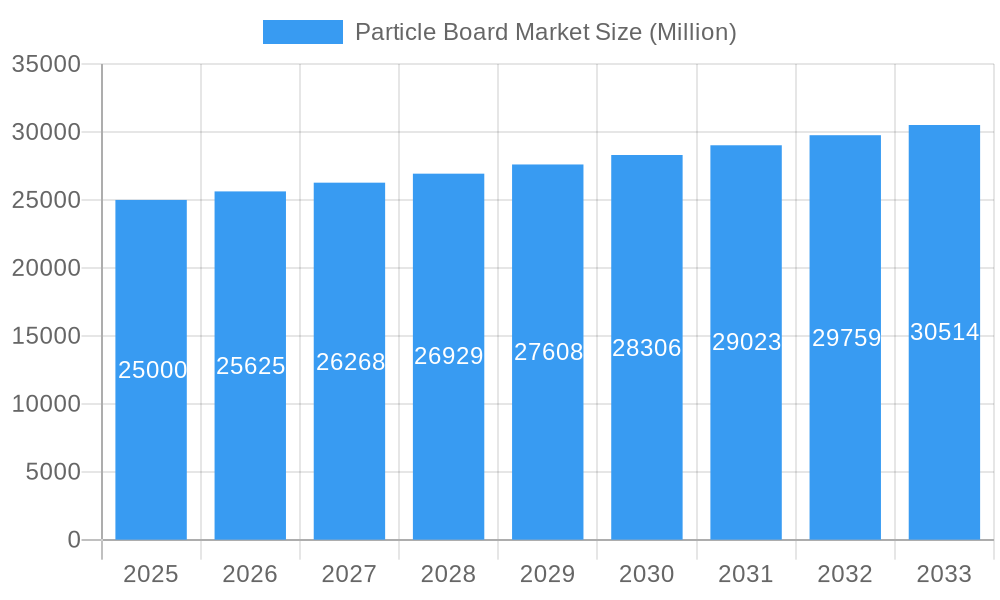
The global particle board market, valued at $21.88 billion in 2025, is projected to experience robust growth, exceeding a 5.8% CAGR from 2025 to 2033. This expansion is driven by increasing demand for affordable and versatile building materials in the construction and furniture sectors. The rising adoption of particleboard in infrastructure projects, particularly in developing economies undergoing rapid urbanization, further contributes to market expansion. Furthermore, innovative advancements in particleboard manufacturing, including the incorporation of recycled content and sustainable raw materials (like bagasse), are addressing growing environmental concerns and creating new market opportunities. While fluctuating raw material prices present a potential restraint, the ongoing trend towards sustainable practices and diverse particleboard applications are expected to mitigate this challenge. Market segmentation reveals strong growth potential across various applications, with construction and furniture remaining dominant sectors.
Particle Board Market Market Size (In Billion)
The regional landscape showcases considerable variations in market dynamics. North America and Europe currently hold significant market shares, supported by established construction and furniture industries. However, the Asia-Pacific region is poised for rapid growth, fueled by expanding infrastructure projects and increasing disposable incomes. China, India, and Southeast Asia represent particularly promising markets. The competitive landscape comprises a mix of large multinational corporations and regional players. Key strategies for competitive advantage include product innovation, strategic partnerships, and geographic expansion. The continued focus on sustainable production methods and the exploration of new particleboard applications are expected to shape the market’s trajectory, ensuring sustained growth throughout the forecast period.
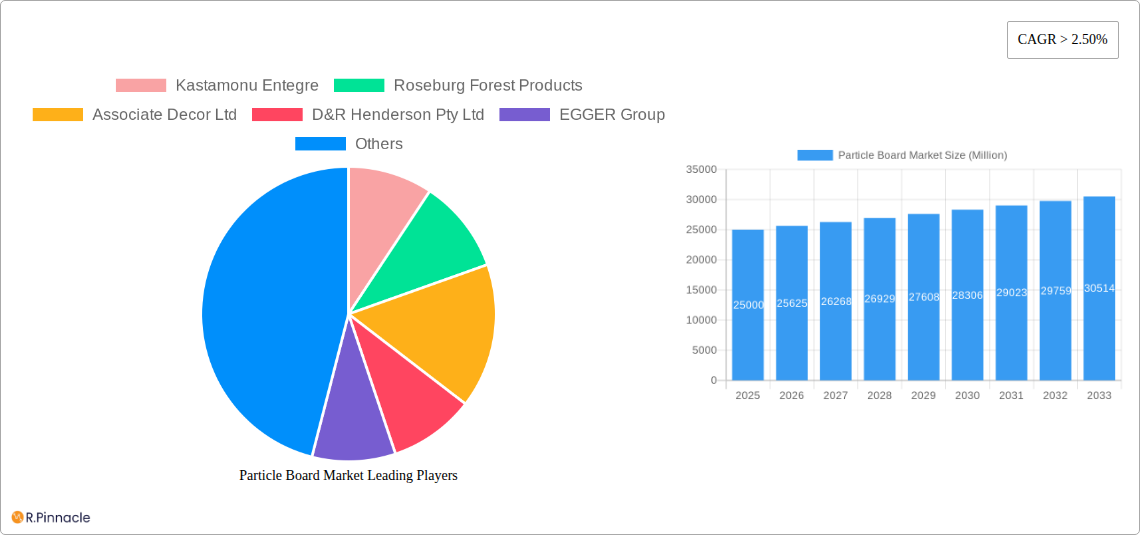
Particle Board Market Company Market Share
Particle Board Market Report: A Comprehensive Analysis (2019-2033)
This in-depth report provides a comprehensive analysis of the global particle board market, offering invaluable insights for industry professionals, investors, and strategic decision-makers. Covering the period from 2019 to 2033, with a base year of 2025, this report leverages extensive data and expert analysis to illuminate current market dynamics and predict future trends. The report meticulously segments the market by raw material (wood, bagasse, other recycled content) and application (construction, furniture, infrastructure, other applications), offering granular detail for informed strategic planning.
Particle Board Market Market Structure & Innovation Trends
This section analyzes the competitive landscape, innovation drivers, and regulatory influences shaping the particle board market. We delve into market concentration, assessing the market share held by key players such as Kastamonu Entegre, Roseburg Forest Products, and EGGER Group. The report also examines the impact of mergers and acquisitions (M&A) activities, analyzing deal values and their influence on market consolidation. Innovation drivers, including advancements in manufacturing technologies and the development of sustainable materials, are discussed. Finally, the report explores the regulatory framework governing the particle board industry, analyzing its impact on market growth and the adoption of sustainable practices. The impact of product substitutes and end-user demographics on market dynamics is also considered.
- Market Concentration: The market exhibits a moderately concentrated structure, with the top five players holding an estimated xx% market share in 2025.
- M&A Activity: Recent M&A deals, including Roseburg's sale of its Simsboro plant, demonstrate consolidation trends within the industry. Total M&A deal value in the last five years is estimated at $xx Million.
- Innovation Drivers: Focus on sustainable materials and improved manufacturing efficiency are key drivers of innovation.
- Regulatory Frameworks: Environmental regulations play a significant role in shaping manufacturing practices and product development.
Particle Board Market Market Dynamics & Trends
This section explores the key factors driving market growth, technological advancements, evolving consumer preferences, and competitive landscape dynamics. We analyze the Compound Annual Growth Rate (CAGR) and market penetration rates for different segments, providing insights into the trajectory of the particle board market. Emerging trends, such as the growing demand for eco-friendly particle board and the increased adoption of innovative manufacturing techniques, are also examined. The section will detail the effects of economic fluctuations and shifts in consumer behavior on overall market demand.
- CAGR (2025-2033): The market is projected to experience a CAGR of xx%.
- Market Penetration: The penetration rate of particle board in key applications like construction and furniture is anticipated to increase by xx% by 2033.
Dominant Regions & Segments in Particle Board Market
This section identifies the leading regions and segments within the particle board market, examining their respective growth drivers. The analysis focuses on the key segments categorized by raw material (wood, bagasse, other recycled content) and application (construction, furniture, infrastructure, other applications). We delve into the specific factors contributing to the dominance of these regions and segments.
- Leading Region: North America currently holds a significant market share due to robust construction activities.
- Dominant Raw Material: Wood remains the dominant raw material, owing to its availability and cost-effectiveness.
- Leading Application: Construction continues to be the largest application segment, driven by the ongoing growth in the global infrastructure sector.
Key Drivers:
- Construction Sector Growth: Increased investment in residential and commercial construction projects fuels demand.
- Furniture Manufacturing: The global furniture industry's growth propels the demand for particleboard in furniture production.
- Government Policies: Supportive government policies promoting sustainable building materials are influencing market growth in specific regions.
Particle Board Market Product Innovations
This section summarizes recent product developments in the particle board industry, highlighting key technological trends and their market impact. Innovations such as the use of recycled materials and improved manufacturing processes are discussed. The competitive advantages offered by these new products and their market fit are examined. The focus is on innovations that improve sustainability, performance, and cost-effectiveness.
Report Scope & Segmentation Analysis
This report segments the particle board market by raw material type and application. Each segment is analyzed based on market size, growth projections, and competitive dynamics.
- Raw Material Segmentation: Wood, Bagasse, and Other Raw Materials (Recycled Content) – each segment's market size and growth projections are detailed.
- Application Segmentation: Construction, Furniture, Infrastructure, and Other Applications (Packaging and Shipping) – market size, growth projections, and competitive dynamics are presented for each segment.
Key Drivers of Particle Board Market Growth
Several factors drive the growth of the particle board market, including increasing construction activities globally, rising demand from the furniture industry, and government initiatives supporting sustainable building materials. Technological advancements leading to improved product quality and manufacturing efficiency also contribute significantly to market growth.
Challenges in the Particle Board Market Sector
The particle board market faces challenges like fluctuating raw material prices, stringent environmental regulations, and intense competition from substitute materials. Supply chain disruptions and increasing labor costs can also hinder market growth. The overall impact of these factors is quantified within the report.
Emerging Opportunities in Particle Board Market
Opportunities exist in developing sustainable and high-performance particle board, expanding into emerging markets, and leveraging advancements in manufacturing technology. The focus on eco-friendly products and diversification into new applications offer promising avenues for growth.
Leading Players in the Particle Board Market Market
- Kastamonu Entegre
- Roseburg Forest Products
- Associate Decor Ltd
- D&R Henderson Pty Ltd
- EGGER Group
- West Fraser
- Uniboard
- Peter Benson (Plywood) Limited
- Krifor Industries Pvt Ltd
- Georgia-Pacific
- Wanhua Ecoboard Co Ltd
- Timber Products Company
- Boise Cascade
- Century Prowud
- Shirdi Industries Ltd (ASIS India)
- Siam Riso
Key Developments in Particle Board Market Industry
- December 2023: Roseburg sold its particle board plant in Simsboro, Louisiana, to Kronospan.
- July 2022: Kastamonu Entegre collaborated with Siempelkamp to establish a new particle board plant in Turkey.
- January 2022: Roseburg Forest Products announced the closure of its particle board plant in Douglas County.
Future Outlook for Particle Board Market Market
The particle board market is poised for continued growth driven by sustained demand from key applications and ongoing innovation in product development and manufacturing processes. Strategic partnerships and investments in sustainable practices will shape future market dynamics. The market is expected to witness significant expansion, particularly in emerging economies, creating lucrative opportunities for businesses operating in this sector.
Particle Board Market Segmentation
-
1. Raw Material
-
1.1. Wood
- 1.1.1. Sawdust
- 1.1.2. Shavings
- 1.1.3. Flakes
- 1.1.4. Chips
- 1.2. Bagasse
- 1.3. Other Raw Materials (Recycled Content)
-
1.1. Wood
-
2. Application
- 2.1. Construction
- 2.2. Furniture
- 2.3. Infrastructure
- 2.4. Other Applications (Packaging and Shipping)
Particle Board Market Segmentation By Geography
-
1. Asia Pacific
- 1.1. China
- 1.2. India
- 1.3. Japan
- 1.4. South Korea
- 1.5. Southeast Asia
- 1.6. Rest of Asia Pacific
-
2. North America
- 2.1. United States
- 2.2. Canada
- 2.3. Mexico
-
3. Europe
- 3.1. Germany
- 3.2. United Kingdom
- 3.3. Italy
- 3.4. France
- 3.5. Spain
- 3.6. NORDIC
- 3.7. Rest of Europe
-
4. South America
- 4.1. Brazil
- 4.2. Argentina
- 4.3. Colombia
- 4.4. Rest of South America
-
5. Middle East and Africa
- 5.1. Saudi Arabia
- 5.2. South Africa
- 5.3. Nigeria
- 5.4. UAE
- 5.5. Rest of Middle East and Africa
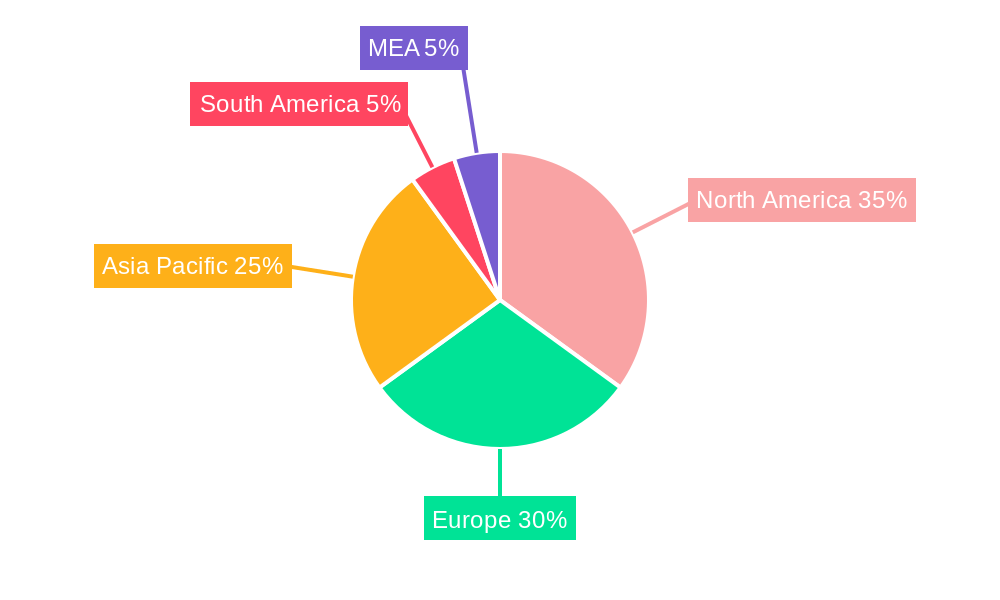
Particle Board Market Regional Market Share
Geographic Coverage of Particle Board Market
Particle Board Market REPORT HIGHLIGHTS
| Aspects | Details |
|---|---|
| Study Period | 2020-2034 |
| Base Year | 2025 |
| Estimated Year | 2026 |
| Forecast Period | 2026-2034 |
| Historical Period | 2020-2025 |
| Growth Rate | CAGR of 5.8% from 2020-2034 |
| Segmentation |
|
Table of Contents
- 1. Introduction
- 1.1. Research Scope
- 1.2. Market Segmentation
- 1.3. Research Objective
- 1.4. Definitions and Assumptions
- 2. Executive Summary
- 2.1. Market Snapshot
- 3. Market Dynamics
- 3.1. Market Drivers
- 3.2. Market Restrains
- 3.3. Market Trends
- 3.4. Market Opportunities
- 4. Market Factor Analysis
- 4.1. Porters Five Forces
- 4.1.1. Bargaining Power of Suppliers
- 4.1.2. Bargaining Power of Buyers
- 4.1.3. Threat of New Entrants
- 4.1.4. Threat of Substitutes
- 4.1.5. Competitive Rivalry
- 4.2. PESTEL analysis
- 4.3. BCG Analysis
- 4.3.1. Stars (High Growth, High Market Share)
- 4.3.2. Cash Cows (Low Growth, High Market Share)
- 4.3.3. Question Mark (High Growth, Low Market Share)
- 4.3.4. Dogs (Low Growth, Low Market Share)
- 4.4. Ansoff Matrix Analysis
- 4.5. Supply Chain Analysis
- 4.6. Regulatory Landscape
- 4.7. Current Market Potential and Opportunity Assessment (TAM–SAM–SOM Framework)
- 4.8. PRI Analyst Note
- 4.1. Porters Five Forces
- 5. Market Analysis, Insights and Forecast 2021-2033
- 5.1. Market Analysis, Insights and Forecast - by Raw Material
- 5.1.1. Wood
- 5.1.1.1. Sawdust
- 5.1.1.2. Shavings
- 5.1.1.3. Flakes
- 5.1.1.4. Chips
- 5.1.2. Bagasse
- 5.1.3. Other Raw Materials (Recycled Content)
- 5.1.1. Wood
- 5.2. Market Analysis, Insights and Forecast - by Application
- 5.2.1. Construction
- 5.2.2. Furniture
- 5.2.3. Infrastructure
- 5.2.4. Other Applications (Packaging and Shipping)
- 5.3. Market Analysis, Insights and Forecast - by Region
- 5.3.1. Asia Pacific
- 5.3.2. North America
- 5.3.3. Europe
- 5.3.4. South America
- 5.3.5. Middle East and Africa
- 5.1. Market Analysis, Insights and Forecast - by Raw Material
- 6. Global Particle Board Market Analysis, Insights and Forecast, 2021-2033
- 6.1. Market Analysis, Insights and Forecast - by Raw Material
- 6.1.1. Wood
- 6.1.1.1. Sawdust
- 6.1.1.2. Shavings
- 6.1.1.3. Flakes
- 6.1.1.4. Chips
- 6.1.2. Bagasse
- 6.1.3. Other Raw Materials (Recycled Content)
- 6.1.1. Wood
- 6.2. Market Analysis, Insights and Forecast - by Application
- 6.2.1. Construction
- 6.2.2. Furniture
- 6.2.3. Infrastructure
- 6.2.4. Other Applications (Packaging and Shipping)
- 6.1. Market Analysis, Insights and Forecast - by Raw Material
- 7. Asia Pacific Particle Board Market Analysis, Insights and Forecast, 2020-2032
- 7.1. Market Analysis, Insights and Forecast - by Raw Material
- 7.1.1. Wood
- 7.1.1.1. Sawdust
- 7.1.1.2. Shavings
- 7.1.1.3. Flakes
- 7.1.1.4. Chips
- 7.1.2. Bagasse
- 7.1.3. Other Raw Materials (Recycled Content)
- 7.1.1. Wood
- 7.2. Market Analysis, Insights and Forecast - by Application
- 7.2.1. Construction
- 7.2.2. Furniture
- 7.2.3. Infrastructure
- 7.2.4. Other Applications (Packaging and Shipping)
- 7.1. Market Analysis, Insights and Forecast - by Raw Material
- 8. North America Particle Board Market Analysis, Insights and Forecast, 2020-2032
- 8.1. Market Analysis, Insights and Forecast - by Raw Material
- 8.1.1. Wood
- 8.1.1.1. Sawdust
- 8.1.1.2. Shavings
- 8.1.1.3. Flakes
- 8.1.1.4. Chips
- 8.1.2. Bagasse
- 8.1.3. Other Raw Materials (Recycled Content)
- 8.1.1. Wood
- 8.2. Market Analysis, Insights and Forecast - by Application
- 8.2.1. Construction
- 8.2.2. Furniture
- 8.2.3. Infrastructure
- 8.2.4. Other Applications (Packaging and Shipping)
- 8.1. Market Analysis, Insights and Forecast - by Raw Material
- 9. Europe Particle Board Market Analysis, Insights and Forecast, 2020-2032
- 9.1. Market Analysis, Insights and Forecast - by Raw Material
- 9.1.1. Wood
- 9.1.1.1. Sawdust
- 9.1.1.2. Shavings
- 9.1.1.3. Flakes
- 9.1.1.4. Chips
- 9.1.2. Bagasse
- 9.1.3. Other Raw Materials (Recycled Content)
- 9.1.1. Wood
- 9.2. Market Analysis, Insights and Forecast - by Application
- 9.2.1. Construction
- 9.2.2. Furniture
- 9.2.3. Infrastructure
- 9.2.4. Other Applications (Packaging and Shipping)
- 9.1. Market Analysis, Insights and Forecast - by Raw Material
- 10. South America Particle Board Market Analysis, Insights and Forecast, 2020-2032
- 10.1. Market Analysis, Insights and Forecast - by Raw Material
- 10.1.1. Wood
- 10.1.1.1. Sawdust
- 10.1.1.2. Shavings
- 10.1.1.3. Flakes
- 10.1.1.4. Chips
- 10.1.2. Bagasse
- 10.1.3. Other Raw Materials (Recycled Content)
- 10.1.1. Wood
- 10.2. Market Analysis, Insights and Forecast - by Application
- 10.2.1. Construction
- 10.2.2. Furniture
- 10.2.3. Infrastructure
- 10.2.4. Other Applications (Packaging and Shipping)
- 10.1. Market Analysis, Insights and Forecast - by Raw Material
- 11. Middle East and Africa Particle Board Market Analysis, Insights and Forecast, 2020-2032
- 11.1. Market Analysis, Insights and Forecast - by Raw Material
- 11.1.1. Wood
- 11.1.1.1. Sawdust
- 11.1.1.2. Shavings
- 11.1.1.3. Flakes
- 11.1.1.4. Chips
- 11.1.2. Bagasse
- 11.1.3. Other Raw Materials (Recycled Content)
- 11.1.1. Wood
- 11.2. Market Analysis, Insights and Forecast - by Application
- 11.2.1. Construction
- 11.2.2. Furniture
- 11.2.3. Infrastructure
- 11.2.4. Other Applications (Packaging and Shipping)
- 11.1. Market Analysis, Insights and Forecast - by Raw Material
- 12. Competitive Analysis
- 12.1. Company Profiles
- 12.1.1 Kastamonu Entegre
- 12.1.1.1. Company Overview
- 12.1.1.2. Products
- 12.1.1.3. Company Financials
- 12.1.1.4. SWOT Analysis
- 12.1.2 Roseburg Forest Products
- 12.1.2.1. Company Overview
- 12.1.2.2. Products
- 12.1.2.3. Company Financials
- 12.1.2.4. SWOT Analysis
- 12.1.3 Associate Decor Ltd
- 12.1.3.1. Company Overview
- 12.1.3.2. Products
- 12.1.3.3. Company Financials
- 12.1.3.4. SWOT Analysis
- 12.1.4 D&R Henderson Pty Ltd
- 12.1.4.1. Company Overview
- 12.1.4.2. Products
- 12.1.4.3. Company Financials
- 12.1.4.4. SWOT Analysis
- 12.1.5 EGGER Group
- 12.1.5.1. Company Overview
- 12.1.5.2. Products
- 12.1.5.3. Company Financials
- 12.1.5.4. SWOT Analysis
- 12.1.6 West Fraser
- 12.1.6.1. Company Overview
- 12.1.6.2. Products
- 12.1.6.3. Company Financials
- 12.1.6.4. SWOT Analysis
- 12.1.7 Uniboard
- 12.1.7.1. Company Overview
- 12.1.7.2. Products
- 12.1.7.3. Company Financials
- 12.1.7.4. SWOT Analysis
- 12.1.8 Peter Benson (Plywood) Limited
- 12.1.8.1. Company Overview
- 12.1.8.2. Products
- 12.1.8.3. Company Financials
- 12.1.8.4. SWOT Analysis
- 12.1.9 Krifor Industries Pvt Ltd
- 12.1.9.1. Company Overview
- 12.1.9.2. Products
- 12.1.9.3. Company Financials
- 12.1.9.4. SWOT Analysis
- 12.1.10 Georgia-Pacific
- 12.1.10.1. Company Overview
- 12.1.10.2. Products
- 12.1.10.3. Company Financials
- 12.1.10.4. SWOT Analysis
- 12.1.11 Wanhua Ecoboard Co Ltd
- 12.1.11.1. Company Overview
- 12.1.11.2. Products
- 12.1.11.3. Company Financials
- 12.1.11.4. SWOT Analysis
- 12.1.12 Timber Products Company
- 12.1.12.1. Company Overview
- 12.1.12.2. Products
- 12.1.12.3. Company Financials
- 12.1.12.4. SWOT Analysis
- 12.1.13 Boise Cascade
- 12.1.13.1. Company Overview
- 12.1.13.2. Products
- 12.1.13.3. Company Financials
- 12.1.13.4. SWOT Analysis
- 12.1.14 Century Prowud
- 12.1.14.1. Company Overview
- 12.1.14.2. Products
- 12.1.14.3. Company Financials
- 12.1.14.4. SWOT Analysis
- 12.1.15 Shirdi Industries Ltd (ASIS India)
- 12.1.15.1. Company Overview
- 12.1.15.2. Products
- 12.1.15.3. Company Financials
- 12.1.15.4. SWOT Analysis
- 12.1.16 Siam Riso
- 12.1.16.1. Company Overview
- 12.1.16.2. Products
- 12.1.16.3. Company Financials
- 12.1.16.4. SWOT Analysis
- 12.1.1 Kastamonu Entegre
- 12.2. Market Entropy
- 12.2.1 Company's Key Areas Served
- 12.2.2 Recent Developments
- 12.3. Company Market Share Analysis 2025
- 12.3.1 Top 5 Companies Market Share Analysis
- 12.3.2 Top 3 Companies Market Share Analysis
- 12.4. List of Potential Customers
- 13. Research Methodology
List of Figures
- Figure 1: Global Particle Board Market Revenue Breakdown (billion, %) by Region 2025 & 2033
- Figure 2: Global Particle Board Market Volume Breakdown (Square Meters, %) by Region 2025 & 2033
- Figure 3: Asia Pacific Particle Board Market Revenue (billion), by Raw Material 2025 & 2033
- Figure 4: Asia Pacific Particle Board Market Volume (Square Meters), by Raw Material 2025 & 2033
- Figure 5: Asia Pacific Particle Board Market Revenue Share (%), by Raw Material 2025 & 2033
- Figure 6: Asia Pacific Particle Board Market Volume Share (%), by Raw Material 2025 & 2033
- Figure 7: Asia Pacific Particle Board Market Revenue (billion), by Application 2025 & 2033
- Figure 8: Asia Pacific Particle Board Market Volume (Square Meters), by Application 2025 & 2033
- Figure 9: Asia Pacific Particle Board Market Revenue Share (%), by Application 2025 & 2033
- Figure 10: Asia Pacific Particle Board Market Volume Share (%), by Application 2025 & 2033
- Figure 11: Asia Pacific Particle Board Market Revenue (billion), by Country 2025 & 2033
- Figure 12: Asia Pacific Particle Board Market Volume (Square Meters), by Country 2025 & 2033
- Figure 13: Asia Pacific Particle Board Market Revenue Share (%), by Country 2025 & 2033
- Figure 14: Asia Pacific Particle Board Market Volume Share (%), by Country 2025 & 2033
- Figure 15: North America Particle Board Market Revenue (billion), by Raw Material 2025 & 2033
- Figure 16: North America Particle Board Market Volume (Square Meters), by Raw Material 2025 & 2033
- Figure 17: North America Particle Board Market Revenue Share (%), by Raw Material 2025 & 2033
- Figure 18: North America Particle Board Market Volume Share (%), by Raw Material 2025 & 2033
- Figure 19: North America Particle Board Market Revenue (billion), by Application 2025 & 2033
- Figure 20: North America Particle Board Market Volume (Square Meters), by Application 2025 & 2033
- Figure 21: North America Particle Board Market Revenue Share (%), by Application 2025 & 2033
- Figure 22: North America Particle Board Market Volume Share (%), by Application 2025 & 2033
- Figure 23: North America Particle Board Market Revenue (billion), by Country 2025 & 2033
- Figure 24: North America Particle Board Market Volume (Square Meters), by Country 2025 & 2033
- Figure 25: North America Particle Board Market Revenue Share (%), by Country 2025 & 2033
- Figure 26: North America Particle Board Market Volume Share (%), by Country 2025 & 2033
- Figure 27: Europe Particle Board Market Revenue (billion), by Raw Material 2025 & 2033
- Figure 28: Europe Particle Board Market Volume (Square Meters), by Raw Material 2025 & 2033
- Figure 29: Europe Particle Board Market Revenue Share (%), by Raw Material 2025 & 2033
- Figure 30: Europe Particle Board Market Volume Share (%), by Raw Material 2025 & 2033
- Figure 31: Europe Particle Board Market Revenue (billion), by Application 2025 & 2033
- Figure 32: Europe Particle Board Market Volume (Square Meters), by Application 2025 & 2033
- Figure 33: Europe Particle Board Market Revenue Share (%), by Application 2025 & 2033
- Figure 34: Europe Particle Board Market Volume Share (%), by Application 2025 & 2033
- Figure 35: Europe Particle Board Market Revenue (billion), by Country 2025 & 2033
- Figure 36: Europe Particle Board Market Volume (Square Meters), by Country 2025 & 2033
- Figure 37: Europe Particle Board Market Revenue Share (%), by Country 2025 & 2033
- Figure 38: Europe Particle Board Market Volume Share (%), by Country 2025 & 2033
- Figure 39: South America Particle Board Market Revenue (billion), by Raw Material 2025 & 2033
- Figure 40: South America Particle Board Market Volume (Square Meters), by Raw Material 2025 & 2033
- Figure 41: South America Particle Board Market Revenue Share (%), by Raw Material 2025 & 2033
- Figure 42: South America Particle Board Market Volume Share (%), by Raw Material 2025 & 2033
- Figure 43: South America Particle Board Market Revenue (billion), by Application 2025 & 2033
- Figure 44: South America Particle Board Market Volume (Square Meters), by Application 2025 & 2033
- Figure 45: South America Particle Board Market Revenue Share (%), by Application 2025 & 2033
- Figure 46: South America Particle Board Market Volume Share (%), by Application 2025 & 2033
- Figure 47: South America Particle Board Market Revenue (billion), by Country 2025 & 2033
- Figure 48: South America Particle Board Market Volume (Square Meters), by Country 2025 & 2033
- Figure 49: South America Particle Board Market Revenue Share (%), by Country 2025 & 2033
- Figure 50: South America Particle Board Market Volume Share (%), by Country 2025 & 2033
- Figure 51: Middle East and Africa Particle Board Market Revenue (billion), by Raw Material 2025 & 2033
- Figure 52: Middle East and Africa Particle Board Market Volume (Square Meters), by Raw Material 2025 & 2033
- Figure 53: Middle East and Africa Particle Board Market Revenue Share (%), by Raw Material 2025 & 2033
- Figure 54: Middle East and Africa Particle Board Market Volume Share (%), by Raw Material 2025 & 2033
- Figure 55: Middle East and Africa Particle Board Market Revenue (billion), by Application 2025 & 2033
- Figure 56: Middle East and Africa Particle Board Market Volume (Square Meters), by Application 2025 & 2033
- Figure 57: Middle East and Africa Particle Board Market Revenue Share (%), by Application 2025 & 2033
- Figure 58: Middle East and Africa Particle Board Market Volume Share (%), by Application 2025 & 2033
- Figure 59: Middle East and Africa Particle Board Market Revenue (billion), by Country 2025 & 2033
- Figure 60: Middle East and Africa Particle Board Market Volume (Square Meters), by Country 2025 & 2033
- Figure 61: Middle East and Africa Particle Board Market Revenue Share (%), by Country 2025 & 2033
- Figure 62: Middle East and Africa Particle Board Market Volume Share (%), by Country 2025 & 2033
List of Tables
- Table 1: Global Particle Board Market Revenue billion Forecast, by Raw Material 2020 & 2033
- Table 2: Global Particle Board Market Volume Square Meters Forecast, by Raw Material 2020 & 2033
- Table 3: Global Particle Board Market Revenue billion Forecast, by Application 2020 & 2033
- Table 4: Global Particle Board Market Volume Square Meters Forecast, by Application 2020 & 2033
- Table 5: Global Particle Board Market Revenue billion Forecast, by Region 2020 & 2033
- Table 6: Global Particle Board Market Volume Square Meters Forecast, by Region 2020 & 2033
- Table 7: Global Particle Board Market Revenue billion Forecast, by Raw Material 2020 & 2033
- Table 8: Global Particle Board Market Volume Square Meters Forecast, by Raw Material 2020 & 2033
- Table 9: Global Particle Board Market Revenue billion Forecast, by Application 2020 & 2033
- Table 10: Global Particle Board Market Volume Square Meters Forecast, by Application 2020 & 2033
- Table 11: Global Particle Board Market Revenue billion Forecast, by Country 2020 & 2033
- Table 12: Global Particle Board Market Volume Square Meters Forecast, by Country 2020 & 2033
- Table 13: China Particle Board Market Revenue (billion) Forecast, by Application 2020 & 2033
- Table 14: China Particle Board Market Volume (Square Meters) Forecast, by Application 2020 & 2033
- Table 15: India Particle Board Market Revenue (billion) Forecast, by Application 2020 & 2033
- Table 16: India Particle Board Market Volume (Square Meters) Forecast, by Application 2020 & 2033
- Table 17: Japan Particle Board Market Revenue (billion) Forecast, by Application 2020 & 2033
- Table 18: Japan Particle Board Market Volume (Square Meters) Forecast, by Application 2020 & 2033
- Table 19: South Korea Particle Board Market Revenue (billion) Forecast, by Application 2020 & 2033
- Table 20: South Korea Particle Board Market Volume (Square Meters) Forecast, by Application 2020 & 2033
- Table 21: Southeast Asia Particle Board Market Revenue (billion) Forecast, by Application 2020 & 2033
- Table 22: Southeast Asia Particle Board Market Volume (Square Meters) Forecast, by Application 2020 & 2033
- Table 23: Rest of Asia Pacific Particle Board Market Revenue (billion) Forecast, by Application 2020 & 2033
- Table 24: Rest of Asia Pacific Particle Board Market Volume (Square Meters) Forecast, by Application 2020 & 2033
- Table 25: Global Particle Board Market Revenue billion Forecast, by Raw Material 2020 & 2033
- Table 26: Global Particle Board Market Volume Square Meters Forecast, by Raw Material 2020 & 2033
- Table 27: Global Particle Board Market Revenue billion Forecast, by Application 2020 & 2033
- Table 28: Global Particle Board Market Volume Square Meters Forecast, by Application 2020 & 2033
- Table 29: Global Particle Board Market Revenue billion Forecast, by Country 2020 & 2033
- Table 30: Global Particle Board Market Volume Square Meters Forecast, by Country 2020 & 2033
- Table 31: United States Particle Board Market Revenue (billion) Forecast, by Application 2020 & 2033
- Table 32: United States Particle Board Market Volume (Square Meters) Forecast, by Application 2020 & 2033
- Table 33: Canada Particle Board Market Revenue (billion) Forecast, by Application 2020 & 2033
- Table 34: Canada Particle Board Market Volume (Square Meters) Forecast, by Application 2020 & 2033
- Table 35: Mexico Particle Board Market Revenue (billion) Forecast, by Application 2020 & 2033
- Table 36: Mexico Particle Board Market Volume (Square Meters) Forecast, by Application 2020 & 2033
- Table 37: Global Particle Board Market Revenue billion Forecast, by Raw Material 2020 & 2033
- Table 38: Global Particle Board Market Volume Square Meters Forecast, by Raw Material 2020 & 2033
- Table 39: Global Particle Board Market Revenue billion Forecast, by Application 2020 & 2033
- Table 40: Global Particle Board Market Volume Square Meters Forecast, by Application 2020 & 2033
- Table 41: Global Particle Board Market Revenue billion Forecast, by Country 2020 & 2033
- Table 42: Global Particle Board Market Volume Square Meters Forecast, by Country 2020 & 2033
- Table 43: Germany Particle Board Market Revenue (billion) Forecast, by Application 2020 & 2033
- Table 44: Germany Particle Board Market Volume (Square Meters) Forecast, by Application 2020 & 2033
- Table 45: United Kingdom Particle Board Market Revenue (billion) Forecast, by Application 2020 & 2033
- Table 46: United Kingdom Particle Board Market Volume (Square Meters) Forecast, by Application 2020 & 2033
- Table 47: Italy Particle Board Market Revenue (billion) Forecast, by Application 2020 & 2033
- Table 48: Italy Particle Board Market Volume (Square Meters) Forecast, by Application 2020 & 2033
- Table 49: France Particle Board Market Revenue (billion) Forecast, by Application 2020 & 2033
- Table 50: France Particle Board Market Volume (Square Meters) Forecast, by Application 2020 & 2033
- Table 51: Spain Particle Board Market Revenue (billion) Forecast, by Application 2020 & 2033
- Table 52: Spain Particle Board Market Volume (Square Meters) Forecast, by Application 2020 & 2033
- Table 53: NORDIC Particle Board Market Revenue (billion) Forecast, by Application 2020 & 2033
- Table 54: NORDIC Particle Board Market Volume (Square Meters) Forecast, by Application 2020 & 2033
- Table 55: Rest of Europe Particle Board Market Revenue (billion) Forecast, by Application 2020 & 2033
- Table 56: Rest of Europe Particle Board Market Volume (Square Meters) Forecast, by Application 2020 & 2033
- Table 57: Global Particle Board Market Revenue billion Forecast, by Raw Material 2020 & 2033
- Table 58: Global Particle Board Market Volume Square Meters Forecast, by Raw Material 2020 & 2033
- Table 59: Global Particle Board Market Revenue billion Forecast, by Application 2020 & 2033
- Table 60: Global Particle Board Market Volume Square Meters Forecast, by Application 2020 & 2033
- Table 61: Global Particle Board Market Revenue billion Forecast, by Country 2020 & 2033
- Table 62: Global Particle Board Market Volume Square Meters Forecast, by Country 2020 & 2033
- Table 63: Brazil Particle Board Market Revenue (billion) Forecast, by Application 2020 & 2033
- Table 64: Brazil Particle Board Market Volume (Square Meters) Forecast, by Application 2020 & 2033
- Table 65: Argentina Particle Board Market Revenue (billion) Forecast, by Application 2020 & 2033
- Table 66: Argentina Particle Board Market Volume (Square Meters) Forecast, by Application 2020 & 2033
- Table 67: Colombia Particle Board Market Revenue (billion) Forecast, by Application 2020 & 2033
- Table 68: Colombia Particle Board Market Volume (Square Meters) Forecast, by Application 2020 & 2033
- Table 69: Rest of South America Particle Board Market Revenue (billion) Forecast, by Application 2020 & 2033
- Table 70: Rest of South America Particle Board Market Volume (Square Meters) Forecast, by Application 2020 & 2033
- Table 71: Global Particle Board Market Revenue billion Forecast, by Raw Material 2020 & 2033
- Table 72: Global Particle Board Market Volume Square Meters Forecast, by Raw Material 2020 & 2033
- Table 73: Global Particle Board Market Revenue billion Forecast, by Application 2020 & 2033
- Table 74: Global Particle Board Market Volume Square Meters Forecast, by Application 2020 & 2033
- Table 75: Global Particle Board Market Revenue billion Forecast, by Country 2020 & 2033
- Table 76: Global Particle Board Market Volume Square Meters Forecast, by Country 2020 & 2033
- Table 77: Saudi Arabia Particle Board Market Revenue (billion) Forecast, by Application 2020 & 2033
- Table 78: Saudi Arabia Particle Board Market Volume (Square Meters) Forecast, by Application 2020 & 2033
- Table 79: South Africa Particle Board Market Revenue (billion) Forecast, by Application 2020 & 2033
- Table 80: South Africa Particle Board Market Volume (Square Meters) Forecast, by Application 2020 & 2033
- Table 81: Nigeria Particle Board Market Revenue (billion) Forecast, by Application 2020 & 2033
- Table 82: Nigeria Particle Board Market Volume (Square Meters) Forecast, by Application 2020 & 2033
- Table 83: UAE Particle Board Market Revenue (billion) Forecast, by Application 2020 & 2033
- Table 84: UAE Particle Board Market Volume (Square Meters) Forecast, by Application 2020 & 2033
- Table 85: Rest of Middle East and Africa Particle Board Market Revenue (billion) Forecast, by Application 2020 & 2033
- Table 86: Rest of Middle East and Africa Particle Board Market Volume (Square Meters) Forecast, by Application 2020 & 2033
Frequently Asked Questions
1. What is the projected Compound Annual Growth Rate (CAGR) of the Particle Board Market?
The projected CAGR is approximately 5.8%.
2. Which companies are prominent players in the Particle Board Market?
Key companies in the market include Kastamonu Entegre, Roseburg Forest Products, Associate Decor Ltd, D&R Henderson Pty Ltd, EGGER Group, West Fraser, Uniboard, Peter Benson (Plywood) Limited, Krifor Industries Pvt Ltd, Georgia-Pacific, Wanhua Ecoboard Co Ltd, Timber Products Company, Boise Cascade, Century Prowud, Shirdi Industries Ltd (ASIS India), Siam Riso.
3. What are the main segments of the Particle Board Market?
The market segments include Raw Material, Application.
4. Can you provide details about the market size?
The market size is estimated to be USD 21.88 billion as of 2022.
5. What are some drivers contributing to market growth?
Increasing Demand from the Furniture Industry; Easy Availability of Raw Materials.
6. What are the notable trends driving market growth?
Construction Segment to Dominate the Market.
7. Are there any restraints impacting market growth?
Threat of Medium-density Fiberboard (MDF) as a Substitute; Lower Durability.
8. Can you provide examples of recent developments in the market?
December 2023: Roseburg sold its particle board plant in Simsboro, Louisiana, to Kronospan. This is because Roseburg is engaged in the composites industry, manufacturing MDF and particle boards at various plants across North America.
9. What pricing options are available for accessing the report?
Pricing options include single-user, multi-user, and enterprise licenses priced at USD 4750, USD 5250, and USD 8750 respectively.
10. Is the market size provided in terms of value or volume?
The market size is provided in terms of value, measured in billion and volume, measured in Square Meters.
11. Are there any specific market keywords associated with the report?
Yes, the market keyword associated with the report is "Particle Board Market," which aids in identifying and referencing the specific market segment covered.
12. How do I determine which pricing option suits my needs best?
The pricing options vary based on user requirements and access needs. Individual users may opt for single-user licenses, while businesses requiring broader access may choose multi-user or enterprise licenses for cost-effective access to the report.
13. Are there any additional resources or data provided in the Particle Board Market report?
While the report offers comprehensive insights, it's advisable to review the specific contents or supplementary materials provided to ascertain if additional resources or data are available.
14. How can I stay updated on further developments or reports in the Particle Board Market?
To stay informed about further developments, trends, and reports in the Particle Board Market, consider subscribing to industry newsletters, following relevant companies and organizations, or regularly checking reputable industry news sources and publications.
Methodology
Step 1 - Identification of Relevant Samples Size from Population Database


Step 2 - Approaches for Defining Global Market Size (Value, Volume* & Price*)

Note*: In applicable scenarios
Step 3 - Data Sources
Primary Research
- Web Analytics
- Survey Reports
- Research Institute
- Latest Research Reports
- Opinion Leaders
Secondary Research
- Annual Reports
- White Paper
- Latest Press Release
- Industry Association
- Paid Database
- Investor Presentations

Step 4 - Data Triangulation
Involves using different sources of information in order to increase the validity of a study
These sources are likely to be stakeholders in a program - participants, other researchers, program staff, other community members, and so on.
Then we put all data in single framework & apply various statistical tools to find out the dynamic on the market.
During the analysis stage, feedback from the stakeholder groups would be compared to determine areas of agreement as well as areas of divergence