

Key Insights
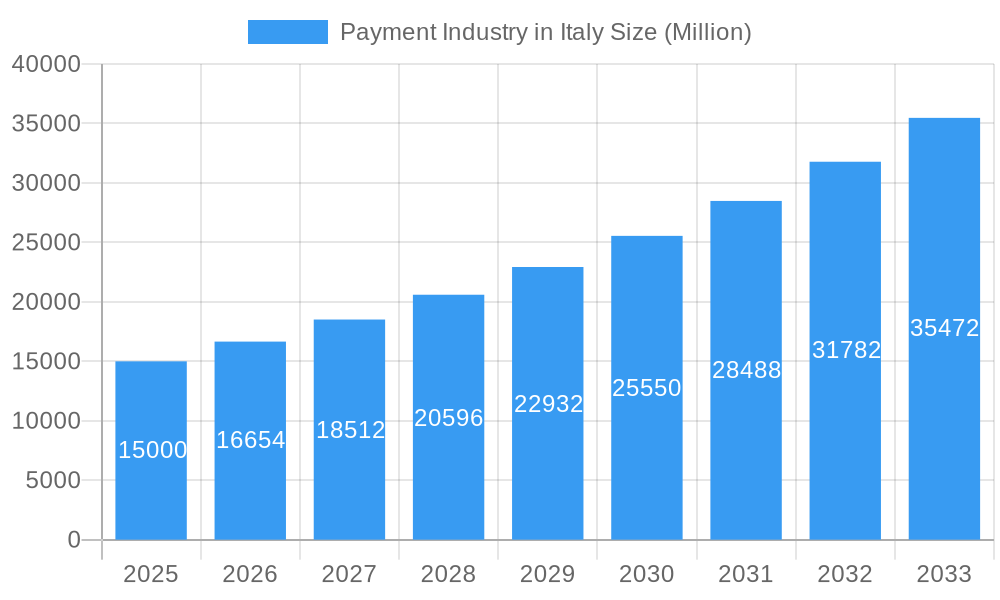
The Italian payment industry, valued at 14.63 billion in the 2025 base year, is projected for significant expansion, exhibiting a Compound Annual Growth Rate (CAGR) of 6% from 2025 to 2033. This robust growth is propelled by the increasing adoption of e-commerce, the rising popularity of contactless payments driven by convenience and enhanced security, and the broad digitalization trend across sectors like retail, entertainment, healthcare, and hospitality. Leading global players such as Apple Pay, PayPal, Visa, and Mastercard are actively competing through technological innovation and strategic alliances. Key considerations for this dynamic market include data security concerns and the ongoing need for digital infrastructure development. Market segmentation by payment mode (point of sale, online) and end-user industry highlights specific growth drivers and investment potential.
Payment Industry in Italy Market Size (In Billion)
The Italian payment market forecast indicates sustained strong growth through 2033, fueled by increasing smartphone penetration and the expanding digital economy. The competitive environment features both established international companies and emerging local providers, fostering continuous innovation. Emerging payment technologies, including mobile wallets and biometric authentication, alongside supportive regulatory changes and government initiatives, will significantly shape the future of the Italian payment industry. Understanding these dynamics is crucial for industry participants and investors targeting the growing Italian digital payments sector.
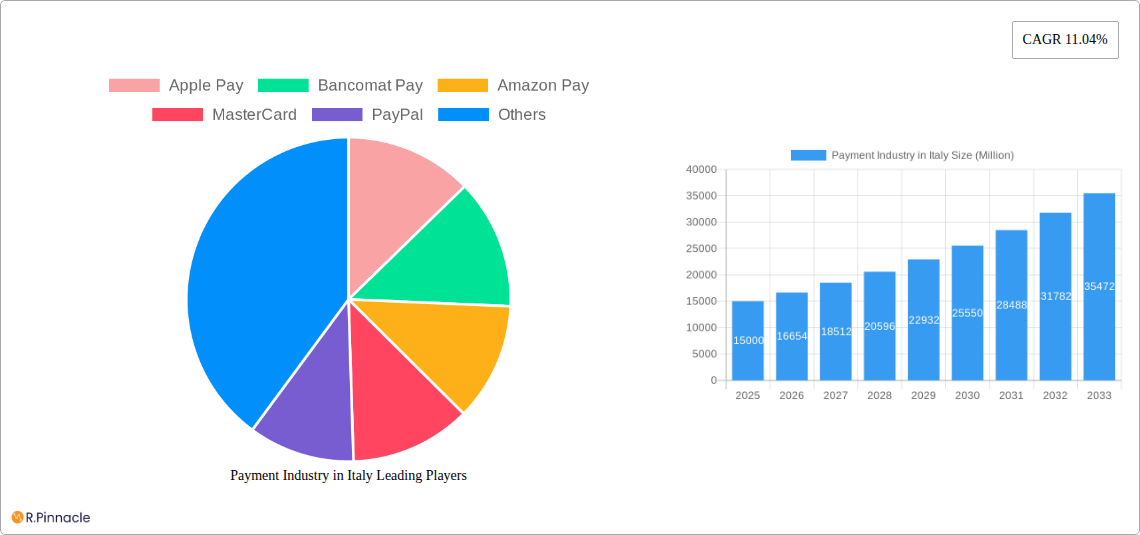
Payment Industry in Italy Company Market Share
Payment Industry in Italy: A Comprehensive Market Report (2019-2033)
This in-depth report provides a comprehensive analysis of the Italian payment industry, covering market structure, dynamics, key players, and future growth prospects. With a study period spanning 2019-2033, a base year of 2025, and a forecast period of 2025-2033, this report offers invaluable insights for industry professionals, investors, and strategic decision-makers. The report leverages extensive market research to provide actionable intelligence on market size (in Millions), growth drivers, challenges, and opportunities within the Italian payment landscape.
Payment Industry in Italy Market Structure & Innovation Trends
This section analyzes the competitive landscape of the Italian payment industry, focusing on market concentration, innovation drivers, regulatory frameworks, and M&A activity. The Italian payment market is characterized by a mix of established players and emerging fintech companies, leading to a dynamic and evolving landscape.
Market Concentration: The market is moderately concentrated, with key players like Visa, Mastercard, PayPal, and domestic players like Postepay holding significant market share. However, the emergence of mobile payment solutions and open banking initiatives is fostering competition. Precise market share data for 2025 is currently unavailable and requires deeper analysis. Estimates indicate that the top 5 players collectively hold approximately xx% of the market.
Innovation Drivers: The key drivers of innovation include the increasing adoption of digital technologies, the growing demand for contactless payments, and the government's push for digitalization. The rising popularity of mobile wallets like Apple Pay and Bancomat Pay is a clear indicator of this trend.
Regulatory Framework: The Italian regulatory framework is continuously evolving to keep pace with technological advancements and to ensure consumer protection. Compliance with PSD2 and other regulations is crucial for players operating in the market.
Product Substitutes: The main substitutes for traditional payment methods include mobile wallets, online banking transfers, and cryptocurrencies. The growth of these alternatives is impacting the traditional payment methods market share.
End-User Demographics: The Italian market shows a growing segment of digitally savvy consumers, particularly among younger demographics, who are driving the adoption of digital payment solutions. Older demographics still prefer traditional methods.
M&A Activities: The Italian payment industry has witnessed significant M&A activity in recent years. Notable examples include the acquisition of Axepta Italy by Worldline (January 2022), showcasing the consolidation trend in the sector. The total value of M&A deals in the last 5 years is estimated at €xx Million.
Payment Industry in Italy Market Dynamics & Trends
This section examines the market dynamics and trends shaping the Italian payment industry, including market growth drivers, technological disruptions, consumer preferences, and competitive dynamics. The Italian payment market is experiencing robust growth, driven by several factors.
The market is experiencing substantial growth, with a Compound Annual Growth Rate (CAGR) projected at xx% during the forecast period (2025-2033). This growth is propelled by increased digitalization, a rising preference for contactless payments, and expansion of e-commerce. Market penetration of digital payment methods is estimated to reach xx% by 2033. Key factors influencing market dynamics include rising smartphone penetration, improving digital literacy, and government initiatives promoting digital transactions. The competitive landscape is intensifying, with both established players and new entrants vying for market share through innovation and strategic partnerships.
Dominant Regions & Segments in Payment Industry in Italy
This section identifies the leading regions and segments within the Italian payment industry. While granular regional data may require further investigation, it's anticipated that the most populous and economically active regions will dominate.
By End-user Industry: The Retail segment is currently the largest, followed by the Hospitality and Entertainment sectors. Strong growth is expected in the Healthcare sector driven by digital transformation.
- Retail: Driven by high consumer spending and widespread adoption of point-of-sale (POS) systems.
- Hospitality: Fueled by the increasing popularity of online booking platforms and mobile payments in hotels and restaurants.
- Healthcare: Growth is attributed to increased use of digital payment methods for medical services and insurance payments.
- Entertainment: The sector is showing strong growth as consumers increasingly use digital channels for ticket purchases and streaming subscriptions.
By Mode of Payment: Point-of-Sale (POS) payments remain the dominant mode, but online sales are experiencing rapid growth fueled by increasing e-commerce adoption.
- Point of Sale: Traditional POS systems are still prevalent, but are being supplemented by contactless and mobile payment options.
- Online Sale: The rapid expansion of e-commerce is driving the growth of online payment methods. The security and reliability of online transactions are crucial drivers in this segment.
Payment Industry in Italy Product Innovations
The Italian payment industry is witnessing significant product innovation. Mobile wallets like Apple Pay and Google Pay are gaining traction, alongside contactless payment solutions. Open banking initiatives are facilitating seamless integration between financial institutions and third-party providers, leading to the development of innovative payment solutions. The integration of biometrics and AI is also enhancing security and personalization of payment experiences. These innovations improve the convenience, security, and efficiency of payments, increasing their adoption.
Report Scope & Segmentation Analysis
This report segments the Italian payment market based on end-user industry (Retail, Entertainment, Healthcare, Hospitality, Other End-user Industries), mode of payment (Point of Sale, Online Sale), and key players. Each segment is analyzed for its growth projections, market size, and competitive dynamics. Projected market sizes for 2033, and further segment breakdowns are available within the full report.
Key Drivers of Payment Industry in Italy Growth
Several key factors drive the growth of the Italian payment industry: The increasing adoption of digital technologies, the growing preference for cashless transactions, and the government's push for digitalization are major catalysts. Furthermore, supportive regulatory frameworks and the increasing penetration of smartphones are enhancing the digital payment ecosystem. The expansion of e-commerce and the growing number of online businesses are also pushing growth.
Challenges in the Payment Industry in Italy Sector
The Italian payment industry faces several challenges. Regulatory hurdles and compliance costs can impede innovation and growth. The presence of legacy systems and infrastructure limitations in some areas can slow down the digital transition. Maintaining robust security measures to counter fraud and cyber threats is crucial. Finally, intense competition requires continuous investment in innovation and customer acquisition.
Emerging Opportunities in Payment Industry in Italy
The Italian payment industry presents many promising opportunities. The growth of mobile payments, particularly amongst younger demographics, creates potential for expansion. Open banking presents opportunities for innovation in payments. The rise of Buy Now, Pay Later (BNPL) services suggests an emerging market segment. Finally, catering to specific sectors like healthcare and the expanding e-commerce market offers high growth potential.
Leading Players in the Payment Industry in Italy Market
- Apple Pay
- Bancomat Pay
- Amazon Pay
- MasterCard
- PayPal
- CartaSi
- Postepay
- MyBank
- Visa
- American Express
Key Developments in Payment Industry in Italy Industry
- November 2021: BBVA partnered with Banca Sella to offer local payment services in Italy via Fabrick.
- January 2022: Worldline acquired Axepta Italy, expanding its presence in the market.
Future Outlook for Payment Industry in Italy Market
The future of the Italian payment industry is bright. Continued digitalization, expanding e-commerce, and increasing consumer preference for digital payment methods will fuel market expansion. Innovation in areas like mobile payments, open banking, and BNPL services will shape the competitive landscape. The market's growth potential is considerable, and strategic investments in technology and infrastructure will be key to capturing opportunities in the years to come.
Payment Industry in Italy Segmentation
-
1. Mode of Payment
-
1.1. Point of Sale
- 1.1.1. Card Pay
- 1.1.2. Digital Wallet (includes Mobile Wallets)
- 1.1.3. Cash
- 1.1.4. Others
- 1.2. Online Sale
-
1.1. Point of Sale
-
2. End-user Industry
- 2.1. Retail
- 2.2. Entertainment
- 2.3. Healthcare
- 2.4. Hospitality
- 2.5. Other End-user Industries
Payment Industry in Italy Segmentation By Geography
-
1. North America
- 1.1. United States
- 1.2. Canada
- 1.3. Mexico
-
2. South America
- 2.1. Brazil
- 2.2. Argentina
- 2.3. Rest of South America
-
3. Europe
- 3.1. United Kingdom
- 3.2. Germany
- 3.3. France
- 3.4. Italy
- 3.5. Spain
- 3.6. Russia
- 3.7. Benelux
- 3.8. Nordics
- 3.9. Rest of Europe
-
4. Middle East & Africa
- 4.1. Turkey
- 4.2. Israel
- 4.3. GCC
- 4.4. North Africa
- 4.5. South Africa
- 4.6. Rest of Middle East & Africa
-
5. Asia Pacific
- 5.1. China
- 5.2. India
- 5.3. Japan
- 5.4. South Korea
- 5.5. ASEAN
- 5.6. Oceania
- 5.7. Rest of Asia Pacific
Payment Industry in Italy Regional Market Share
Geographic Coverage of Payment Industry in Italy
Payment Industry in Italy REPORT HIGHLIGHTS
| Aspects | Details |
|---|---|
| Study Period | 2020-2034 |
| Base Year | 2025 |
| Estimated Year | 2026 |
| Forecast Period | 2026-2034 |
| Historical Period | 2020-2025 |
| Growth Rate | CAGR of 6% from 2020-2034 |
| Segmentation |
|
Table of Contents
- 1. Introduction
- 1.1. Research Scope
- 1.2. Market Segmentation
- 1.3. Research Objective
- 1.4. Definitions and Assumptions
- 2. Executive Summary
- 2.1. Market Snapshot
- 3. Market Dynamics
- 3.1. Market Drivers
- 3.2. Market Restrains
- 3.3. Market Trends
- 3.4. Market Opportunities
- 4. Market Factor Analysis
- 4.1. Porters Five Forces
- 4.1.1. Bargaining Power of Suppliers
- 4.1.2. Bargaining Power of Buyers
- 4.1.3. Threat of New Entrants
- 4.1.4. Threat of Substitutes
- 4.1.5. Competitive Rivalry
- 4.2. PESTEL analysis
- 4.3. BCG Analysis
- 4.3.1. Stars (High Growth, High Market Share)
- 4.3.2. Cash Cows (Low Growth, High Market Share)
- 4.3.3. Question Mark (High Growth, Low Market Share)
- 4.3.4. Dogs (Low Growth, Low Market Share)
- 4.4. Ansoff Matrix Analysis
- 4.5. Supply Chain Analysis
- 4.6. Regulatory Landscape
- 4.7. Current Market Potential and Opportunity Assessment (TAM–SAM–SOM Framework)
- 4.8. PRI Analyst Note
- 4.1. Porters Five Forces
- 5. Market Analysis, Insights and Forecast 2021-2033
- 5.1. Market Analysis, Insights and Forecast - by Mode of Payment
- 5.1.1. Point of Sale
- 5.1.1.1. Card Pay
- 5.1.1.2. Digital Wallet (includes Mobile Wallets)
- 5.1.1.3. Cash
- 5.1.1.4. Others
- 5.1.2. Online Sale
- 5.1.1. Point of Sale
- 5.2. Market Analysis, Insights and Forecast - by End-user Industry
- 5.2.1. Retail
- 5.2.2. Entertainment
- 5.2.3. Healthcare
- 5.2.4. Hospitality
- 5.2.5. Other End-user Industries
- 5.3. Market Analysis, Insights and Forecast - by Region
- 5.3.1. North America
- 5.3.2. South America
- 5.3.3. Europe
- 5.3.4. Middle East & Africa
- 5.3.5. Asia Pacific
- 5.1. Market Analysis, Insights and Forecast - by Mode of Payment
- 6. Global Payment Industry in Italy Analysis, Insights and Forecast, 2021-2033
- 6.1. Market Analysis, Insights and Forecast - by Mode of Payment
- 6.1.1. Point of Sale
- 6.1.1.1. Card Pay
- 6.1.1.2. Digital Wallet (includes Mobile Wallets)
- 6.1.1.3. Cash
- 6.1.1.4. Others
- 6.1.2. Online Sale
- 6.1.1. Point of Sale
- 6.2. Market Analysis, Insights and Forecast - by End-user Industry
- 6.2.1. Retail
- 6.2.2. Entertainment
- 6.2.3. Healthcare
- 6.2.4. Hospitality
- 6.2.5. Other End-user Industries
- 6.1. Market Analysis, Insights and Forecast - by Mode of Payment
- 7. North America Payment Industry in Italy Analysis, Insights and Forecast, 2020-2032
- 7.1. Market Analysis, Insights and Forecast - by Mode of Payment
- 7.1.1. Point of Sale
- 7.1.1.1. Card Pay
- 7.1.1.2. Digital Wallet (includes Mobile Wallets)
- 7.1.1.3. Cash
- 7.1.1.4. Others
- 7.1.2. Online Sale
- 7.1.1. Point of Sale
- 7.2. Market Analysis, Insights and Forecast - by End-user Industry
- 7.2.1. Retail
- 7.2.2. Entertainment
- 7.2.3. Healthcare
- 7.2.4. Hospitality
- 7.2.5. Other End-user Industries
- 7.1. Market Analysis, Insights and Forecast - by Mode of Payment
- 8. South America Payment Industry in Italy Analysis, Insights and Forecast, 2020-2032
- 8.1. Market Analysis, Insights and Forecast - by Mode of Payment
- 8.1.1. Point of Sale
- 8.1.1.1. Card Pay
- 8.1.1.2. Digital Wallet (includes Mobile Wallets)
- 8.1.1.3. Cash
- 8.1.1.4. Others
- 8.1.2. Online Sale
- 8.1.1. Point of Sale
- 8.2. Market Analysis, Insights and Forecast - by End-user Industry
- 8.2.1. Retail
- 8.2.2. Entertainment
- 8.2.3. Healthcare
- 8.2.4. Hospitality
- 8.2.5. Other End-user Industries
- 8.1. Market Analysis, Insights and Forecast - by Mode of Payment
- 9. Europe Payment Industry in Italy Analysis, Insights and Forecast, 2020-2032
- 9.1. Market Analysis, Insights and Forecast - by Mode of Payment
- 9.1.1. Point of Sale
- 9.1.1.1. Card Pay
- 9.1.1.2. Digital Wallet (includes Mobile Wallets)
- 9.1.1.3. Cash
- 9.1.1.4. Others
- 9.1.2. Online Sale
- 9.1.1. Point of Sale
- 9.2. Market Analysis, Insights and Forecast - by End-user Industry
- 9.2.1. Retail
- 9.2.2. Entertainment
- 9.2.3. Healthcare
- 9.2.4. Hospitality
- 9.2.5. Other End-user Industries
- 9.1. Market Analysis, Insights and Forecast - by Mode of Payment
- 10. Middle East & Africa Payment Industry in Italy Analysis, Insights and Forecast, 2020-2032
- 10.1. Market Analysis, Insights and Forecast - by Mode of Payment
- 10.1.1. Point of Sale
- 10.1.1.1. Card Pay
- 10.1.1.2. Digital Wallet (includes Mobile Wallets)
- 10.1.1.3. Cash
- 10.1.1.4. Others
- 10.1.2. Online Sale
- 10.1.1. Point of Sale
- 10.2. Market Analysis, Insights and Forecast - by End-user Industry
- 10.2.1. Retail
- 10.2.2. Entertainment
- 10.2.3. Healthcare
- 10.2.4. Hospitality
- 10.2.5. Other End-user Industries
- 10.1. Market Analysis, Insights and Forecast - by Mode of Payment
- 11. Asia Pacific Payment Industry in Italy Analysis, Insights and Forecast, 2020-2032
- 11.1. Market Analysis, Insights and Forecast - by Mode of Payment
- 11.1.1. Point of Sale
- 11.1.1.1. Card Pay
- 11.1.1.2. Digital Wallet (includes Mobile Wallets)
- 11.1.1.3. Cash
- 11.1.1.4. Others
- 11.1.2. Online Sale
- 11.1.1. Point of Sale
- 11.2. Market Analysis, Insights and Forecast - by End-user Industry
- 11.2.1. Retail
- 11.2.2. Entertainment
- 11.2.3. Healthcare
- 11.2.4. Hospitality
- 11.2.5. Other End-user Industries
- 11.1. Market Analysis, Insights and Forecast - by Mode of Payment
- 12. Competitive Analysis
- 12.1. Company Profiles
- 12.1.1 Apple Pay
- 12.1.1.1. Company Overview
- 12.1.1.2. Products
- 12.1.1.3. Company Financials
- 12.1.1.4. SWOT Analysis
- 12.1.2 Bancomat Pay
- 12.1.2.1. Company Overview
- 12.1.2.2. Products
- 12.1.2.3. Company Financials
- 12.1.2.4. SWOT Analysis
- 12.1.3 Amazon Pay
- 12.1.3.1. Company Overview
- 12.1.3.2. Products
- 12.1.3.3. Company Financials
- 12.1.3.4. SWOT Analysis
- 12.1.4 MasterCard
- 12.1.4.1. Company Overview
- 12.1.4.2. Products
- 12.1.4.3. Company Financials
- 12.1.4.4. SWOT Analysis
- 12.1.5 PayPal
- 12.1.5.1. Company Overview
- 12.1.5.2. Products
- 12.1.5.3. Company Financials
- 12.1.5.4. SWOT Analysis
- 12.1.6 CartaSi
- 12.1.6.1. Company Overview
- 12.1.6.2. Products
- 12.1.6.3. Company Financials
- 12.1.6.4. SWOT Analysis
- 12.1.7 Postepay
- 12.1.7.1. Company Overview
- 12.1.7.2. Products
- 12.1.7.3. Company Financials
- 12.1.7.4. SWOT Analysis
- 12.1.8 MyBank
- 12.1.8.1. Company Overview
- 12.1.8.2. Products
- 12.1.8.3. Company Financials
- 12.1.8.4. SWOT Analysis
- 12.1.9 Visa
- 12.1.9.1. Company Overview
- 12.1.9.2. Products
- 12.1.9.3. Company Financials
- 12.1.9.4. SWOT Analysis
- 12.1.10 American Express
- 12.1.10.1. Company Overview
- 12.1.10.2. Products
- 12.1.10.3. Company Financials
- 12.1.10.4. SWOT Analysis
- 12.1.1 Apple Pay
- 12.2. Market Entropy
- 12.2.1 Company's Key Areas Served
- 12.2.2 Recent Developments
- 12.3. Company Market Share Analysis 2025
- 12.3.1 Top 5 Companies Market Share Analysis
- 12.3.2 Top 3 Companies Market Share Analysis
- 12.4. List of Potential Customers
- 13. Research Methodology
List of Figures
- Figure 1: Global Payment Industry in Italy Revenue Breakdown (billion, %) by Region 2025 & 2033
- Figure 2: Global Payment Industry in Italy Volume Breakdown (K Unit, %) by Region 2025 & 2033
- Figure 3: North America Payment Industry in Italy Revenue (billion), by Mode of Payment 2025 & 2033
- Figure 4: North America Payment Industry in Italy Volume (K Unit), by Mode of Payment 2025 & 2033
- Figure 5: North America Payment Industry in Italy Revenue Share (%), by Mode of Payment 2025 & 2033
- Figure 6: North America Payment Industry in Italy Volume Share (%), by Mode of Payment 2025 & 2033
- Figure 7: North America Payment Industry in Italy Revenue (billion), by End-user Industry 2025 & 2033
- Figure 8: North America Payment Industry in Italy Volume (K Unit), by End-user Industry 2025 & 2033
- Figure 9: North America Payment Industry in Italy Revenue Share (%), by End-user Industry 2025 & 2033
- Figure 10: North America Payment Industry in Italy Volume Share (%), by End-user Industry 2025 & 2033
- Figure 11: North America Payment Industry in Italy Revenue (billion), by Country 2025 & 2033
- Figure 12: North America Payment Industry in Italy Volume (K Unit), by Country 2025 & 2033
- Figure 13: North America Payment Industry in Italy Revenue Share (%), by Country 2025 & 2033
- Figure 14: North America Payment Industry in Italy Volume Share (%), by Country 2025 & 2033
- Figure 15: South America Payment Industry in Italy Revenue (billion), by Mode of Payment 2025 & 2033
- Figure 16: South America Payment Industry in Italy Volume (K Unit), by Mode of Payment 2025 & 2033
- Figure 17: South America Payment Industry in Italy Revenue Share (%), by Mode of Payment 2025 & 2033
- Figure 18: South America Payment Industry in Italy Volume Share (%), by Mode of Payment 2025 & 2033
- Figure 19: South America Payment Industry in Italy Revenue (billion), by End-user Industry 2025 & 2033
- Figure 20: South America Payment Industry in Italy Volume (K Unit), by End-user Industry 2025 & 2033
- Figure 21: South America Payment Industry in Italy Revenue Share (%), by End-user Industry 2025 & 2033
- Figure 22: South America Payment Industry in Italy Volume Share (%), by End-user Industry 2025 & 2033
- Figure 23: South America Payment Industry in Italy Revenue (billion), by Country 2025 & 2033
- Figure 24: South America Payment Industry in Italy Volume (K Unit), by Country 2025 & 2033
- Figure 25: South America Payment Industry in Italy Revenue Share (%), by Country 2025 & 2033
- Figure 26: South America Payment Industry in Italy Volume Share (%), by Country 2025 & 2033
- Figure 27: Europe Payment Industry in Italy Revenue (billion), by Mode of Payment 2025 & 2033
- Figure 28: Europe Payment Industry in Italy Volume (K Unit), by Mode of Payment 2025 & 2033
- Figure 29: Europe Payment Industry in Italy Revenue Share (%), by Mode of Payment 2025 & 2033
- Figure 30: Europe Payment Industry in Italy Volume Share (%), by Mode of Payment 2025 & 2033
- Figure 31: Europe Payment Industry in Italy Revenue (billion), by End-user Industry 2025 & 2033
- Figure 32: Europe Payment Industry in Italy Volume (K Unit), by End-user Industry 2025 & 2033
- Figure 33: Europe Payment Industry in Italy Revenue Share (%), by End-user Industry 2025 & 2033
- Figure 34: Europe Payment Industry in Italy Volume Share (%), by End-user Industry 2025 & 2033
- Figure 35: Europe Payment Industry in Italy Revenue (billion), by Country 2025 & 2033
- Figure 36: Europe Payment Industry in Italy Volume (K Unit), by Country 2025 & 2033
- Figure 37: Europe Payment Industry in Italy Revenue Share (%), by Country 2025 & 2033
- Figure 38: Europe Payment Industry in Italy Volume Share (%), by Country 2025 & 2033
- Figure 39: Middle East & Africa Payment Industry in Italy Revenue (billion), by Mode of Payment 2025 & 2033
- Figure 40: Middle East & Africa Payment Industry in Italy Volume (K Unit), by Mode of Payment 2025 & 2033
- Figure 41: Middle East & Africa Payment Industry in Italy Revenue Share (%), by Mode of Payment 2025 & 2033
- Figure 42: Middle East & Africa Payment Industry in Italy Volume Share (%), by Mode of Payment 2025 & 2033
- Figure 43: Middle East & Africa Payment Industry in Italy Revenue (billion), by End-user Industry 2025 & 2033
- Figure 44: Middle East & Africa Payment Industry in Italy Volume (K Unit), by End-user Industry 2025 & 2033
- Figure 45: Middle East & Africa Payment Industry in Italy Revenue Share (%), by End-user Industry 2025 & 2033
- Figure 46: Middle East & Africa Payment Industry in Italy Volume Share (%), by End-user Industry 2025 & 2033
- Figure 47: Middle East & Africa Payment Industry in Italy Revenue (billion), by Country 2025 & 2033
- Figure 48: Middle East & Africa Payment Industry in Italy Volume (K Unit), by Country 2025 & 2033
- Figure 49: Middle East & Africa Payment Industry in Italy Revenue Share (%), by Country 2025 & 2033
- Figure 50: Middle East & Africa Payment Industry in Italy Volume Share (%), by Country 2025 & 2033
- Figure 51: Asia Pacific Payment Industry in Italy Revenue (billion), by Mode of Payment 2025 & 2033
- Figure 52: Asia Pacific Payment Industry in Italy Volume (K Unit), by Mode of Payment 2025 & 2033
- Figure 53: Asia Pacific Payment Industry in Italy Revenue Share (%), by Mode of Payment 2025 & 2033
- Figure 54: Asia Pacific Payment Industry in Italy Volume Share (%), by Mode of Payment 2025 & 2033
- Figure 55: Asia Pacific Payment Industry in Italy Revenue (billion), by End-user Industry 2025 & 2033
- Figure 56: Asia Pacific Payment Industry in Italy Volume (K Unit), by End-user Industry 2025 & 2033
- Figure 57: Asia Pacific Payment Industry in Italy Revenue Share (%), by End-user Industry 2025 & 2033
- Figure 58: Asia Pacific Payment Industry in Italy Volume Share (%), by End-user Industry 2025 & 2033
- Figure 59: Asia Pacific Payment Industry in Italy Revenue (billion), by Country 2025 & 2033
- Figure 60: Asia Pacific Payment Industry in Italy Volume (K Unit), by Country 2025 & 2033
- Figure 61: Asia Pacific Payment Industry in Italy Revenue Share (%), by Country 2025 & 2033
- Figure 62: Asia Pacific Payment Industry in Italy Volume Share (%), by Country 2025 & 2033
List of Tables
- Table 1: Global Payment Industry in Italy Revenue billion Forecast, by Mode of Payment 2020 & 2033
- Table 2: Global Payment Industry in Italy Volume K Unit Forecast, by Mode of Payment 2020 & 2033
- Table 3: Global Payment Industry in Italy Revenue billion Forecast, by End-user Industry 2020 & 2033
- Table 4: Global Payment Industry in Italy Volume K Unit Forecast, by End-user Industry 2020 & 2033
- Table 5: Global Payment Industry in Italy Revenue billion Forecast, by Region 2020 & 2033
- Table 6: Global Payment Industry in Italy Volume K Unit Forecast, by Region 2020 & 2033
- Table 7: Global Payment Industry in Italy Revenue billion Forecast, by Mode of Payment 2020 & 2033
- Table 8: Global Payment Industry in Italy Volume K Unit Forecast, by Mode of Payment 2020 & 2033
- Table 9: Global Payment Industry in Italy Revenue billion Forecast, by End-user Industry 2020 & 2033
- Table 10: Global Payment Industry in Italy Volume K Unit Forecast, by End-user Industry 2020 & 2033
- Table 11: Global Payment Industry in Italy Revenue billion Forecast, by Country 2020 & 2033
- Table 12: Global Payment Industry in Italy Volume K Unit Forecast, by Country 2020 & 2033
- Table 13: United States Payment Industry in Italy Revenue (billion) Forecast, by Application 2020 & 2033
- Table 14: United States Payment Industry in Italy Volume (K Unit) Forecast, by Application 2020 & 2033
- Table 15: Canada Payment Industry in Italy Revenue (billion) Forecast, by Application 2020 & 2033
- Table 16: Canada Payment Industry in Italy Volume (K Unit) Forecast, by Application 2020 & 2033
- Table 17: Mexico Payment Industry in Italy Revenue (billion) Forecast, by Application 2020 & 2033
- Table 18: Mexico Payment Industry in Italy Volume (K Unit) Forecast, by Application 2020 & 2033
- Table 19: Global Payment Industry in Italy Revenue billion Forecast, by Mode of Payment 2020 & 2033
- Table 20: Global Payment Industry in Italy Volume K Unit Forecast, by Mode of Payment 2020 & 2033
- Table 21: Global Payment Industry in Italy Revenue billion Forecast, by End-user Industry 2020 & 2033
- Table 22: Global Payment Industry in Italy Volume K Unit Forecast, by End-user Industry 2020 & 2033
- Table 23: Global Payment Industry in Italy Revenue billion Forecast, by Country 2020 & 2033
- Table 24: Global Payment Industry in Italy Volume K Unit Forecast, by Country 2020 & 2033
- Table 25: Brazil Payment Industry in Italy Revenue (billion) Forecast, by Application 2020 & 2033
- Table 26: Brazil Payment Industry in Italy Volume (K Unit) Forecast, by Application 2020 & 2033
- Table 27: Argentina Payment Industry in Italy Revenue (billion) Forecast, by Application 2020 & 2033
- Table 28: Argentina Payment Industry in Italy Volume (K Unit) Forecast, by Application 2020 & 2033
- Table 29: Rest of South America Payment Industry in Italy Revenue (billion) Forecast, by Application 2020 & 2033
- Table 30: Rest of South America Payment Industry in Italy Volume (K Unit) Forecast, by Application 2020 & 2033
- Table 31: Global Payment Industry in Italy Revenue billion Forecast, by Mode of Payment 2020 & 2033
- Table 32: Global Payment Industry in Italy Volume K Unit Forecast, by Mode of Payment 2020 & 2033
- Table 33: Global Payment Industry in Italy Revenue billion Forecast, by End-user Industry 2020 & 2033
- Table 34: Global Payment Industry in Italy Volume K Unit Forecast, by End-user Industry 2020 & 2033
- Table 35: Global Payment Industry in Italy Revenue billion Forecast, by Country 2020 & 2033
- Table 36: Global Payment Industry in Italy Volume K Unit Forecast, by Country 2020 & 2033
- Table 37: United Kingdom Payment Industry in Italy Revenue (billion) Forecast, by Application 2020 & 2033
- Table 38: United Kingdom Payment Industry in Italy Volume (K Unit) Forecast, by Application 2020 & 2033
- Table 39: Germany Payment Industry in Italy Revenue (billion) Forecast, by Application 2020 & 2033
- Table 40: Germany Payment Industry in Italy Volume (K Unit) Forecast, by Application 2020 & 2033
- Table 41: France Payment Industry in Italy Revenue (billion) Forecast, by Application 2020 & 2033
- Table 42: France Payment Industry in Italy Volume (K Unit) Forecast, by Application 2020 & 2033
- Table 43: Italy Payment Industry in Italy Revenue (billion) Forecast, by Application 2020 & 2033
- Table 44: Italy Payment Industry in Italy Volume (K Unit) Forecast, by Application 2020 & 2033
- Table 45: Spain Payment Industry in Italy Revenue (billion) Forecast, by Application 2020 & 2033
- Table 46: Spain Payment Industry in Italy Volume (K Unit) Forecast, by Application 2020 & 2033
- Table 47: Russia Payment Industry in Italy Revenue (billion) Forecast, by Application 2020 & 2033
- Table 48: Russia Payment Industry in Italy Volume (K Unit) Forecast, by Application 2020 & 2033
- Table 49: Benelux Payment Industry in Italy Revenue (billion) Forecast, by Application 2020 & 2033
- Table 50: Benelux Payment Industry in Italy Volume (K Unit) Forecast, by Application 2020 & 2033
- Table 51: Nordics Payment Industry in Italy Revenue (billion) Forecast, by Application 2020 & 2033
- Table 52: Nordics Payment Industry in Italy Volume (K Unit) Forecast, by Application 2020 & 2033
- Table 53: Rest of Europe Payment Industry in Italy Revenue (billion) Forecast, by Application 2020 & 2033
- Table 54: Rest of Europe Payment Industry in Italy Volume (K Unit) Forecast, by Application 2020 & 2033
- Table 55: Global Payment Industry in Italy Revenue billion Forecast, by Mode of Payment 2020 & 2033
- Table 56: Global Payment Industry in Italy Volume K Unit Forecast, by Mode of Payment 2020 & 2033
- Table 57: Global Payment Industry in Italy Revenue billion Forecast, by End-user Industry 2020 & 2033
- Table 58: Global Payment Industry in Italy Volume K Unit Forecast, by End-user Industry 2020 & 2033
- Table 59: Global Payment Industry in Italy Revenue billion Forecast, by Country 2020 & 2033
- Table 60: Global Payment Industry in Italy Volume K Unit Forecast, by Country 2020 & 2033
- Table 61: Turkey Payment Industry in Italy Revenue (billion) Forecast, by Application 2020 & 2033
- Table 62: Turkey Payment Industry in Italy Volume (K Unit) Forecast, by Application 2020 & 2033
- Table 63: Israel Payment Industry in Italy Revenue (billion) Forecast, by Application 2020 & 2033
- Table 64: Israel Payment Industry in Italy Volume (K Unit) Forecast, by Application 2020 & 2033
- Table 65: GCC Payment Industry in Italy Revenue (billion) Forecast, by Application 2020 & 2033
- Table 66: GCC Payment Industry in Italy Volume (K Unit) Forecast, by Application 2020 & 2033
- Table 67: North Africa Payment Industry in Italy Revenue (billion) Forecast, by Application 2020 & 2033
- Table 68: North Africa Payment Industry in Italy Volume (K Unit) Forecast, by Application 2020 & 2033
- Table 69: South Africa Payment Industry in Italy Revenue (billion) Forecast, by Application 2020 & 2033
- Table 70: South Africa Payment Industry in Italy Volume (K Unit) Forecast, by Application 2020 & 2033
- Table 71: Rest of Middle East & Africa Payment Industry in Italy Revenue (billion) Forecast, by Application 2020 & 2033
- Table 72: Rest of Middle East & Africa Payment Industry in Italy Volume (K Unit) Forecast, by Application 2020 & 2033
- Table 73: Global Payment Industry in Italy Revenue billion Forecast, by Mode of Payment 2020 & 2033
- Table 74: Global Payment Industry in Italy Volume K Unit Forecast, by Mode of Payment 2020 & 2033
- Table 75: Global Payment Industry in Italy Revenue billion Forecast, by End-user Industry 2020 & 2033
- Table 76: Global Payment Industry in Italy Volume K Unit Forecast, by End-user Industry 2020 & 2033
- Table 77: Global Payment Industry in Italy Revenue billion Forecast, by Country 2020 & 2033
- Table 78: Global Payment Industry in Italy Volume K Unit Forecast, by Country 2020 & 2033
- Table 79: China Payment Industry in Italy Revenue (billion) Forecast, by Application 2020 & 2033
- Table 80: China Payment Industry in Italy Volume (K Unit) Forecast, by Application 2020 & 2033
- Table 81: India Payment Industry in Italy Revenue (billion) Forecast, by Application 2020 & 2033
- Table 82: India Payment Industry in Italy Volume (K Unit) Forecast, by Application 2020 & 2033
- Table 83: Japan Payment Industry in Italy Revenue (billion) Forecast, by Application 2020 & 2033
- Table 84: Japan Payment Industry in Italy Volume (K Unit) Forecast, by Application 2020 & 2033
- Table 85: South Korea Payment Industry in Italy Revenue (billion) Forecast, by Application 2020 & 2033
- Table 86: South Korea Payment Industry in Italy Volume (K Unit) Forecast, by Application 2020 & 2033
- Table 87: ASEAN Payment Industry in Italy Revenue (billion) Forecast, by Application 2020 & 2033
- Table 88: ASEAN Payment Industry in Italy Volume (K Unit) Forecast, by Application 2020 & 2033
- Table 89: Oceania Payment Industry in Italy Revenue (billion) Forecast, by Application 2020 & 2033
- Table 90: Oceania Payment Industry in Italy Volume (K Unit) Forecast, by Application 2020 & 2033
- Table 91: Rest of Asia Pacific Payment Industry in Italy Revenue (billion) Forecast, by Application 2020 & 2033
- Table 92: Rest of Asia Pacific Payment Industry in Italy Volume (K Unit) Forecast, by Application 2020 & 2033
Frequently Asked Questions
1. What is the projected Compound Annual Growth Rate (CAGR) of the Payment Industry in Italy?
The projected CAGR is approximately 6%.
2. Which companies are prominent players in the Payment Industry in Italy?
Key companies in the market include Apple Pay, Bancomat Pay, Amazon Pay, MasterCard, PayPal, CartaSi, Postepay, MyBank, Visa, American Express.
3. What are the main segments of the Payment Industry in Italy?
The market segments include Mode of Payment, End-user Industry.
4. Can you provide details about the market size?
The market size is estimated to be USD 14.63 billion as of 2022.
5. What are some drivers contributing to market growth?
Emerging payment methods are widely accepted; Increasing outward-looking consumer base willing to spend overseas; E-commerce is spreading rapidly. with cross-border e-commerce becoming aided by rising purchasing power..
6. What are the notable trends driving market growth?
Increasing Use of Digital Payments for Online Sale.
7. Are there any restraints impacting market growth?
Lack of Proper Computational Security Infrastructure.
8. Can you provide examples of recent developments in the market?
January 2022 - Worldline, a key European leader in the payments and transactional services industry, announced its acquisition of Axepta Italy. The partnership can be seen as a strategic approach by Worldline to enhance its scale, reach and direct presence in Italy.
9. What pricing options are available for accessing the report?
Pricing options include single-user, multi-user, and enterprise licenses priced at USD 3800, USD 4500, and USD 5800 respectively.
10. Is the market size provided in terms of value or volume?
The market size is provided in terms of value, measured in billion and volume, measured in K Unit.
11. Are there any specific market keywords associated with the report?
Yes, the market keyword associated with the report is "Payment Industry in Italy," which aids in identifying and referencing the specific market segment covered.
12. How do I determine which pricing option suits my needs best?
The pricing options vary based on user requirements and access needs. Individual users may opt for single-user licenses, while businesses requiring broader access may choose multi-user or enterprise licenses for cost-effective access to the report.
13. Are there any additional resources or data provided in the Payment Industry in Italy report?
While the report offers comprehensive insights, it's advisable to review the specific contents or supplementary materials provided to ascertain if additional resources or data are available.
14. How can I stay updated on further developments or reports in the Payment Industry in Italy?
To stay informed about further developments, trends, and reports in the Payment Industry in Italy, consider subscribing to industry newsletters, following relevant companies and organizations, or regularly checking reputable industry news sources and publications.
Methodology
Step 1 - Identification of Relevant Samples Size from Population Database


Step 2 - Approaches for Defining Global Market Size (Value, Volume* & Price*)

Note*: In applicable scenarios
Step 3 - Data Sources
Primary Research
- Web Analytics
- Survey Reports
- Research Institute
- Latest Research Reports
- Opinion Leaders
Secondary Research
- Annual Reports
- White Paper
- Latest Press Release
- Industry Association
- Paid Database
- Investor Presentations

Step 4 - Data Triangulation
Involves using different sources of information in order to increase the validity of a study
These sources are likely to be stakeholders in a program - participants, other researchers, program staff, other community members, and so on.
Then we put all data in single framework & apply various statistical tools to find out the dynamic on the market.
During the analysis stage, feedback from the stakeholder groups would be compared to determine areas of agreement as well as areas of divergence