

Key Insights
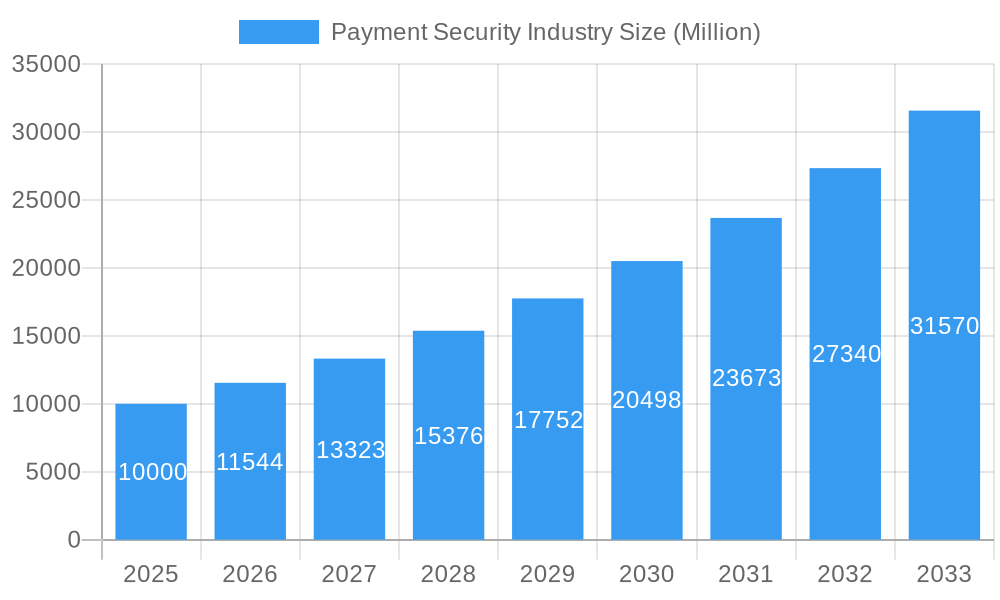
The global payment security market is poised for substantial expansion, projected to reach a market size of 32.72 billion by 2025. This growth trajectory is underpinned by a compelling compound annual growth rate (CAGR) of 17.28%. Key growth drivers include the escalating volume of digital transactions and e-commerce, alongside heightened concerns over data breaches and fraud. Consequently, organizations across diverse sectors are prioritizing investments in sophisticated security solutions. The market is segmented by platform, with mobile-based solutions leading due to widespread smartphone adoption, and by end-user industry, including retail, healthcare, and IT & telecom. Advances in technologies such as tokenization, biometrics, and AI-powered fraud detection further fuel market expansion. While evolving cyber threats and implementation costs present challenges, the overall outlook for payment security remains robust.
Payment Security Industry Market Size (In Billion)
Geographically, North America and Europe currently dominate the payment security market, supported by advanced digital infrastructures and stringent data protection regulations. However, the Asia-Pacific region is anticipated to witness rapid growth, driven by its expanding e-commerce landscape and increasing smartphone penetration. The competitive environment is dynamic, featuring established vendors and innovative startups. Key players are focusing on continuous innovation, strategic collaborations, and mergers to secure market position. Future success will hinge on organizations' ability to proactively address emerging threats, deliver scalable solutions, and adapt to evolving regulatory landscapes.
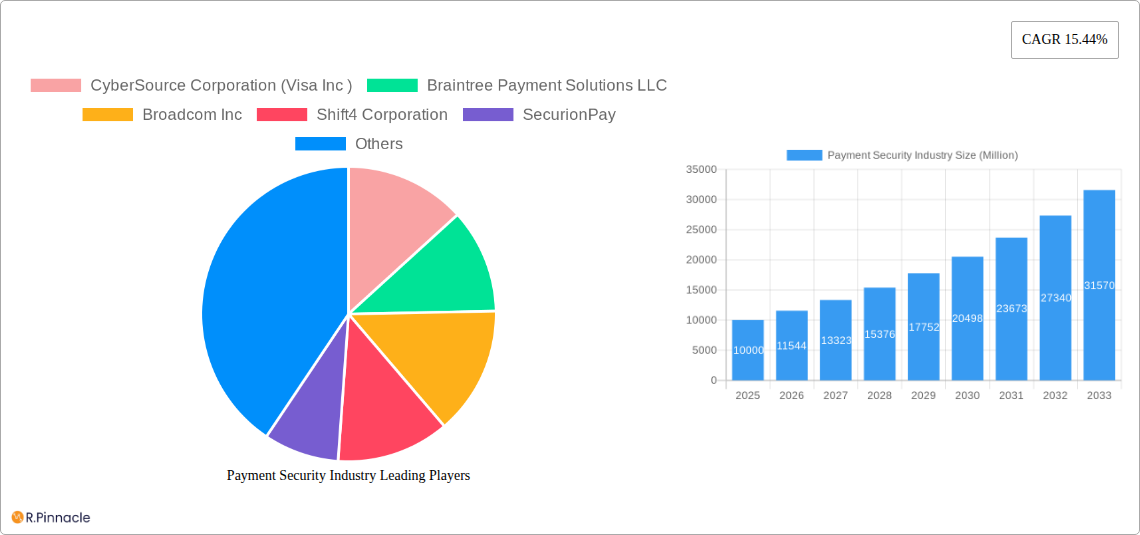
Payment Security Industry Company Market Share
Payment Security Industry Market Report: 2019-2033
This comprehensive report provides a detailed analysis of the Payment Security Industry, projecting a market size of $XX Million by 2033. It offers invaluable insights for industry professionals, investors, and strategists seeking to navigate this rapidly evolving landscape. The study covers the period 2019-2033, with 2025 as the base and estimated year. This report is crucial for understanding market dynamics, key players, and future growth opportunities within the payment security sector.
Payment Security Industry Market Structure & Innovation Trends
The Payment Security Industry is characterized by a moderately concentrated market structure, with key players such as CyberSource Corporation (Visa Inc), Braintree Payment Solutions LLC, Broadcom Inc, and Shift4 Corporation holding significant market share. The exact market share distribution fluctuates, but estimates for 2025 place the top 5 players controlling approximately 60% of the market. Innovation is driven by increasing cybersecurity threats, evolving regulatory frameworks like PSD2 and GDPR, and the rising adoption of digital payments. Product substitutes, primarily less secure payment methods, are constantly challenged by advancements in encryption and authentication technologies.
- Market Concentration: High (Top 5 players control approximately 60% of the market in 2025).
- Innovation Drivers: Cybersecurity threats, regulatory compliance, digital payment adoption.
- M&A Activity: Significant M&A activity observed in the historical period (2019-2024), with deal values exceeding $XX Million annually in recent years (precise figures are available within the report).
- Regulatory Frameworks: PSD2, GDPR, PCI DSS significantly impact market dynamics and drive investment in compliance solutions.
- End-User Demographics: Shift towards a digitally savvy population fuels growth in mobile and web-based payment security solutions.
Payment Security Industry Market Dynamics & Trends
The Payment Security Industry exhibits robust growth, driven by escalating digital transactions, increasing concerns about data breaches, and stringent regulatory requirements. The market is experiencing technological disruptions, primarily from the integration of AI, machine learning, and blockchain technologies. Consumers increasingly prioritize security and convenience, leading to the adoption of advanced authentication methods like biometric authentication.
The market's Compound Annual Growth Rate (CAGR) during the forecast period (2025-2033) is projected to be XX%, exceeding XX% in the historical period. Market penetration for advanced security solutions, such as tokenization and end-to-end encryption, continues to grow. This is fuelled by strong growth in e-commerce and m-commerce adoption in major markets worldwide. Competitive dynamics are intensified by both large established players and emerging fintech firms innovating in this space.
Dominant Regions & Segments in Payment Security Industry
The North American region currently dominates the Payment Security Industry, followed by Europe. Key growth drivers include robust digital infrastructure, high consumer adoption of online transactions, and stringent data protection regulations. Within segments, the web-based platform holds the largest market share, followed by mobile-based platforms. The Retail end-user industry is a significant revenue contributor, followed by Healthcare and Travel and Hospitality.
- North America: Strong digital infrastructure, high consumer adoption, stringent regulations.
- Europe: Growing digital economy, compliance-driven investment in security.
- Web-Based Platform: High market penetration due to established e-commerce ecosystem.
- Retail End-user Industry: High transaction volume and vulnerability to security breaches.
Payment Security Industry Product Innovations
Recent innovations focus on enhancing transaction security through advanced encryption techniques, AI-powered fraud detection, and biometric authentication. These solutions cater to the rising demand for secure and seamless payment experiences across various platforms and end-user industries. Companies are also focusing on developing compliance-ready solutions that adhere to evolving regulatory standards.
Report Scope & Segmentation Analysis
This report comprehensively segments the Payment Security Industry by platform (Mobile Based, Web Based, Other Platforms) and end-user industry (Retail, Healthcare, IT and Telecom, Travel and Hospitality, Other End-user Industry). Each segment's growth projections, market size, and competitive landscape are analyzed in detail providing a granular view of market opportunities. For example, the mobile-based segment is expected to witness substantial growth due to increasing smartphone penetration and mobile commerce adoption.
Key Drivers of Payment Security Industry Growth
The Payment Security Industry's growth is primarily propelled by the surging adoption of digital payments, increasing cybersecurity threats, and stringent regulatory mandates. The rising need for secure transactions across various sectors and geographies is a key driver. Technological advancements in encryption, authentication, and fraud detection further fuel this growth.
Challenges in the Payment Security Industry Sector
The Payment Security Industry faces challenges from evolving cyber threats, increasing regulatory complexity, and the rising cost of compliance. The industry also needs to address the concerns around interoperability and data privacy. These challenges are impacting the industry's profit margins but also fostering innovation. For example, the cost of regulatory compliance is estimated to increase annually by XX% for industry players during the forecast period.
Emerging Opportunities in Payment Security Industry
Emerging opportunities lie in the integration of blockchain technology for enhanced security, AI-powered fraud detection systems, and the expansion into emerging markets with growing digital economies. The development of user-friendly, secure solutions targeting specific industry needs will also unlock considerable growth opportunities.
Leading Players in the Payment Security Industry Market
- CyberSource Corporation (Visa Inc)
- Braintree Payment Solutions LLC
- Broadcom Inc
- Shift4 Corporation
- SecurionPay
- Bluefin Payment Systems LLC
- TNS Inc
- Elavon Inc
- Signified Inc
- TokenEx Inc
Key Developments in Payment Security Industry
- September 2022: Bluefin Payment Systems LLC partnered with Sunmi to certify Sunmi's smart payment terminals, expanding its P2PE device offerings and meeting the demand for next-generation payment acceptance.
- September 2022: Elavon Inc. launched an expanded suite of Oracle-integrated payment solutions for hospitality businesses in the US and Canada, enhancing payment acceptance capabilities for hotels and resorts.
Future Outlook for Payment Security Industry Market
The Payment Security Industry is poised for sustained growth, driven by technological advancements, expanding digitalization, and increasing regulatory scrutiny. The market will likely consolidate further, with larger players acquiring smaller firms to expand their product portfolios and market reach. Strategic partnerships and investments in R&D will be crucial for companies to remain competitive in this dynamic sector.
Payment Security Industry Segmentation
-
1. Platform
- 1.1. Mobile Based
- 1.2. Web Based
- 1.3. Other Platforms
-
2. End-user Industry
- 2.1. Retail
- 2.2. Healthcare
- 2.3. IT and Telecom
- 2.4. Travel and Hospitality
- 2.5. Other End-user Industry
Payment Security Industry Segmentation By Geography
- 1. North America
- 2. Europe
- 3. Asia
- 4. Australia and New Zealand
- 5. Latin America
- 6. Middle East and Africa
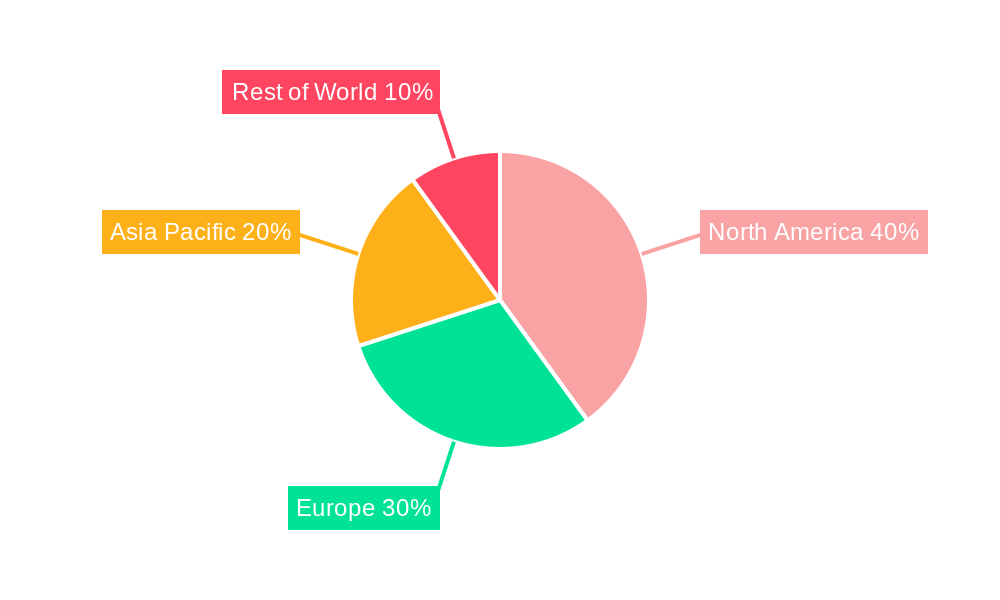
Payment Security Industry Regional Market Share
Geographic Coverage of Payment Security Industry
Payment Security Industry REPORT HIGHLIGHTS
| Aspects | Details |
|---|---|
| Study Period | 2020-2034 |
| Base Year | 2025 |
| Estimated Year | 2026 |
| Forecast Period | 2026-2034 |
| Historical Period | 2020-2025 |
| Growth Rate | CAGR of 17.28% from 2020-2034 |
| Segmentation |
|
Table of Contents
- 1. Introduction
- 1.1. Research Scope
- 1.2. Market Segmentation
- 1.3. Research Objective
- 1.4. Definitions and Assumptions
- 2. Executive Summary
- 2.1. Market Snapshot
- 3. Market Dynamics
- 3.1. Market Drivers
- 3.2. Market Restrains
- 3.3. Market Trends
- 3.4. Market Opportunities
- 4. Market Factor Analysis
- 4.1. Porters Five Forces
- 4.1.1. Bargaining Power of Suppliers
- 4.1.2. Bargaining Power of Buyers
- 4.1.3. Threat of New Entrants
- 4.1.4. Threat of Substitutes
- 4.1.5. Competitive Rivalry
- 4.2. PESTEL analysis
- 4.3. BCG Analysis
- 4.3.1. Stars (High Growth, High Market Share)
- 4.3.2. Cash Cows (Low Growth, High Market Share)
- 4.3.3. Question Mark (High Growth, Low Market Share)
- 4.3.4. Dogs (Low Growth, Low Market Share)
- 4.4. Ansoff Matrix Analysis
- 4.5. Supply Chain Analysis
- 4.6. Regulatory Landscape
- 4.7. Current Market Potential and Opportunity Assessment (TAM–SAM–SOM Framework)
- 4.8. PRI Analyst Note
- 4.1. Porters Five Forces
- 5. Market Analysis, Insights and Forecast 2021-2033
- 5.1. Market Analysis, Insights and Forecast - by Platform
- 5.1.1. Mobile Based
- 5.1.2. Web Based
- 5.1.3. Other Platforms
- 5.2. Market Analysis, Insights and Forecast - by End-user Industry
- 5.2.1. Retail
- 5.2.2. Healthcare
- 5.2.3. IT and Telecom
- 5.2.4. Travel and Hospitality
- 5.2.5. Other End-user Industry
- 5.3. Market Analysis, Insights and Forecast - by Region
- 5.3.1. North America
- 5.3.2. Europe
- 5.3.3. Asia
- 5.3.4. Australia and New Zealand
- 5.3.5. Latin America
- 5.3.6. Middle East and Africa
- 5.1. Market Analysis, Insights and Forecast - by Platform
- 6. Global Payment Security Industry Analysis, Insights and Forecast, 2021-2033
- 6.1. Market Analysis, Insights and Forecast - by Platform
- 6.1.1. Mobile Based
- 6.1.2. Web Based
- 6.1.3. Other Platforms
- 6.2. Market Analysis, Insights and Forecast - by End-user Industry
- 6.2.1. Retail
- 6.2.2. Healthcare
- 6.2.3. IT and Telecom
- 6.2.4. Travel and Hospitality
- 6.2.5. Other End-user Industry
- 6.1. Market Analysis, Insights and Forecast - by Platform
- 7. North America Payment Security Industry Analysis, Insights and Forecast, 2020-2032
- 7.1. Market Analysis, Insights and Forecast - by Platform
- 7.1.1. Mobile Based
- 7.1.2. Web Based
- 7.1.3. Other Platforms
- 7.2. Market Analysis, Insights and Forecast - by End-user Industry
- 7.2.1. Retail
- 7.2.2. Healthcare
- 7.2.3. IT and Telecom
- 7.2.4. Travel and Hospitality
- 7.2.5. Other End-user Industry
- 7.1. Market Analysis, Insights and Forecast - by Platform
- 8. Europe Payment Security Industry Analysis, Insights and Forecast, 2020-2032
- 8.1. Market Analysis, Insights and Forecast - by Platform
- 8.1.1. Mobile Based
- 8.1.2. Web Based
- 8.1.3. Other Platforms
- 8.2. Market Analysis, Insights and Forecast - by End-user Industry
- 8.2.1. Retail
- 8.2.2. Healthcare
- 8.2.3. IT and Telecom
- 8.2.4. Travel and Hospitality
- 8.2.5. Other End-user Industry
- 8.1. Market Analysis, Insights and Forecast - by Platform
- 9. Asia Payment Security Industry Analysis, Insights and Forecast, 2020-2032
- 9.1. Market Analysis, Insights and Forecast - by Platform
- 9.1.1. Mobile Based
- 9.1.2. Web Based
- 9.1.3. Other Platforms
- 9.2. Market Analysis, Insights and Forecast - by End-user Industry
- 9.2.1. Retail
- 9.2.2. Healthcare
- 9.2.3. IT and Telecom
- 9.2.4. Travel and Hospitality
- 9.2.5. Other End-user Industry
- 9.1. Market Analysis, Insights and Forecast - by Platform
- 10. Australia and New Zealand Payment Security Industry Analysis, Insights and Forecast, 2020-2032
- 10.1. Market Analysis, Insights and Forecast - by Platform
- 10.1.1. Mobile Based
- 10.1.2. Web Based
- 10.1.3. Other Platforms
- 10.2. Market Analysis, Insights and Forecast - by End-user Industry
- 10.2.1. Retail
- 10.2.2. Healthcare
- 10.2.3. IT and Telecom
- 10.2.4. Travel and Hospitality
- 10.2.5. Other End-user Industry
- 10.1. Market Analysis, Insights and Forecast - by Platform
- 11. Latin America Payment Security Industry Analysis, Insights and Forecast, 2020-2032
- 11.1. Market Analysis, Insights and Forecast - by Platform
- 11.1.1. Mobile Based
- 11.1.2. Web Based
- 11.1.3. Other Platforms
- 11.2. Market Analysis, Insights and Forecast - by End-user Industry
- 11.2.1. Retail
- 11.2.2. Healthcare
- 11.2.3. IT and Telecom
- 11.2.4. Travel and Hospitality
- 11.2.5. Other End-user Industry
- 11.1. Market Analysis, Insights and Forecast - by Platform
- 12. Middle East and Africa Payment Security Industry Analysis, Insights and Forecast, 2020-2032
- 12.1. Market Analysis, Insights and Forecast - by Platform
- 12.1.1. Mobile Based
- 12.1.2. Web Based
- 12.1.3. Other Platforms
- 12.2. Market Analysis, Insights and Forecast - by End-user Industry
- 12.2.1. Retail
- 12.2.2. Healthcare
- 12.2.3. IT and Telecom
- 12.2.4. Travel and Hospitality
- 12.2.5. Other End-user Industry
- 12.1. Market Analysis, Insights and Forecast - by Platform
- 13. Competitive Analysis
- 13.1. Company Profiles
- 13.1.1 CyberSource Corporation (Visa Inc )
- 13.1.1.1. Company Overview
- 13.1.1.2. Products
- 13.1.1.3. Company Financials
- 13.1.1.4. SWOT Analysis
- 13.1.2 Braintree Payment Solutions LLC
- 13.1.2.1. Company Overview
- 13.1.2.2. Products
- 13.1.2.3. Company Financials
- 13.1.2.4. SWOT Analysis
- 13.1.3 Broadcom Inc
- 13.1.3.1. Company Overview
- 13.1.3.2. Products
- 13.1.3.3. Company Financials
- 13.1.3.4. SWOT Analysis
- 13.1.4 Shift4 Corporation
- 13.1.4.1. Company Overview
- 13.1.4.2. Products
- 13.1.4.3. Company Financials
- 13.1.4.4. SWOT Analysis
- 13.1.5 SecurionPay
- 13.1.5.1. Company Overview
- 13.1.5.2. Products
- 13.1.5.3. Company Financials
- 13.1.5.4. SWOT Analysis
- 13.1.6 Bluefin Payment Systems LLC
- 13.1.6.1. Company Overview
- 13.1.6.2. Products
- 13.1.6.3. Company Financials
- 13.1.6.4. SWOT Analysis
- 13.1.7 TNS Inc
- 13.1.7.1. Company Overview
- 13.1.7.2. Products
- 13.1.7.3. Company Financials
- 13.1.7.4. SWOT Analysis
- 13.1.8 Elavon Inc
- 13.1.8.1. Company Overview
- 13.1.8.2. Products
- 13.1.8.3. Company Financials
- 13.1.8.4. SWOT Analysis
- 13.1.9 Signified Inc
- 13.1.9.1. Company Overview
- 13.1.9.2. Products
- 13.1.9.3. Company Financials
- 13.1.9.4. SWOT Analysis
- 13.1.10 TokenEx Inc
- 13.1.10.1. Company Overview
- 13.1.10.2. Products
- 13.1.10.3. Company Financials
- 13.1.10.4. SWOT Analysis
- 13.1.1 CyberSource Corporation (Visa Inc )
- 13.2. Market Entropy
- 13.2.1 Company's Key Areas Served
- 13.2.2 Recent Developments
- 13.3. Company Market Share Analysis 2025
- 13.3.1 Top 5 Companies Market Share Analysis
- 13.3.2 Top 3 Companies Market Share Analysis
- 13.4. List of Potential Customers
- 14. Research Methodology
List of Figures
- Figure 1: Global Payment Security Industry Revenue Breakdown (billion, %) by Region 2025 & 2033
- Figure 2: North America Payment Security Industry Revenue (billion), by Platform 2025 & 2033
- Figure 3: North America Payment Security Industry Revenue Share (%), by Platform 2025 & 2033
- Figure 4: North America Payment Security Industry Revenue (billion), by End-user Industry 2025 & 2033
- Figure 5: North America Payment Security Industry Revenue Share (%), by End-user Industry 2025 & 2033
- Figure 6: North America Payment Security Industry Revenue (billion), by Country 2025 & 2033
- Figure 7: North America Payment Security Industry Revenue Share (%), by Country 2025 & 2033
- Figure 8: Europe Payment Security Industry Revenue (billion), by Platform 2025 & 2033
- Figure 9: Europe Payment Security Industry Revenue Share (%), by Platform 2025 & 2033
- Figure 10: Europe Payment Security Industry Revenue (billion), by End-user Industry 2025 & 2033
- Figure 11: Europe Payment Security Industry Revenue Share (%), by End-user Industry 2025 & 2033
- Figure 12: Europe Payment Security Industry Revenue (billion), by Country 2025 & 2033
- Figure 13: Europe Payment Security Industry Revenue Share (%), by Country 2025 & 2033
- Figure 14: Asia Payment Security Industry Revenue (billion), by Platform 2025 & 2033
- Figure 15: Asia Payment Security Industry Revenue Share (%), by Platform 2025 & 2033
- Figure 16: Asia Payment Security Industry Revenue (billion), by End-user Industry 2025 & 2033
- Figure 17: Asia Payment Security Industry Revenue Share (%), by End-user Industry 2025 & 2033
- Figure 18: Asia Payment Security Industry Revenue (billion), by Country 2025 & 2033
- Figure 19: Asia Payment Security Industry Revenue Share (%), by Country 2025 & 2033
- Figure 20: Australia and New Zealand Payment Security Industry Revenue (billion), by Platform 2025 & 2033
- Figure 21: Australia and New Zealand Payment Security Industry Revenue Share (%), by Platform 2025 & 2033
- Figure 22: Australia and New Zealand Payment Security Industry Revenue (billion), by End-user Industry 2025 & 2033
- Figure 23: Australia and New Zealand Payment Security Industry Revenue Share (%), by End-user Industry 2025 & 2033
- Figure 24: Australia and New Zealand Payment Security Industry Revenue (billion), by Country 2025 & 2033
- Figure 25: Australia and New Zealand Payment Security Industry Revenue Share (%), by Country 2025 & 2033
- Figure 26: Latin America Payment Security Industry Revenue (billion), by Platform 2025 & 2033
- Figure 27: Latin America Payment Security Industry Revenue Share (%), by Platform 2025 & 2033
- Figure 28: Latin America Payment Security Industry Revenue (billion), by End-user Industry 2025 & 2033
- Figure 29: Latin America Payment Security Industry Revenue Share (%), by End-user Industry 2025 & 2033
- Figure 30: Latin America Payment Security Industry Revenue (billion), by Country 2025 & 2033
- Figure 31: Latin America Payment Security Industry Revenue Share (%), by Country 2025 & 2033
- Figure 32: Middle East and Africa Payment Security Industry Revenue (billion), by Platform 2025 & 2033
- Figure 33: Middle East and Africa Payment Security Industry Revenue Share (%), by Platform 2025 & 2033
- Figure 34: Middle East and Africa Payment Security Industry Revenue (billion), by End-user Industry 2025 & 2033
- Figure 35: Middle East and Africa Payment Security Industry Revenue Share (%), by End-user Industry 2025 & 2033
- Figure 36: Middle East and Africa Payment Security Industry Revenue (billion), by Country 2025 & 2033
- Figure 37: Middle East and Africa Payment Security Industry Revenue Share (%), by Country 2025 & 2033
List of Tables
- Table 1: Global Payment Security Industry Revenue billion Forecast, by Platform 2020 & 2033
- Table 2: Global Payment Security Industry Revenue billion Forecast, by End-user Industry 2020 & 2033
- Table 3: Global Payment Security Industry Revenue billion Forecast, by Region 2020 & 2033
- Table 4: Global Payment Security Industry Revenue billion Forecast, by Platform 2020 & 2033
- Table 5: Global Payment Security Industry Revenue billion Forecast, by End-user Industry 2020 & 2033
- Table 6: Global Payment Security Industry Revenue billion Forecast, by Country 2020 & 2033
- Table 7: Global Payment Security Industry Revenue billion Forecast, by Platform 2020 & 2033
- Table 8: Global Payment Security Industry Revenue billion Forecast, by End-user Industry 2020 & 2033
- Table 9: Global Payment Security Industry Revenue billion Forecast, by Country 2020 & 2033
- Table 10: Global Payment Security Industry Revenue billion Forecast, by Platform 2020 & 2033
- Table 11: Global Payment Security Industry Revenue billion Forecast, by End-user Industry 2020 & 2033
- Table 12: Global Payment Security Industry Revenue billion Forecast, by Country 2020 & 2033
- Table 13: Global Payment Security Industry Revenue billion Forecast, by Platform 2020 & 2033
- Table 14: Global Payment Security Industry Revenue billion Forecast, by End-user Industry 2020 & 2033
- Table 15: Global Payment Security Industry Revenue billion Forecast, by Country 2020 & 2033
- Table 16: Global Payment Security Industry Revenue billion Forecast, by Platform 2020 & 2033
- Table 17: Global Payment Security Industry Revenue billion Forecast, by End-user Industry 2020 & 2033
- Table 18: Global Payment Security Industry Revenue billion Forecast, by Country 2020 & 2033
- Table 19: Global Payment Security Industry Revenue billion Forecast, by Platform 2020 & 2033
- Table 20: Global Payment Security Industry Revenue billion Forecast, by End-user Industry 2020 & 2033
- Table 21: Global Payment Security Industry Revenue billion Forecast, by Country 2020 & 2033
Frequently Asked Questions
1. What is the projected Compound Annual Growth Rate (CAGR) of the Payment Security Industry?
The projected CAGR is approximately 17.28%.
2. Which companies are prominent players in the Payment Security Industry?
Key companies in the market include CyberSource Corporation (Visa Inc ), Braintree Payment Solutions LLC, Broadcom Inc, Shift4 Corporation, SecurionPay, Bluefin Payment Systems LLC, TNS Inc, Elavon Inc, Signified Inc, TokenEx Inc.
3. What are the main segments of the Payment Security Industry?
The market segments include Platform, End-user Industry.
4. Can you provide details about the market size?
The market size is estimated to be USD 32.72 billion as of 2022.
5. What are some drivers contributing to market growth?
Growing Adoption of Digital Payment Modes; Increase in Fraudulent Activities in E-commerce.
6. What are the notable trends driving market growth?
Retail Sector to Witness High Growth.
7. Are there any restraints impacting market growth?
Vulnerability of Cloud-based Applications to Cyber Risks.
8. Can you provide examples of recent developments in the market?
September 2022 - Bluefin Payment Systems LLC has announced an industry partnership with commercial hardware manufacturer Sunmi.Through the partnership, Bluefin will work to certify Sunmi's smart payment terminal line, including the P2, P2 PRO, P2 MINI, and the P2 smart pad, and by Adding Sunmi's flexible payment terminals to our listing of P2PE devices will enable Bluefin to meet the demand for next-generation payment acceptance.
9. What pricing options are available for accessing the report?
Pricing options include single-user, multi-user, and enterprise licenses priced at USD 4750, USD 5250, and USD 8750 respectively.
10. Is the market size provided in terms of value or volume?
The market size is provided in terms of value, measured in billion.
11. Are there any specific market keywords associated with the report?
Yes, the market keyword associated with the report is "Payment Security Industry," which aids in identifying and referencing the specific market segment covered.
12. How do I determine which pricing option suits my needs best?
The pricing options vary based on user requirements and access needs. Individual users may opt for single-user licenses, while businesses requiring broader access may choose multi-user or enterprise licenses for cost-effective access to the report.
13. Are there any additional resources or data provided in the Payment Security Industry report?
While the report offers comprehensive insights, it's advisable to review the specific contents or supplementary materials provided to ascertain if additional resources or data are available.
14. How can I stay updated on further developments or reports in the Payment Security Industry?
To stay informed about further developments, trends, and reports in the Payment Security Industry, consider subscribing to industry newsletters, following relevant companies and organizations, or regularly checking reputable industry news sources and publications.
Methodology
Step 1 - Identification of Relevant Samples Size from Population Database


Step 2 - Approaches for Defining Global Market Size (Value, Volume* & Price*)

Note*: In applicable scenarios
Step 3 - Data Sources
Primary Research
- Web Analytics
- Survey Reports
- Research Institute
- Latest Research Reports
- Opinion Leaders
Secondary Research
- Annual Reports
- White Paper
- Latest Press Release
- Industry Association
- Paid Database
- Investor Presentations

Step 4 - Data Triangulation
Involves using different sources of information in order to increase the validity of a study
These sources are likely to be stakeholders in a program - participants, other researchers, program staff, other community members, and so on.
Then we put all data in single framework & apply various statistical tools to find out the dynamic on the market.
During the analysis stage, feedback from the stakeholder groups would be compared to determine areas of agreement as well as areas of divergence