

Key Insights
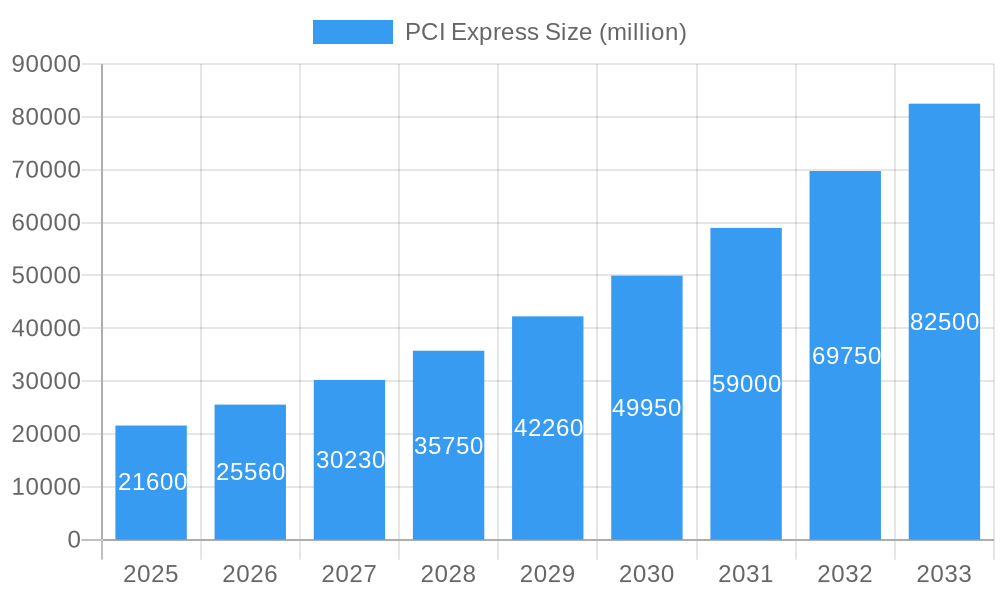
The global PCI Express (PCIe) market is projected for substantial growth, anticipated to reach $1962.5 million by 2025, with an estimated Compound Annual Growth Rate (CAGR) of 12.2% from 2025 to 2033. This expansion is driven by the escalating need for superior bandwidth and accelerated data transfer speeds across diverse applications. The rapid expansion of data centers, fueled by cloud computing, big data analytics, and artificial intelligence, is a primary growth engine, necessitating more robust interconnects to manage immense data volumes. The widespread adoption of advanced graphics cards, high-performance storage, and next-generation networking equipment, all reliant on PCIe, further propels market growth. Continuous evolution of PCIe standards, from early versions to the latest PCIe 5.0 and future iterations, directly addresses these demands with enhanced performance and efficiency.
PCI Express Market Size (In Billion)
Despite strong growth drivers, the market encounters challenges. The increasing complexity and cost of implementing advanced PCIe technologies may deter some users, especially smaller businesses or those with limited budgets. Furthermore, ensuring specialized hardware and software compatibility for newer PCIe versions can pose integration hurdles. Nevertheless, the prevailing digital transformation trend and the persistent drive for enhanced computational power are expected to surmount these obstacles. Leading innovators like Intel, NVIDIA, Samsung, and AMD are spearheading the development and adoption of advanced PCIe solutions. The Asia Pacific region, particularly China and India, is poised to become a significant growth hub due to rapid industrialization, expanding IT infrastructure, and a burgeoning digital economy.
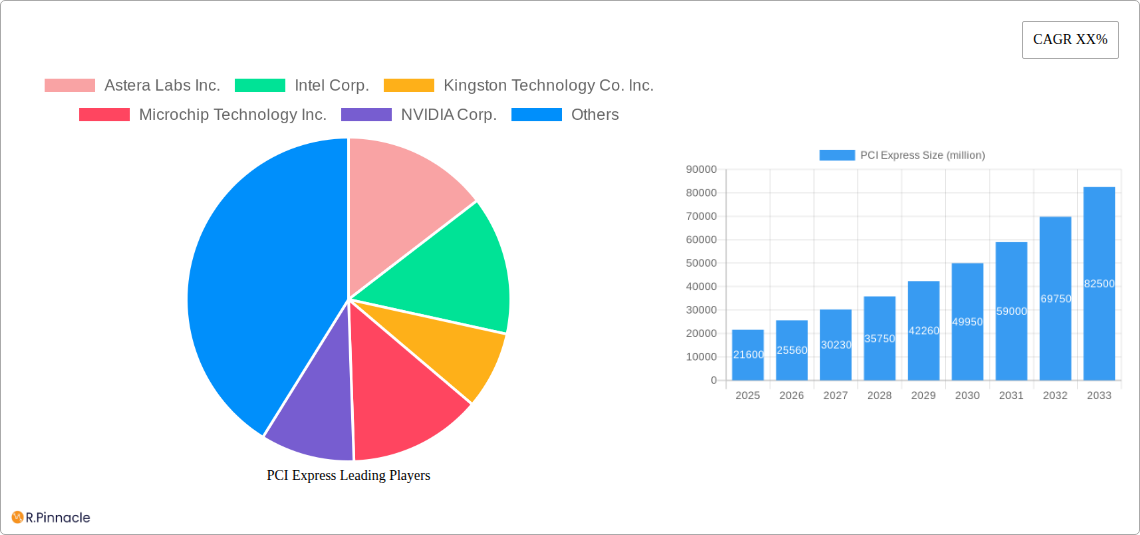
PCI Express Company Market Share
PCI Express Market Structure & Innovation Trends
The PCI Express (PCIe) market, a critical component for high-speed interconnectivity in modern computing, is characterized by a dynamic and moderately concentrated structure. Leading companies such as Intel Corp., NVIDIA Corp., and Samsung Electronics Co. Ltd. hold significant market share due to their extensive R&D capabilities and established product ecosystems. Innovation remains a primary driver, with continuous advancements in PCIe generations (e.g., PCIe 5.0 and beyond) enabling higher bandwidth and lower latency essential for data-intensive applications. Regulatory frameworks, largely governed by industry standards bodies like the PCI-SIG, ensure interoperability and foster fair competition. While direct product substitutes for PCIe in its core function are limited, alternative interconnect technologies within specific niches (e.g., CXL for memory expansion) present indirect competition. End-user demographics span across data centers, high-performance computing, gaming, and enterprise storage, all demanding increasingly robust and scalable solutions. Mergers and acquisitions (M&A) activity, while not consistently high, can significantly impact market concentration. For instance, acquisitions of specialized IP providers or companies with critical technology components could consolidate market power, with deal values often reaching hundreds of millions to over a billion dollars for strategic acquisitions. The market share of key players fluctuates based on their innovation cycles and the adoption rates of new PCIe specifications.
PCI Express Market Dynamics & Trends
The global PCI Express (PCIe) market is experiencing robust expansion, fueled by an insatiable demand for higher bandwidth and lower latency across a myriad of applications, from hyperscale data centers to advanced gaming rigs and cutting-edge AI accelerators. The CAGR for the PCIe market is projected to be around 12.5% during the forecast period of 2025-2033, driven by the relentless evolution of computing power and the increasing data generation across all sectors. Technological disruptions are at the forefront of this growth, with the ongoing transition to PCIe 5.0 and the anticipation of PCIe 6.0 and subsequent generations creating a continuous upgrade cycle. These advancements are critical for overcoming data bottlenecks in CPUs, GPUs, storage devices, and network interface cards, thereby unlocking new levels of performance. Consumer preferences are increasingly skewed towards systems that offer superior performance and future-proofing, making PCIe-enabled components a key purchasing criterion, particularly in the high-end market segments. Competitive dynamics are intense, with major players like Intel Corp., NVIDIA Corp., and Samsung Electronics Co. Ltd. investing heavily in research and development to gain a competitive edge. The market penetration of higher PCIe generations is steadily increasing, as evidenced by the growing adoption of PCIe 5.0 in server motherboards and high-end graphics cards, with an estimated penetration rate of 45% by 2027. The expansion of cloud computing, the proliferation of AI and machine learning workloads, and the ever-increasing volume of data being processed and stored are primary market growth drivers. Furthermore, the rise of specialized applications like autonomous driving and advanced scientific simulations necessitates the high-speed data transfer capabilities that only advanced PCIe versions can provide. This sustained demand creates a fertile ground for continued market growth and technological innovation.
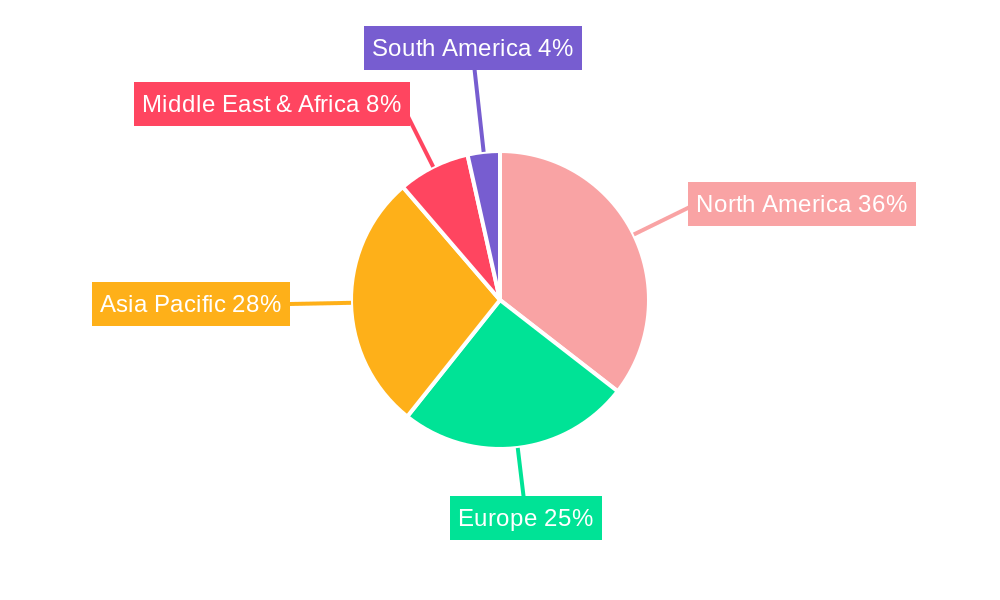
Dominant Regions & Segments in PCI Express
The PCI Express market exhibits significant regional and segmental dominance, largely dictated by the concentration of data-intensive industries and advanced technological adoption. North America, spearheaded by the United States, stands as a dominant region, driven by its robust data center infrastructure, significant investments in AI research and development, and a mature high-performance computing ecosystem. Key economic policies supporting technological innovation and substantial government spending on digital transformation initiatives further bolster its leading position. The concentration of major technology companies, including Intel Corp. and NVIDIA Corp., headquartered in this region, also contributes to its dominance, fostering a vibrant market for PCIe solutions.
Application Segment Dominance
- Data Center: This segment is the undisputed leader, consuming the largest share of PCIe bandwidth and adoption. The exponential growth of cloud computing, hyperscale data centers, and the increasing demand for high-speed storage and networking solutions for AI/ML workloads are the primary drivers. The need for rapid data processing and low latency in these environments makes advanced PCIe versions indispensable.
- Storage: While closely linked to data centers, the storage application segment is also a significant driver, particularly for enterprise-grade SSDs and NVMe drives. The shift towards faster storage solutions for databases, analytics, and virtualized environments directly fuels the demand for PCIe-enabled storage interfaces.
- Others: This broad category includes high-performance computing (HPC), gaming, automotive, and other specialized sectors. While individually smaller than data centers, their combined growth, especially in areas like AI-powered gaming and advanced driver-assistance systems (ADAS), contributes substantially to overall market expansion.
Type Segment Dominance
- PCIe 5.0: This latest generation is rapidly gaining traction and is expected to dominate the market in the coming years. Its XX bandwidth per lane (32 GB/s in each direction) is crucial for next-generation GPUs, CPUs, and high-speed networking cards, making it the preferred choice for high-performance computing and cutting-edge data center deployments.
- PCIe 4.0: Currently a widely adopted standard, PCIe 4.0 continues to hold a significant market share, especially in existing data center infrastructure and a broad range of consumer devices. Its XX bandwidth per lane (16 GB/s) offers substantial performance improvements over its predecessors and strikes a balance between performance and cost for many applications.
- PCIe 3.0: While older, PCIe 3.0 remains relevant in legacy systems and lower-cost devices. Its XX bandwidth per lane (8 GB/s) is sufficient for many less demanding applications, ensuring its continued presence in the market for the foreseeable future, though its market share is expected to decline as newer generations become more prevalent. PCIe 1.0 and PCIe 2.0 have largely been superseded by newer standards and represent a negligible market share.
PCI Express Product Innovations
PCI Express (PCIe) product innovation is characterized by a relentless pursuit of higher bandwidth and lower latency. Recent developments focus on enabling the next generation of accelerators, storage, and networking devices. Innovations in PCIe 5.0 controllers and retimers from companies like Astera Labs Inc. and Rambus Inc. are crucial for extending signal integrity over longer distances, facilitating more complex system designs. Furthermore, the development of PCIe-based interconnects for disaggregated computing architectures, allowing for independent scaling of compute and memory resources, represents a significant technological trend. These advancements provide competitive advantages by enabling unprecedented performance gains in data-intensive applications like AI training and high-frequency trading.
Report Scope & Segmentation Analysis
This report provides a comprehensive analysis of the PCI Express market, segmented by application and type. The scope covers historical data from 2019–2024, a base year of 2025, and a forecast period extending to 2033.
Application Segments:
- Data Center: This segment is projected for substantial growth, with an estimated market size of over $XX billion by 2033, driven by cloud infrastructure expansion and AI workloads.
- Storage: The storage segment is expected to witness robust expansion, with market growth propelled by NVMe adoption and the need for faster data access, reaching over $XX billion by 2033.
- Others: This diverse segment, encompassing HPC, gaming, and automotive, is forecast to grow steadily, with specific sub-segments like gaming poised for accelerated adoption of higher PCIe generations.
Type Segments:
- PCIe 5.0: This segment is anticipated to experience the highest growth rate, driven by its superior performance, with market share rapidly increasing.
- PCIe 4.0: Continuing its strong presence, PCIe 4.0 will remain a significant segment, offering a balance of performance and cost for a wide range of applications.
- PCIe 3.0: This segment will see a gradual decline in market share as newer technologies become more affordable and widely adopted.
Key Drivers of PCI Express Growth
The significant growth trajectory of the PCI Express market is underpinned by several powerful drivers. Technological advancements in processing power and data generation are paramount; the increasing complexity of AI and machine learning algorithms, coupled with the proliferation of big data, necessitates higher bandwidth and lower latency interconnects, which PCIe continuously delivers through its evolutionary roadmap. Economic factors also play a crucial role, with sustained investments in data center infrastructure by cloud providers and enterprises aiming to enhance their computational capabilities and operational efficiency. The growing demand for high-performance computing (HPC) in scientific research, financial modeling, and climate simulation further amplifies the need for advanced PCIe solutions. Additionally, the burgeoning gaming industry, with its focus on immersive experiences and faster load times, acts as a significant consumer of PCIe-enabled graphics cards and storage. The consistent upgrade cycles driven by these factors create a perpetual demand for the latest PCIe specifications.
Challenges in the PCI Express Sector
Despite its robust growth, the PCI Express sector faces several challenges. High development and manufacturing costs associated with implementing the latest PCIe generations, particularly for advanced chipsets and rigorous testing, can pose a barrier to entry and adoption for smaller players. Supply chain complexities and potential disruptions, as seen in the global semiconductor industry, can impact the availability and pricing of PCIe components, affecting manufacturers and end-users alike. Interoperability and compatibility issues between different PCIe generations and components, while largely addressed by the PCI-SIG, can still arise during system integration, requiring extensive validation. Intensifying competition from alternative interconnect technologies, though currently niche, could pose a long-term challenge if they offer comparable performance or unique advantages in specific use cases, potentially impacting market share in those segments.
Emerging Opportunities in PCI Express
The PCI Express market is ripe with emerging opportunities driven by evolving technological landscapes and new application frontiers. The widespread adoption of Artificial Intelligence (AI) and Machine Learning (ML) workloads represents a colossal opportunity, as these applications are inherently data-intensive and require the high bandwidth and low latency that advanced PCIe versions provide for GPUs, TPUs, and specialized AI accelerators. The expansion of edge computing also presents a growing market, where robust and efficient data transfer is crucial for processing data closer to its source. Furthermore, the development of Compute Express Link (CXL), which leverages PCIe physical layers to enable coherent memory pooling and expansion, opens up new paradigms for memory-intensive applications and disaggregated architectures. The increasing sophistication of virtual reality (VR) and augmented reality (AR) experiences demands significant bandwidth for real-time data streaming, presenting another avenue for PCIe growth. Finally, the continuous innovation in server and storage architectures to support greater density and performance in data centers creates ongoing opportunities for PCIe integration.
Leading Players in the PCI Express Market
- Astera Labs Inc.
- Intel Corp.
- Kingston Technology Co. Inc.
- Microchip Technology Inc.
- NVIDIA Corp.
- Rambus Inc.
- Samsung Electronics Co. Ltd.
- Texas Instruments Inc.
- Toshiba Corp.
- Xilinx Inc.
Key Developments in PCI Express Industry
- Q1 2023: Launch of the first PCIe 5.0 SSDs, offering sequential read/write speeds of over 12,000 MB/s, significantly boosting storage performance.
- Q3 2023: Introduction of PCIe 5.0 network interface cards (NICs) with higher bandwidth capabilities, supporting the demands of advanced networking and data center applications.
- Q4 2023: Announcement of initial specifications for PCIe 6.0, focusing on PAM4 signaling for double the bandwidth and enhanced efficiency, signaling the next generation of interconnects.
- Q1 2024: Key players in the CPU market integrate PCIe 5.0 support into their latest processor architectures, driving wider adoption in server and high-end desktop segments.
- Q2 2024: Increased investment in PCIe 5.0 retimer and redriver technologies to overcome signal integrity challenges over longer trace lengths, facilitating more complex motherboard designs.
- Q4 2024: Emergence of early prototypes and roadmap announcements for PCIe 7.0, indicating a continuous drive for doubling bandwidth every few years.
Future Outlook for PCI Express Market
The future outlook for the PCI Express market is exceptionally bright, driven by the relentless digital transformation and the exponential growth of data. The ongoing transition to PCIe 5.0 and the development of future generations like PCIe 6.0 and 7.0 will continue to fuel demand for higher bandwidth and lower latency solutions, essential for powering AI, machine learning, big data analytics, and advanced HPC applications. Strategic opportunities lie in the expanding cloud computing infrastructure, the burgeoning edge computing market, and the integration of PCIe with emerging technologies like CXL for disaggregated memory architectures. As performance demands escalate across all sectors, from enterprise servers to consumer electronics, PCI Express will remain the cornerstone of high-speed interconnectivity, ensuring its sustained growth and market relevance for the foreseeable future.
PCI Express Segmentation
-
1. Application
- 1.1. Storage
- 1.2. Data Center
- 1.3. Others
-
2. Types
- 2.1. PCIe 1.0
- 2.2. PCIe 2.0
- 2.3. PCIe 3.0
- 2.4. PCIe 4.0
- 2.5. PCIe 5.0
PCI Express Segmentation By Geography
-
1. North America
- 1.1. United States
- 1.2. Canada
- 1.3. Mexico
-
2. South America
- 2.1. Brazil
- 2.2. Argentina
- 2.3. Rest of South America
-
3. Europe
- 3.1. United Kingdom
- 3.2. Germany
- 3.3. France
- 3.4. Italy
- 3.5. Spain
- 3.6. Russia
- 3.7. Benelux
- 3.8. Nordics
- 3.9. Rest of Europe
-
4. Middle East & Africa
- 4.1. Turkey
- 4.2. Israel
- 4.3. GCC
- 4.4. North Africa
- 4.5. South Africa
- 4.6. Rest of Middle East & Africa
-
5. Asia Pacific
- 5.1. China
- 5.2. India
- 5.3. Japan
- 5.4. South Korea
- 5.5. ASEAN
- 5.6. Oceania
- 5.7. Rest of Asia Pacific
PCI Express Regional Market Share
Geographic Coverage of PCI Express
PCI Express REPORT HIGHLIGHTS
| Aspects | Details |
|---|---|
| Study Period | 2020-2034 |
| Base Year | 2025 |
| Estimated Year | 2026 |
| Forecast Period | 2026-2034 |
| Historical Period | 2020-2025 |
| Growth Rate | CAGR of 12.2% from 2020-2034 |
| Segmentation |
|
Table of Contents
- 1. Introduction
- 1.1. Research Scope
- 1.2. Market Segmentation
- 1.3. Research Methodology
- 1.4. Definitions and Assumptions
- 2. Executive Summary
- 2.1. Introduction
- 3. Market Dynamics
- 3.1. Introduction
- 3.2. Market Drivers
- 3.3. Market Restrains
- 3.4. Market Trends
- 4. Market Factor Analysis
- 4.1. Porters Five Forces
- 4.2. Supply/Value Chain
- 4.3. PESTEL analysis
- 4.4. Market Entropy
- 4.5. Patent/Trademark Analysis
- 5. Global PCI Express Analysis, Insights and Forecast, 2020-2032
- 5.1. Market Analysis, Insights and Forecast - by Application
- 5.1.1. Storage
- 5.1.2. Data Center
- 5.1.3. Others
- 5.2. Market Analysis, Insights and Forecast - by Types
- 5.2.1. PCIe 1.0
- 5.2.2. PCIe 2.0
- 5.2.3. PCIe 3.0
- 5.2.4. PCIe 4.0
- 5.2.5. PCIe 5.0
- 5.3. Market Analysis, Insights and Forecast - by Region
- 5.3.1. North America
- 5.3.2. South America
- 5.3.3. Europe
- 5.3.4. Middle East & Africa
- 5.3.5. Asia Pacific
- 5.1. Market Analysis, Insights and Forecast - by Application
- 6. North America PCI Express Analysis, Insights and Forecast, 2020-2032
- 6.1. Market Analysis, Insights and Forecast - by Application
- 6.1.1. Storage
- 6.1.2. Data Center
- 6.1.3. Others
- 6.2. Market Analysis, Insights and Forecast - by Types
- 6.2.1. PCIe 1.0
- 6.2.2. PCIe 2.0
- 6.2.3. PCIe 3.0
- 6.2.4. PCIe 4.0
- 6.2.5. PCIe 5.0
- 6.1. Market Analysis, Insights and Forecast - by Application
- 7. South America PCI Express Analysis, Insights and Forecast, 2020-2032
- 7.1. Market Analysis, Insights and Forecast - by Application
- 7.1.1. Storage
- 7.1.2. Data Center
- 7.1.3. Others
- 7.2. Market Analysis, Insights and Forecast - by Types
- 7.2.1. PCIe 1.0
- 7.2.2. PCIe 2.0
- 7.2.3. PCIe 3.0
- 7.2.4. PCIe 4.0
- 7.2.5. PCIe 5.0
- 7.1. Market Analysis, Insights and Forecast - by Application
- 8. Europe PCI Express Analysis, Insights and Forecast, 2020-2032
- 8.1. Market Analysis, Insights and Forecast - by Application
- 8.1.1. Storage
- 8.1.2. Data Center
- 8.1.3. Others
- 8.2. Market Analysis, Insights and Forecast - by Types
- 8.2.1. PCIe 1.0
- 8.2.2. PCIe 2.0
- 8.2.3. PCIe 3.0
- 8.2.4. PCIe 4.0
- 8.2.5. PCIe 5.0
- 8.1. Market Analysis, Insights and Forecast - by Application
- 9. Middle East & Africa PCI Express Analysis, Insights and Forecast, 2020-2032
- 9.1. Market Analysis, Insights and Forecast - by Application
- 9.1.1. Storage
- 9.1.2. Data Center
- 9.1.3. Others
- 9.2. Market Analysis, Insights and Forecast - by Types
- 9.2.1. PCIe 1.0
- 9.2.2. PCIe 2.0
- 9.2.3. PCIe 3.0
- 9.2.4. PCIe 4.0
- 9.2.5. PCIe 5.0
- 9.1. Market Analysis, Insights and Forecast - by Application
- 10. Asia Pacific PCI Express Analysis, Insights and Forecast, 2020-2032
- 10.1. Market Analysis, Insights and Forecast - by Application
- 10.1.1. Storage
- 10.1.2. Data Center
- 10.1.3. Others
- 10.2. Market Analysis, Insights and Forecast - by Types
- 10.2.1. PCIe 1.0
- 10.2.2. PCIe 2.0
- 10.2.3. PCIe 3.0
- 10.2.4. PCIe 4.0
- 10.2.5. PCIe 5.0
- 10.1. Market Analysis, Insights and Forecast - by Application
- 11. Competitive Analysis
- 11.1. Global Market Share Analysis 2025
- 11.2. Company Profiles
- 11.2.1 Astera Labs Inc.
- 11.2.1.1. Overview
- 11.2.1.2. Products
- 11.2.1.3. SWOT Analysis
- 11.2.1.4. Recent Developments
- 11.2.1.5. Financials (Based on Availability)
- 11.2.2 Intel Corp.
- 11.2.2.1. Overview
- 11.2.2.2. Products
- 11.2.2.3. SWOT Analysis
- 11.2.2.4. Recent Developments
- 11.2.2.5. Financials (Based on Availability)
- 11.2.3 Kingston Technology Co. Inc.
- 11.2.3.1. Overview
- 11.2.3.2. Products
- 11.2.3.3. SWOT Analysis
- 11.2.3.4. Recent Developments
- 11.2.3.5. Financials (Based on Availability)
- 11.2.4 Microchip Technology Inc.
- 11.2.4.1. Overview
- 11.2.4.2. Products
- 11.2.4.3. SWOT Analysis
- 11.2.4.4. Recent Developments
- 11.2.4.5. Financials (Based on Availability)
- 11.2.5 NVIDIA Corp.
- 11.2.5.1. Overview
- 11.2.5.2. Products
- 11.2.5.3. SWOT Analysis
- 11.2.5.4. Recent Developments
- 11.2.5.5. Financials (Based on Availability)
- 11.2.6 Rambus Inc.
- 11.2.6.1. Overview
- 11.2.6.2. Products
- 11.2.6.3. SWOT Analysis
- 11.2.6.4. Recent Developments
- 11.2.6.5. Financials (Based on Availability)
- 11.2.7 Samsung Electronics Co. Ltd.
- 11.2.7.1. Overview
- 11.2.7.2. Products
- 11.2.7.3. SWOT Analysis
- 11.2.7.4. Recent Developments
- 11.2.7.5. Financials (Based on Availability)
- 11.2.8 Texas Instruments Inc.
- 11.2.8.1. Overview
- 11.2.8.2. Products
- 11.2.8.3. SWOT Analysis
- 11.2.8.4. Recent Developments
- 11.2.8.5. Financials (Based on Availability)
- 11.2.9 Toshiba Corp.
- 11.2.9.1. Overview
- 11.2.9.2. Products
- 11.2.9.3. SWOT Analysis
- 11.2.9.4. Recent Developments
- 11.2.9.5. Financials (Based on Availability)
- 11.2.10 Xilinx Inc.
- 11.2.10.1. Overview
- 11.2.10.2. Products
- 11.2.10.3. SWOT Analysis
- 11.2.10.4. Recent Developments
- 11.2.10.5. Financials (Based on Availability)
- 11.2.1 Astera Labs Inc.
List of Figures
- Figure 1: Global PCI Express Revenue Breakdown (million, %) by Region 2025 & 2033
- Figure 2: North America PCI Express Revenue (million), by Application 2025 & 2033
- Figure 3: North America PCI Express Revenue Share (%), by Application 2025 & 2033
- Figure 4: North America PCI Express Revenue (million), by Types 2025 & 2033
- Figure 5: North America PCI Express Revenue Share (%), by Types 2025 & 2033
- Figure 6: North America PCI Express Revenue (million), by Country 2025 & 2033
- Figure 7: North America PCI Express Revenue Share (%), by Country 2025 & 2033
- Figure 8: South America PCI Express Revenue (million), by Application 2025 & 2033
- Figure 9: South America PCI Express Revenue Share (%), by Application 2025 & 2033
- Figure 10: South America PCI Express Revenue (million), by Types 2025 & 2033
- Figure 11: South America PCI Express Revenue Share (%), by Types 2025 & 2033
- Figure 12: South America PCI Express Revenue (million), by Country 2025 & 2033
- Figure 13: South America PCI Express Revenue Share (%), by Country 2025 & 2033
- Figure 14: Europe PCI Express Revenue (million), by Application 2025 & 2033
- Figure 15: Europe PCI Express Revenue Share (%), by Application 2025 & 2033
- Figure 16: Europe PCI Express Revenue (million), by Types 2025 & 2033
- Figure 17: Europe PCI Express Revenue Share (%), by Types 2025 & 2033
- Figure 18: Europe PCI Express Revenue (million), by Country 2025 & 2033
- Figure 19: Europe PCI Express Revenue Share (%), by Country 2025 & 2033
- Figure 20: Middle East & Africa PCI Express Revenue (million), by Application 2025 & 2033
- Figure 21: Middle East & Africa PCI Express Revenue Share (%), by Application 2025 & 2033
- Figure 22: Middle East & Africa PCI Express Revenue (million), by Types 2025 & 2033
- Figure 23: Middle East & Africa PCI Express Revenue Share (%), by Types 2025 & 2033
- Figure 24: Middle East & Africa PCI Express Revenue (million), by Country 2025 & 2033
- Figure 25: Middle East & Africa PCI Express Revenue Share (%), by Country 2025 & 2033
- Figure 26: Asia Pacific PCI Express Revenue (million), by Application 2025 & 2033
- Figure 27: Asia Pacific PCI Express Revenue Share (%), by Application 2025 & 2033
- Figure 28: Asia Pacific PCI Express Revenue (million), by Types 2025 & 2033
- Figure 29: Asia Pacific PCI Express Revenue Share (%), by Types 2025 & 2033
- Figure 30: Asia Pacific PCI Express Revenue (million), by Country 2025 & 2033
- Figure 31: Asia Pacific PCI Express Revenue Share (%), by Country 2025 & 2033
List of Tables
- Table 1: Global PCI Express Revenue million Forecast, by Application 2020 & 2033
- Table 2: Global PCI Express Revenue million Forecast, by Types 2020 & 2033
- Table 3: Global PCI Express Revenue million Forecast, by Region 2020 & 2033
- Table 4: Global PCI Express Revenue million Forecast, by Application 2020 & 2033
- Table 5: Global PCI Express Revenue million Forecast, by Types 2020 & 2033
- Table 6: Global PCI Express Revenue million Forecast, by Country 2020 & 2033
- Table 7: United States PCI Express Revenue (million) Forecast, by Application 2020 & 2033
- Table 8: Canada PCI Express Revenue (million) Forecast, by Application 2020 & 2033
- Table 9: Mexico PCI Express Revenue (million) Forecast, by Application 2020 & 2033
- Table 10: Global PCI Express Revenue million Forecast, by Application 2020 & 2033
- Table 11: Global PCI Express Revenue million Forecast, by Types 2020 & 2033
- Table 12: Global PCI Express Revenue million Forecast, by Country 2020 & 2033
- Table 13: Brazil PCI Express Revenue (million) Forecast, by Application 2020 & 2033
- Table 14: Argentina PCI Express Revenue (million) Forecast, by Application 2020 & 2033
- Table 15: Rest of South America PCI Express Revenue (million) Forecast, by Application 2020 & 2033
- Table 16: Global PCI Express Revenue million Forecast, by Application 2020 & 2033
- Table 17: Global PCI Express Revenue million Forecast, by Types 2020 & 2033
- Table 18: Global PCI Express Revenue million Forecast, by Country 2020 & 2033
- Table 19: United Kingdom PCI Express Revenue (million) Forecast, by Application 2020 & 2033
- Table 20: Germany PCI Express Revenue (million) Forecast, by Application 2020 & 2033
- Table 21: France PCI Express Revenue (million) Forecast, by Application 2020 & 2033
- Table 22: Italy PCI Express Revenue (million) Forecast, by Application 2020 & 2033
- Table 23: Spain PCI Express Revenue (million) Forecast, by Application 2020 & 2033
- Table 24: Russia PCI Express Revenue (million) Forecast, by Application 2020 & 2033
- Table 25: Benelux PCI Express Revenue (million) Forecast, by Application 2020 & 2033
- Table 26: Nordics PCI Express Revenue (million) Forecast, by Application 2020 & 2033
- Table 27: Rest of Europe PCI Express Revenue (million) Forecast, by Application 2020 & 2033
- Table 28: Global PCI Express Revenue million Forecast, by Application 2020 & 2033
- Table 29: Global PCI Express Revenue million Forecast, by Types 2020 & 2033
- Table 30: Global PCI Express Revenue million Forecast, by Country 2020 & 2033
- Table 31: Turkey PCI Express Revenue (million) Forecast, by Application 2020 & 2033
- Table 32: Israel PCI Express Revenue (million) Forecast, by Application 2020 & 2033
- Table 33: GCC PCI Express Revenue (million) Forecast, by Application 2020 & 2033
- Table 34: North Africa PCI Express Revenue (million) Forecast, by Application 2020 & 2033
- Table 35: South Africa PCI Express Revenue (million) Forecast, by Application 2020 & 2033
- Table 36: Rest of Middle East & Africa PCI Express Revenue (million) Forecast, by Application 2020 & 2033
- Table 37: Global PCI Express Revenue million Forecast, by Application 2020 & 2033
- Table 38: Global PCI Express Revenue million Forecast, by Types 2020 & 2033
- Table 39: Global PCI Express Revenue million Forecast, by Country 2020 & 2033
- Table 40: China PCI Express Revenue (million) Forecast, by Application 2020 & 2033
- Table 41: India PCI Express Revenue (million) Forecast, by Application 2020 & 2033
- Table 42: Japan PCI Express Revenue (million) Forecast, by Application 2020 & 2033
- Table 43: South Korea PCI Express Revenue (million) Forecast, by Application 2020 & 2033
- Table 44: ASEAN PCI Express Revenue (million) Forecast, by Application 2020 & 2033
- Table 45: Oceania PCI Express Revenue (million) Forecast, by Application 2020 & 2033
- Table 46: Rest of Asia Pacific PCI Express Revenue (million) Forecast, by Application 2020 & 2033
Frequently Asked Questions
1. What is the projected Compound Annual Growth Rate (CAGR) of the PCI Express?
The projected CAGR is approximately 12.2%.
2. Which companies are prominent players in the PCI Express?
Key companies in the market include Astera Labs Inc., Intel Corp., Kingston Technology Co. Inc., Microchip Technology Inc., NVIDIA Corp., Rambus Inc., Samsung Electronics Co. Ltd., Texas Instruments Inc., Toshiba Corp., Xilinx Inc..
3. What are the main segments of the PCI Express?
The market segments include Application, Types.
4. Can you provide details about the market size?
The market size is estimated to be USD 1962.5 million as of 2022.
5. What are some drivers contributing to market growth?
N/A
6. What are the notable trends driving market growth?
N/A
7. Are there any restraints impacting market growth?
N/A
8. Can you provide examples of recent developments in the market?
N/A
9. What pricing options are available for accessing the report?
Pricing options include single-user, multi-user, and enterprise licenses priced at USD 4900.00, USD 7350.00, and USD 9800.00 respectively.
10. Is the market size provided in terms of value or volume?
The market size is provided in terms of value, measured in million.
11. Are there any specific market keywords associated with the report?
Yes, the market keyword associated with the report is "PCI Express," which aids in identifying and referencing the specific market segment covered.
12. How do I determine which pricing option suits my needs best?
The pricing options vary based on user requirements and access needs. Individual users may opt for single-user licenses, while businesses requiring broader access may choose multi-user or enterprise licenses for cost-effective access to the report.
13. Are there any additional resources or data provided in the PCI Express report?
While the report offers comprehensive insights, it's advisable to review the specific contents or supplementary materials provided to ascertain if additional resources or data are available.
14. How can I stay updated on further developments or reports in the PCI Express?
To stay informed about further developments, trends, and reports in the PCI Express, consider subscribing to industry newsletters, following relevant companies and organizations, or regularly checking reputable industry news sources and publications.
Methodology
Step 1 - Identification of Relevant Samples Size from Population Database


Step 2 - Approaches for Defining Global Market Size (Value, Volume* & Price*)

Note*: In applicable scenarios
Step 3 - Data Sources
Primary Research
- Web Analytics
- Survey Reports
- Research Institute
- Latest Research Reports
- Opinion Leaders
Secondary Research
- Annual Reports
- White Paper
- Latest Press Release
- Industry Association
- Paid Database
- Investor Presentations

Step 4 - Data Triangulation
Involves using different sources of information in order to increase the validity of a study
These sources are likely to be stakeholders in a program - participants, other researchers, program staff, other community members, and so on.
Then we put all data in single framework & apply various statistical tools to find out the dynamic on the market.
During the analysis stage, feedback from the stakeholder groups would be compared to determine areas of agreement as well as areas of divergence