

Key Insights
The global Polycrystalline Diamond Compact (PDC) drill bit market is poised for significant expansion, propelled by escalating global oil and gas exploration and production initiatives. This market is projected to achieve a Compound Annual Growth Rate (CAGR) of 5.62%, with the market size valued at 972.74 million in the base year of 2025. Key growth drivers include the increasing demand for efficient drilling solutions in unconventional resource extraction, such as shale gas and tight oil, where PDC bits excel in challenging geological formations. Furthermore, continuous technological innovations in bit design, durability, and penetration rates are fueling market growth. The industry's shift towards automated and data-driven drilling operations further enhances the demand for advanced PDC drill bits.
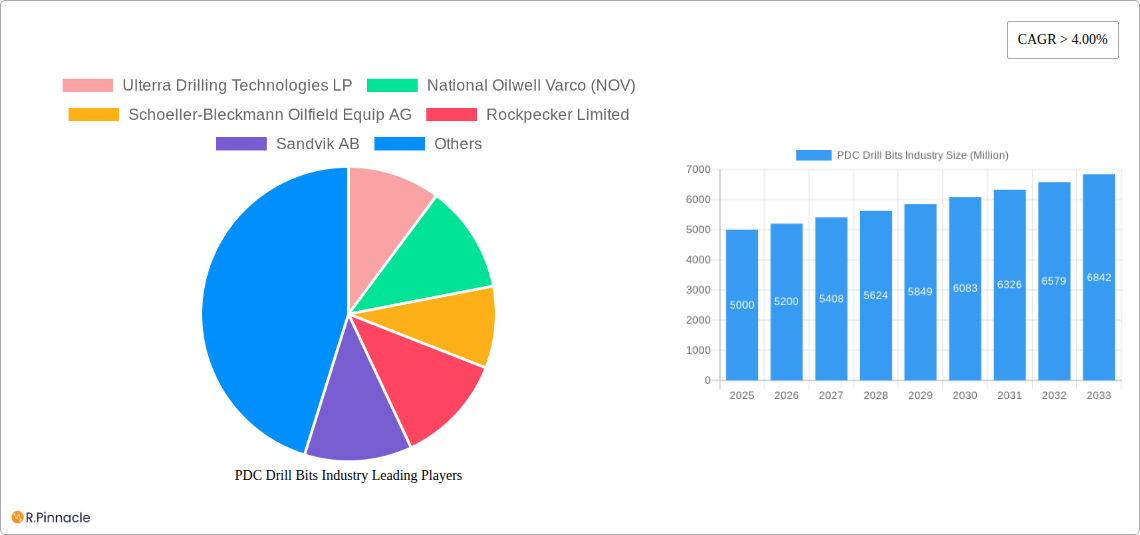
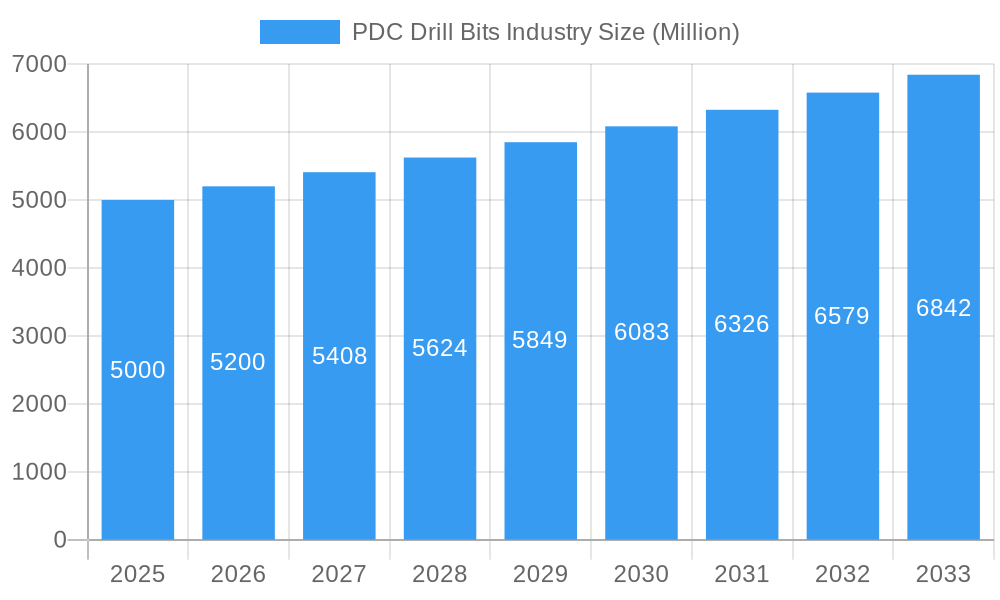
PDC Drill Bits Industry Market Size (In Million)
Within market segments, matrix body PDC drill bits are expected to command a substantial share due to their versatile performance across diverse formations. While onshore applications currently lead market dominance, offshore segments are anticipated to experience robust growth, driven by increasing investments in deepwater exploration. Leading industry players are actively engaged in research and development, product portfolio expansion, and strategic acquisitions to secure their market positions. Despite considerations regarding initial investment costs and potential susceptibility to damage in extremely hard rock, the PDC drill bit market exhibits a strong positive outlook for substantial growth over the forecast period.
PDC Drill Bits Industry Company Market Share
PDC Drill Bits Industry Market Report: 2019-2033
This comprehensive report provides an in-depth analysis of the global PDC Drill Bits industry, offering invaluable insights for industry professionals, investors, and strategic decision-makers. Covering the period from 2019 to 2033, with a base year of 2025 and a forecast period of 2025-2033, this report meticulously examines market dynamics, competitive landscapes, and future growth potential. The global market size is estimated to reach xx Million by 2025, showcasing significant growth opportunities.
PDC Drill Bits Industry Market Structure & Innovation Trends
This section analyzes the competitive landscape of the PDC drill bits market, focusing on market concentration, innovation drivers, regulatory frameworks, and M&A activities. The market is characterized by a moderately concentrated structure, with key players holding significant market share.
Market Concentration: The top five players, including Ulterra Drilling Technologies LP, National Oilwell Varco (NOV), Schoeller-Bleckmann Oilfield Equip AG, Sandvik AB, and Baker Hughes Company, collectively hold an estimated xx% market share in 2025.
Innovation Drivers: Continuous technological advancements in materials science, including the development of high-performance polycrystalline diamond compact (PDC) inserts, drive innovation. Increased demand for enhanced drilling efficiency and reduced operational costs further fuels innovation.
Regulatory Frameworks: Stringent environmental regulations concerning drilling waste and emissions impact industry operations and innovation towards eco-friendly solutions.
Product Substitutes: While PDC drill bits dominate the market, competing technologies like roller cone bits remain relevant in specific applications.
End-User Demographics: The primary end-users are oil and gas exploration and production companies, with activity levels significantly influencing market demand.
M&A Activities: The industry has witnessed significant M&A activity in recent years, with deal values totaling an estimated xx Million in the period 2019-2024. These activities aim to expand market share and enhance technological capabilities.
PDC Drill Bits Industry Market Dynamics & Trends
This section delves into the key drivers and trends shaping the PDC drill bits market. The market is experiencing robust growth, driven by increasing global energy demand and exploration activities, particularly in unconventional oil and gas resources.
The market is projected to exhibit a Compound Annual Growth Rate (CAGR) of xx% during the forecast period (2025-2033). This growth is fueled by factors such as increasing investments in offshore drilling, advancements in PDC bit technology leading to improved drilling efficiency and reduced operational costs, and growing exploration and production activities in unconventional resources like shale gas and tight oil. Market penetration of PDC bits in specific regions is also expected to increase significantly during the forecast period. Technological disruptions, such as the adoption of automation and data analytics in drilling operations, are further enhancing market dynamics. Consumer preference is shifting towards high-performance, cost-effective, and environmentally conscious drilling solutions. Competitive dynamics are intense, with major players focusing on product differentiation, technological innovation, and strategic partnerships.
Dominant Regions & Segments in PDC Drill Bits Industry
The North American region currently dominates the PDC drill bits market, driven by extensive oil and gas exploration and production activities in the United States and Canada. However, the Asia-Pacific region is expected to witness significant growth in the coming years due to increasing energy demand and infrastructure development.
Leading Region: North America.
Key Drivers (North America):
- Robust oil and gas exploration and production activities.
- Advanced infrastructure and technological capabilities.
- Supportive government policies.
Leading Segment (Type): Matrix Body PDC drill bits currently hold a larger market share due to their superior performance in various geological formations.
Leading Segment (Location of Deployment): Onshore deployments account for a larger market share due to the higher concentration of onshore drilling activities globally. However, the offshore segment is projected to experience faster growth driven by increasing exploration in deepwater fields.
Dominance Analysis: The dominance of North America and the Matrix Body segment stems from the high concentration of oil and gas activities in the region and the superior performance characteristics of matrix body PDC bits. The offshore segment's growth potential is substantial, indicating future market shifts.
PDC Drill Bits Industry Product Innovations
Recent product innovations focus on enhancing durability, efficiency, and application versatility of PDC drill bits. Advanced materials and designs are enabling improved performance in challenging formations, resulting in reduced drilling time and operational costs. Integration of advanced technologies such as real-time data analytics and automation further enhances drilling efficiency. This focus on technological improvements aligns perfectly with the industry's pursuit of optimized drilling performance and cost reduction.
Report Scope & Segmentation Analysis
This report segments the PDC drill bits market by type (Matrix Body, Steel Body) and location of deployment (Onshore, Offshore). Each segment showcases distinct growth projections and competitive dynamics. The Matrix Body segment is expected to experience higher growth compared to the Steel Body segment due to its enhanced performance characteristics. Similarly, the onshore segment currently holds a larger market share but the offshore segment exhibits significant growth potential, fueled by deepwater exploration activities. Market sizes for each segment are detailed within the full report, along with a comprehensive competitive landscape analysis.
Key Drivers of PDC Drill Bits Industry Growth
Several factors drive growth in the PDC drill bits industry: Firstly, the ever-increasing global energy demand fuels exploration and production activities, creating a substantial demand for efficient drilling tools like PDC bits. Secondly, technological advancements constantly improve the performance and longevity of PDC bits, making them increasingly cost-effective. Finally, supportive government policies and investments in oil and gas infrastructure further stimulate market growth.
Challenges in the PDC Drill Bits Industry Sector
The PDC drill bits industry faces several challenges, including intense competition among established players leading to price pressures. Supply chain disruptions can impact the availability of raw materials crucial for PDC bit manufacturing. Moreover, fluctuating oil and gas prices directly influence market demand, creating uncertainty. These challenges require strategic planning and adaptive measures by industry players.
Emerging Opportunities in PDC Drill Bits Industry
Emerging opportunities include the expanding market for unconventional resources, creating demand for specialized PDC bits. Furthermore, advancements in automation and data analytics present opportunities to enhance drilling efficiency and reduce operational costs. Finally, the growing focus on sustainability presents opportunities for developing eco-friendly PDC bits and drilling practices.
Leading Players in the PDC Drill Bits Industry Market
- Ulterra Drilling Technologies LP
- National Oilwell Varco (NOV)
- Schoeller-Bleckmann Oilfield Equip AG
- Rockpecker Limited
- Sandvik AB
- Landrill Oil Tools Co Ltd
- Baker Hughes Company
- Halliburton Company
- Weatherford International PLC
- Schlumberger Limited
Key Developments in PDC Drill Bits Industry Industry
- 2022 Q3: NOV launched a new generation of PDC drill bits featuring enhanced durability and cutting efficiency.
- 2021 Q4: Baker Hughes acquired a smaller PDC bit manufacturer, expanding its market share.
- 2020 Q1: Schlumberger invested heavily in R&D to improve the performance of PDC bits in shale formations. (Further developments to be added in final report)
Future Outlook for PDC Drill Bits Industry Market
The future outlook for the PDC drill bits industry remains positive, driven by continuous technological advancements, increasing energy demand, and exploration activities in unconventional resources. Strategic partnerships and investments in R&D will be crucial for maintaining a competitive edge in this dynamic market. The industry's focus on sustainability and efficiency will further shape its future growth trajectory.
PDC Drill Bits Industry Segmentation
-
1. Type
- 1.1. Matrix Body
- 1.2. Steel Body
-
2. Location of Deployment
- 2.1. Onshore
- 2.2. Offshore
PDC Drill Bits Industry Segmentation By Geography
- 1. North America
- 2. Europe
- 3. Asia Pacific
- 4. South America
- 5. Middle East
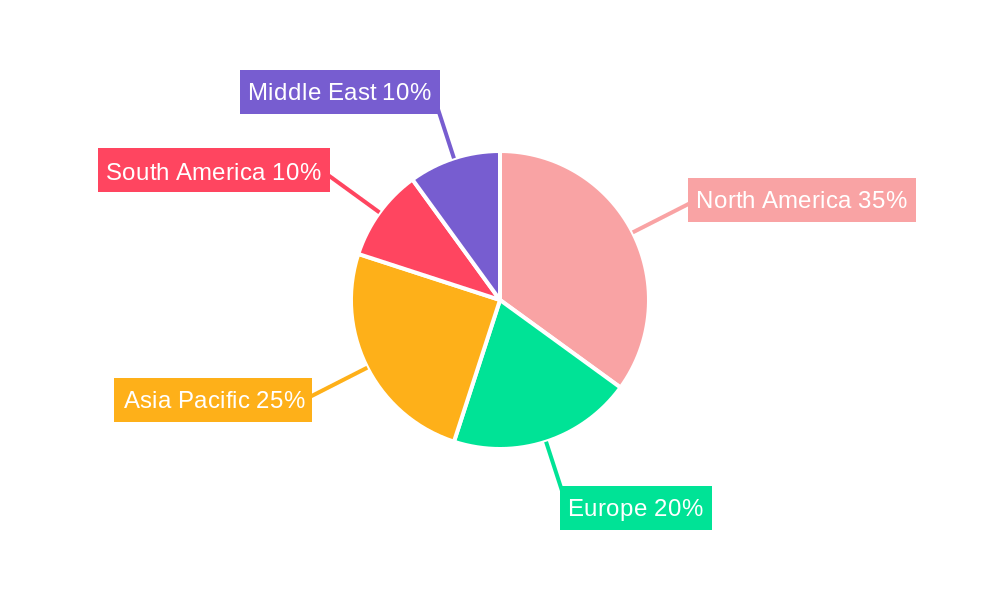
PDC Drill Bits Industry Regional Market Share
Geographic Coverage of PDC Drill Bits Industry
PDC Drill Bits Industry REPORT HIGHLIGHTS
| Aspects | Details |
|---|---|
| Study Period | 2020-2034 |
| Base Year | 2025 |
| Estimated Year | 2026 |
| Forecast Period | 2026-2034 |
| Historical Period | 2020-2025 |
| Growth Rate | CAGR of 5.62% from 2020-2034 |
| Segmentation |
|
Table of Contents
- 1. Introduction
- 1.1. Research Scope
- 1.2. Market Segmentation
- 1.3. Research Objective
- 1.4. Definitions and Assumptions
- 2. Executive Summary
- 2.1. Market Snapshot
- 3. Market Dynamics
- 3.1. Market Drivers
- 3.2. Market Restrains
- 3.3. Market Trends
- 3.4. Market Opportunities
- 4. Market Factor Analysis
- 4.1. Porters Five Forces
- 4.1.1. Bargaining Power of Suppliers
- 4.1.2. Bargaining Power of Buyers
- 4.1.3. Threat of New Entrants
- 4.1.4. Threat of Substitutes
- 4.1.5. Competitive Rivalry
- 4.2. PESTEL analysis
- 4.3. BCG Analysis
- 4.3.1. Stars (High Growth, High Market Share)
- 4.3.2. Cash Cows (Low Growth, High Market Share)
- 4.3.3. Question Mark (High Growth, Low Market Share)
- 4.3.4. Dogs (Low Growth, Low Market Share)
- 4.4. Ansoff Matrix Analysis
- 4.5. Supply Chain Analysis
- 4.6. Regulatory Landscape
- 4.7. Current Market Potential and Opportunity Assessment (TAM–SAM–SOM Framework)
- 4.8. PRI Analyst Note
- 4.1. Porters Five Forces
- 5. Market Analysis, Insights and Forecast 2021-2033
- 5.1. Market Analysis, Insights and Forecast - by Type
- 5.1.1. Matrix Body
- 5.1.2. Steel Body
- 5.2. Market Analysis, Insights and Forecast - by Location of Deployment
- 5.2.1. Onshore
- 5.2.2. Offshore
- 5.3. Market Analysis, Insights and Forecast - by Region
- 5.3.1. North America
- 5.3.2. Europe
- 5.3.3. Asia Pacific
- 5.3.4. South America
- 5.3.5. Middle East
- 5.1. Market Analysis, Insights and Forecast - by Type
- 6. Global PDC Drill Bits Industry Analysis, Insights and Forecast, 2021-2033
- 6.1. Market Analysis, Insights and Forecast - by Type
- 6.1.1. Matrix Body
- 6.1.2. Steel Body
- 6.2. Market Analysis, Insights and Forecast - by Location of Deployment
- 6.2.1. Onshore
- 6.2.2. Offshore
- 6.1. Market Analysis, Insights and Forecast - by Type
- 7. North America PDC Drill Bits Industry Analysis, Insights and Forecast, 2020-2032
- 7.1. Market Analysis, Insights and Forecast - by Type
- 7.1.1. Matrix Body
- 7.1.2. Steel Body
- 7.2. Market Analysis, Insights and Forecast - by Location of Deployment
- 7.2.1. Onshore
- 7.2.2. Offshore
- 7.1. Market Analysis, Insights and Forecast - by Type
- 8. Europe PDC Drill Bits Industry Analysis, Insights and Forecast, 2020-2032
- 8.1. Market Analysis, Insights and Forecast - by Type
- 8.1.1. Matrix Body
- 8.1.2. Steel Body
- 8.2. Market Analysis, Insights and Forecast - by Location of Deployment
- 8.2.1. Onshore
- 8.2.2. Offshore
- 8.1. Market Analysis, Insights and Forecast - by Type
- 9. Asia Pacific PDC Drill Bits Industry Analysis, Insights and Forecast, 2020-2032
- 9.1. Market Analysis, Insights and Forecast - by Type
- 9.1.1. Matrix Body
- 9.1.2. Steel Body
- 9.2. Market Analysis, Insights and Forecast - by Location of Deployment
- 9.2.1. Onshore
- 9.2.2. Offshore
- 9.1. Market Analysis, Insights and Forecast - by Type
- 10. South America PDC Drill Bits Industry Analysis, Insights and Forecast, 2020-2032
- 10.1. Market Analysis, Insights and Forecast - by Type
- 10.1.1. Matrix Body
- 10.1.2. Steel Body
- 10.2. Market Analysis, Insights and Forecast - by Location of Deployment
- 10.2.1. Onshore
- 10.2.2. Offshore
- 10.1. Market Analysis, Insights and Forecast - by Type
- 11. Middle East PDC Drill Bits Industry Analysis, Insights and Forecast, 2020-2032
- 11.1. Market Analysis, Insights and Forecast - by Type
- 11.1.1. Matrix Body
- 11.1.2. Steel Body
- 11.2. Market Analysis, Insights and Forecast - by Location of Deployment
- 11.2.1. Onshore
- 11.2.2. Offshore
- 11.1. Market Analysis, Insights and Forecast - by Type
- 12. Competitive Analysis
- 12.1. Company Profiles
- 12.1.1 Ulterra Drilling Technologies LP
- 12.1.1.1. Company Overview
- 12.1.1.2. Products
- 12.1.1.3. Company Financials
- 12.1.1.4. SWOT Analysis
- 12.1.2 National Oilwell Varco (NOV)
- 12.1.2.1. Company Overview
- 12.1.2.2. Products
- 12.1.2.3. Company Financials
- 12.1.2.4. SWOT Analysis
- 12.1.3 Schoeller-Bleckmann Oilfield Equip AG
- 12.1.3.1. Company Overview
- 12.1.3.2. Products
- 12.1.3.3. Company Financials
- 12.1.3.4. SWOT Analysis
- 12.1.4 Rockpecker Limited
- 12.1.4.1. Company Overview
- 12.1.4.2. Products
- 12.1.4.3. Company Financials
- 12.1.4.4. SWOT Analysis
- 12.1.5 Sandvik AB
- 12.1.5.1. Company Overview
- 12.1.5.2. Products
- 12.1.5.3. Company Financials
- 12.1.5.4. SWOT Analysis
- 12.1.6 Landrill Oil Tools Co Ltd
- 12.1.6.1. Company Overview
- 12.1.6.2. Products
- 12.1.6.3. Company Financials
- 12.1.6.4. SWOT Analysis
- 12.1.7 Baker Hughes Company
- 12.1.7.1. Company Overview
- 12.1.7.2. Products
- 12.1.7.3. Company Financials
- 12.1.7.4. SWOT Analysis
- 12.1.8 Halliburton Company
- 12.1.8.1. Company Overview
- 12.1.8.2. Products
- 12.1.8.3. Company Financials
- 12.1.8.4. SWOT Analysis
- 12.1.9 Weatherford International PLC*List Not Exhaustive
- 12.1.9.1. Company Overview
- 12.1.9.2. Products
- 12.1.9.3. Company Financials
- 12.1.9.4. SWOT Analysis
- 12.1.10 Schlumberger Limited
- 12.1.10.1. Company Overview
- 12.1.10.2. Products
- 12.1.10.3. Company Financials
- 12.1.10.4. SWOT Analysis
- 12.1.1 Ulterra Drilling Technologies LP
- 12.2. Market Entropy
- 12.2.1 Company's Key Areas Served
- 12.2.2 Recent Developments
- 12.3. Company Market Share Analysis 2025
- 12.3.1 Top 5 Companies Market Share Analysis
- 12.3.2 Top 3 Companies Market Share Analysis
- 12.4. List of Potential Customers
- 13. Research Methodology
List of Figures
- Figure 1: Global PDC Drill Bits Industry Revenue Breakdown (million, %) by Region 2025 & 2033
- Figure 2: Global PDC Drill Bits Industry Volume Breakdown (K Units, %) by Region 2025 & 2033
- Figure 3: North America PDC Drill Bits Industry Revenue (million), by Type 2025 & 2033
- Figure 4: North America PDC Drill Bits Industry Volume (K Units), by Type 2025 & 2033
- Figure 5: North America PDC Drill Bits Industry Revenue Share (%), by Type 2025 & 2033
- Figure 6: North America PDC Drill Bits Industry Volume Share (%), by Type 2025 & 2033
- Figure 7: North America PDC Drill Bits Industry Revenue (million), by Location of Deployment 2025 & 2033
- Figure 8: North America PDC Drill Bits Industry Volume (K Units), by Location of Deployment 2025 & 2033
- Figure 9: North America PDC Drill Bits Industry Revenue Share (%), by Location of Deployment 2025 & 2033
- Figure 10: North America PDC Drill Bits Industry Volume Share (%), by Location of Deployment 2025 & 2033
- Figure 11: North America PDC Drill Bits Industry Revenue (million), by Country 2025 & 2033
- Figure 12: North America PDC Drill Bits Industry Volume (K Units), by Country 2025 & 2033
- Figure 13: North America PDC Drill Bits Industry Revenue Share (%), by Country 2025 & 2033
- Figure 14: North America PDC Drill Bits Industry Volume Share (%), by Country 2025 & 2033
- Figure 15: Europe PDC Drill Bits Industry Revenue (million), by Type 2025 & 2033
- Figure 16: Europe PDC Drill Bits Industry Volume (K Units), by Type 2025 & 2033
- Figure 17: Europe PDC Drill Bits Industry Revenue Share (%), by Type 2025 & 2033
- Figure 18: Europe PDC Drill Bits Industry Volume Share (%), by Type 2025 & 2033
- Figure 19: Europe PDC Drill Bits Industry Revenue (million), by Location of Deployment 2025 & 2033
- Figure 20: Europe PDC Drill Bits Industry Volume (K Units), by Location of Deployment 2025 & 2033
- Figure 21: Europe PDC Drill Bits Industry Revenue Share (%), by Location of Deployment 2025 & 2033
- Figure 22: Europe PDC Drill Bits Industry Volume Share (%), by Location of Deployment 2025 & 2033
- Figure 23: Europe PDC Drill Bits Industry Revenue (million), by Country 2025 & 2033
- Figure 24: Europe PDC Drill Bits Industry Volume (K Units), by Country 2025 & 2033
- Figure 25: Europe PDC Drill Bits Industry Revenue Share (%), by Country 2025 & 2033
- Figure 26: Europe PDC Drill Bits Industry Volume Share (%), by Country 2025 & 2033
- Figure 27: Asia Pacific PDC Drill Bits Industry Revenue (million), by Type 2025 & 2033
- Figure 28: Asia Pacific PDC Drill Bits Industry Volume (K Units), by Type 2025 & 2033
- Figure 29: Asia Pacific PDC Drill Bits Industry Revenue Share (%), by Type 2025 & 2033
- Figure 30: Asia Pacific PDC Drill Bits Industry Volume Share (%), by Type 2025 & 2033
- Figure 31: Asia Pacific PDC Drill Bits Industry Revenue (million), by Location of Deployment 2025 & 2033
- Figure 32: Asia Pacific PDC Drill Bits Industry Volume (K Units), by Location of Deployment 2025 & 2033
- Figure 33: Asia Pacific PDC Drill Bits Industry Revenue Share (%), by Location of Deployment 2025 & 2033
- Figure 34: Asia Pacific PDC Drill Bits Industry Volume Share (%), by Location of Deployment 2025 & 2033
- Figure 35: Asia Pacific PDC Drill Bits Industry Revenue (million), by Country 2025 & 2033
- Figure 36: Asia Pacific PDC Drill Bits Industry Volume (K Units), by Country 2025 & 2033
- Figure 37: Asia Pacific PDC Drill Bits Industry Revenue Share (%), by Country 2025 & 2033
- Figure 38: Asia Pacific PDC Drill Bits Industry Volume Share (%), by Country 2025 & 2033
- Figure 39: South America PDC Drill Bits Industry Revenue (million), by Type 2025 & 2033
- Figure 40: South America PDC Drill Bits Industry Volume (K Units), by Type 2025 & 2033
- Figure 41: South America PDC Drill Bits Industry Revenue Share (%), by Type 2025 & 2033
- Figure 42: South America PDC Drill Bits Industry Volume Share (%), by Type 2025 & 2033
- Figure 43: South America PDC Drill Bits Industry Revenue (million), by Location of Deployment 2025 & 2033
- Figure 44: South America PDC Drill Bits Industry Volume (K Units), by Location of Deployment 2025 & 2033
- Figure 45: South America PDC Drill Bits Industry Revenue Share (%), by Location of Deployment 2025 & 2033
- Figure 46: South America PDC Drill Bits Industry Volume Share (%), by Location of Deployment 2025 & 2033
- Figure 47: South America PDC Drill Bits Industry Revenue (million), by Country 2025 & 2033
- Figure 48: South America PDC Drill Bits Industry Volume (K Units), by Country 2025 & 2033
- Figure 49: South America PDC Drill Bits Industry Revenue Share (%), by Country 2025 & 2033
- Figure 50: South America PDC Drill Bits Industry Volume Share (%), by Country 2025 & 2033
- Figure 51: Middle East PDC Drill Bits Industry Revenue (million), by Type 2025 & 2033
- Figure 52: Middle East PDC Drill Bits Industry Volume (K Units), by Type 2025 & 2033
- Figure 53: Middle East PDC Drill Bits Industry Revenue Share (%), by Type 2025 & 2033
- Figure 54: Middle East PDC Drill Bits Industry Volume Share (%), by Type 2025 & 2033
- Figure 55: Middle East PDC Drill Bits Industry Revenue (million), by Location of Deployment 2025 & 2033
- Figure 56: Middle East PDC Drill Bits Industry Volume (K Units), by Location of Deployment 2025 & 2033
- Figure 57: Middle East PDC Drill Bits Industry Revenue Share (%), by Location of Deployment 2025 & 2033
- Figure 58: Middle East PDC Drill Bits Industry Volume Share (%), by Location of Deployment 2025 & 2033
- Figure 59: Middle East PDC Drill Bits Industry Revenue (million), by Country 2025 & 2033
- Figure 60: Middle East PDC Drill Bits Industry Volume (K Units), by Country 2025 & 2033
- Figure 61: Middle East PDC Drill Bits Industry Revenue Share (%), by Country 2025 & 2033
- Figure 62: Middle East PDC Drill Bits Industry Volume Share (%), by Country 2025 & 2033
List of Tables
- Table 1: Global PDC Drill Bits Industry Revenue million Forecast, by Type 2020 & 2033
- Table 2: Global PDC Drill Bits Industry Volume K Units Forecast, by Type 2020 & 2033
- Table 3: Global PDC Drill Bits Industry Revenue million Forecast, by Location of Deployment 2020 & 2033
- Table 4: Global PDC Drill Bits Industry Volume K Units Forecast, by Location of Deployment 2020 & 2033
- Table 5: Global PDC Drill Bits Industry Revenue million Forecast, by Region 2020 & 2033
- Table 6: Global PDC Drill Bits Industry Volume K Units Forecast, by Region 2020 & 2033
- Table 7: Global PDC Drill Bits Industry Revenue million Forecast, by Type 2020 & 2033
- Table 8: Global PDC Drill Bits Industry Volume K Units Forecast, by Type 2020 & 2033
- Table 9: Global PDC Drill Bits Industry Revenue million Forecast, by Location of Deployment 2020 & 2033
- Table 10: Global PDC Drill Bits Industry Volume K Units Forecast, by Location of Deployment 2020 & 2033
- Table 11: Global PDC Drill Bits Industry Revenue million Forecast, by Country 2020 & 2033
- Table 12: Global PDC Drill Bits Industry Volume K Units Forecast, by Country 2020 & 2033
- Table 13: Global PDC Drill Bits Industry Revenue million Forecast, by Type 2020 & 2033
- Table 14: Global PDC Drill Bits Industry Volume K Units Forecast, by Type 2020 & 2033
- Table 15: Global PDC Drill Bits Industry Revenue million Forecast, by Location of Deployment 2020 & 2033
- Table 16: Global PDC Drill Bits Industry Volume K Units Forecast, by Location of Deployment 2020 & 2033
- Table 17: Global PDC Drill Bits Industry Revenue million Forecast, by Country 2020 & 2033
- Table 18: Global PDC Drill Bits Industry Volume K Units Forecast, by Country 2020 & 2033
- Table 19: Global PDC Drill Bits Industry Revenue million Forecast, by Type 2020 & 2033
- Table 20: Global PDC Drill Bits Industry Volume K Units Forecast, by Type 2020 & 2033
- Table 21: Global PDC Drill Bits Industry Revenue million Forecast, by Location of Deployment 2020 & 2033
- Table 22: Global PDC Drill Bits Industry Volume K Units Forecast, by Location of Deployment 2020 & 2033
- Table 23: Global PDC Drill Bits Industry Revenue million Forecast, by Country 2020 & 2033
- Table 24: Global PDC Drill Bits Industry Volume K Units Forecast, by Country 2020 & 2033
- Table 25: Global PDC Drill Bits Industry Revenue million Forecast, by Type 2020 & 2033
- Table 26: Global PDC Drill Bits Industry Volume K Units Forecast, by Type 2020 & 2033
- Table 27: Global PDC Drill Bits Industry Revenue million Forecast, by Location of Deployment 2020 & 2033
- Table 28: Global PDC Drill Bits Industry Volume K Units Forecast, by Location of Deployment 2020 & 2033
- Table 29: Global PDC Drill Bits Industry Revenue million Forecast, by Country 2020 & 2033
- Table 30: Global PDC Drill Bits Industry Volume K Units Forecast, by Country 2020 & 2033
- Table 31: Global PDC Drill Bits Industry Revenue million Forecast, by Type 2020 & 2033
- Table 32: Global PDC Drill Bits Industry Volume K Units Forecast, by Type 2020 & 2033
- Table 33: Global PDC Drill Bits Industry Revenue million Forecast, by Location of Deployment 2020 & 2033
- Table 34: Global PDC Drill Bits Industry Volume K Units Forecast, by Location of Deployment 2020 & 2033
- Table 35: Global PDC Drill Bits Industry Revenue million Forecast, by Country 2020 & 2033
- Table 36: Global PDC Drill Bits Industry Volume K Units Forecast, by Country 2020 & 2033
Frequently Asked Questions
1. What is the projected Compound Annual Growth Rate (CAGR) of the PDC Drill Bits Industry?
The projected CAGR is approximately 5.62%.
2. Which companies are prominent players in the PDC Drill Bits Industry?
Key companies in the market include Ulterra Drilling Technologies LP, National Oilwell Varco (NOV), Schoeller-Bleckmann Oilfield Equip AG, Rockpecker Limited, Sandvik AB, Landrill Oil Tools Co Ltd, Baker Hughes Company, Halliburton Company, Weatherford International PLC*List Not Exhaustive, Schlumberger Limited.
3. What are the main segments of the PDC Drill Bits Industry?
The market segments include Type, Location of Deployment.
4. Can you provide details about the market size?
The market size is estimated to be USD 972.74 million as of 2022.
5. What are some drivers contributing to market growth?
Growing demand for natural gas and developing gas infrastructure.; Increasing offshore oil and Gas Exploration Activities.
6. What are the notable trends driving market growth?
The Onshore Segment to Dominate the Market.
7. Are there any restraints impacting market growth?
Adoption of Cleaner Alternatives.
8. Can you provide examples of recent developments in the market?
N/A
9. What pricing options are available for accessing the report?
Pricing options include single-user, multi-user, and enterprise licenses priced at USD 4750, USD 5250, and USD 8750 respectively.
10. Is the market size provided in terms of value or volume?
The market size is provided in terms of value, measured in million and volume, measured in K Units.
11. Are there any specific market keywords associated with the report?
Yes, the market keyword associated with the report is "PDC Drill Bits Industry," which aids in identifying and referencing the specific market segment covered.
12. How do I determine which pricing option suits my needs best?
The pricing options vary based on user requirements and access needs. Individual users may opt for single-user licenses, while businesses requiring broader access may choose multi-user or enterprise licenses for cost-effective access to the report.
13. Are there any additional resources or data provided in the PDC Drill Bits Industry report?
While the report offers comprehensive insights, it's advisable to review the specific contents or supplementary materials provided to ascertain if additional resources or data are available.
14. How can I stay updated on further developments or reports in the PDC Drill Bits Industry?
To stay informed about further developments, trends, and reports in the PDC Drill Bits Industry, consider subscribing to industry newsletters, following relevant companies and organizations, or regularly checking reputable industry news sources and publications.
Methodology
Step 1 - Identification of Relevant Samples Size from Population Database


Step 2 - Approaches for Defining Global Market Size (Value, Volume* & Price*)

Note*: In applicable scenarios
Step 3 - Data Sources
Primary Research
- Web Analytics
- Survey Reports
- Research Institute
- Latest Research Reports
- Opinion Leaders
Secondary Research
- Annual Reports
- White Paper
- Latest Press Release
- Industry Association
- Paid Database
- Investor Presentations

Step 4 - Data Triangulation
Involves using different sources of information in order to increase the validity of a study
These sources are likely to be stakeholders in a program - participants, other researchers, program staff, other community members, and so on.
Then we put all data in single framework & apply various statistical tools to find out the dynamic on the market.
During the analysis stage, feedback from the stakeholder groups would be compared to determine areas of agreement as well as areas of divergence