

Key Insights
The global market for Personalized 3D Printed Implants is poised for remarkable expansion, projected to reach a substantial 2617.8 million by 2025, driven by an impressive Compound Annual Growth Rate (CAGR) of 19.4% throughout the forecast period of 2025-2033. This robust growth is fueled by the increasing demand for patient-specific medical devices, particularly in orthopedic and reconstructive surgeries. The advent of advanced 3D printing technologies, such as selective laser melting (SLM) and fused deposition modeling (FDM), has enabled the creation of intricate implant designs tailored to individual patient anatomy, leading to improved surgical outcomes, faster recovery times, and reduced risk of complications. Key applications within this dynamic market include cranial plates, hip joints, and shoulder implants, catering to a growing patient population experiencing musculoskeletal disorders and trauma. The integration of biocompatible materials, including advanced polymers and titanium alloys, further enhances the efficacy and safety of these personalized implants.
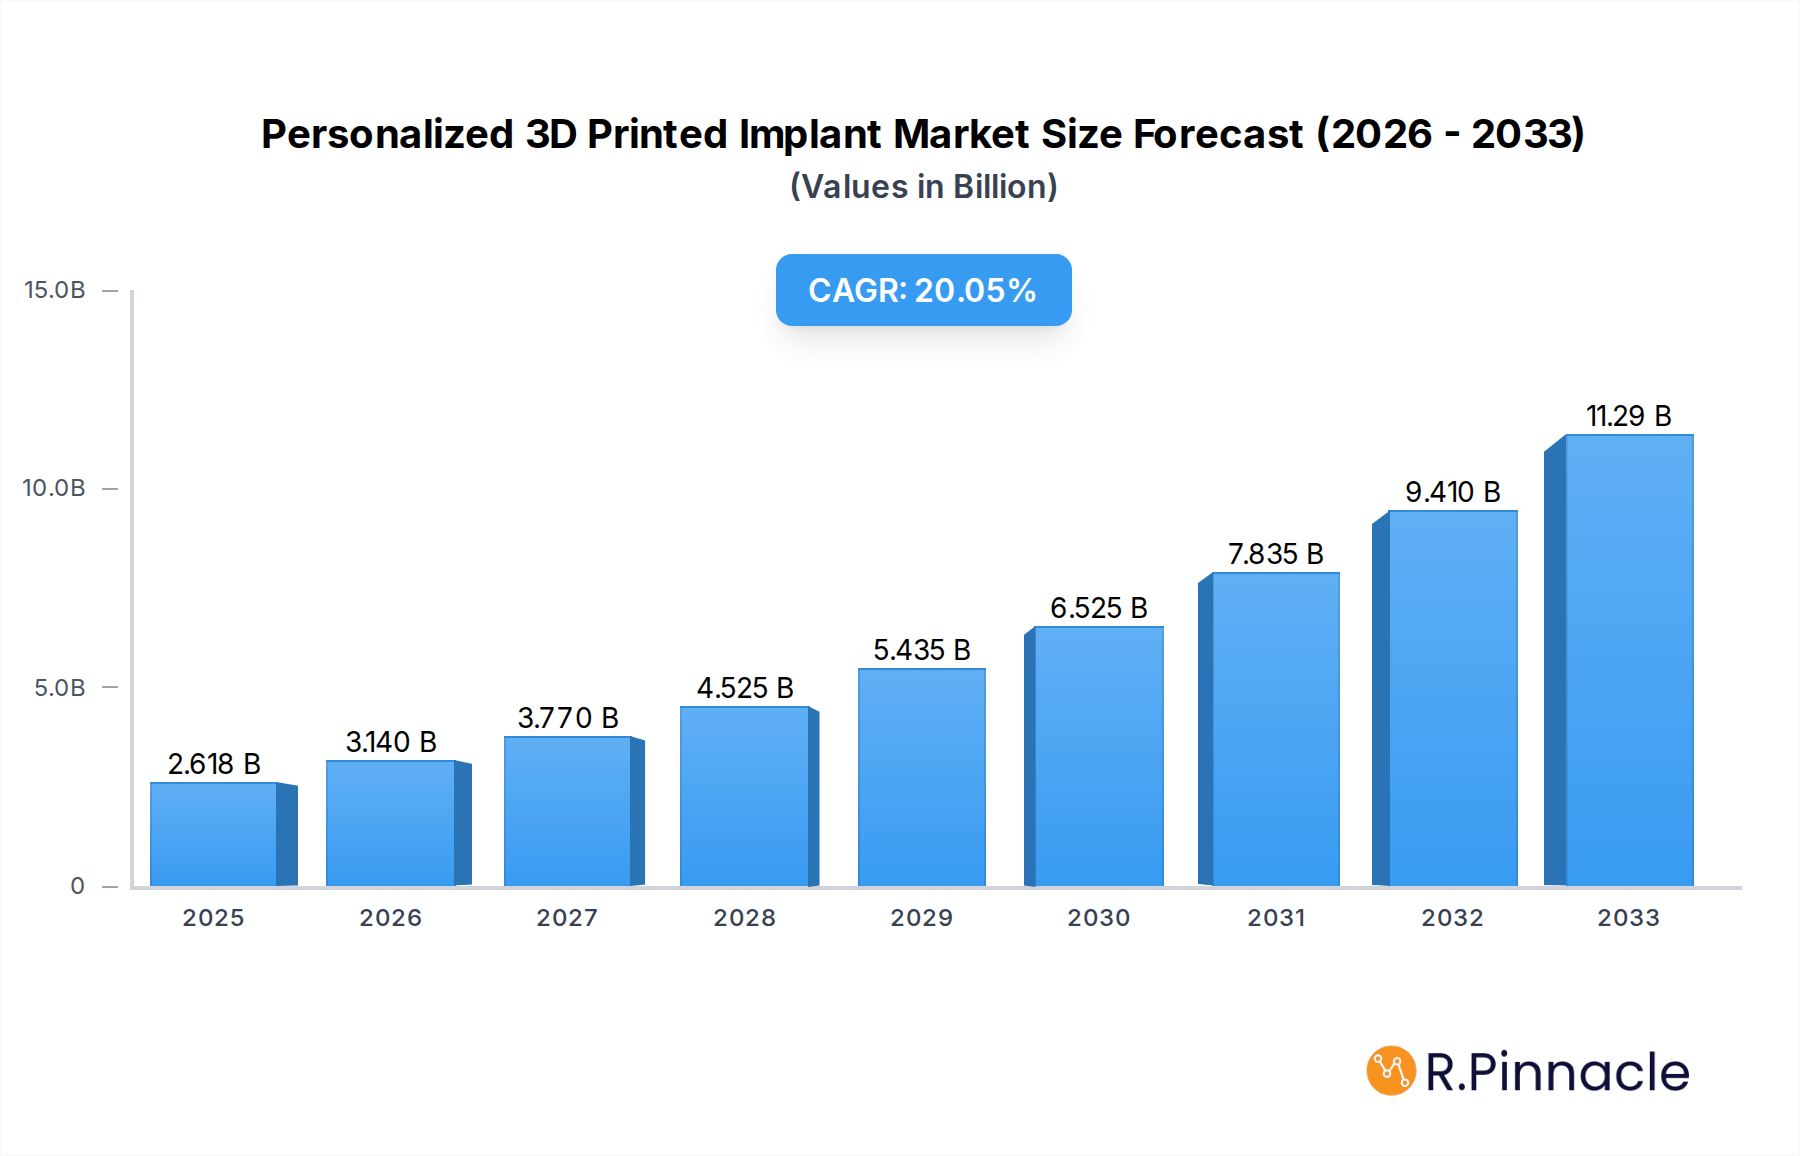
Personalized 3D Printed Implant Market Size (In Billion)
The market's upward trajectory is further bolstered by significant investments in research and development by leading companies like 3D Systems Corporation, Stratasys, and Stryker, who are continuously innovating to enhance material properties and printing precision. The widespread adoption of 3D printed implants in hospitals and specialized clinics underscores their growing acceptance as a superior alternative to traditional, off-the-shelf devices. While the market enjoys strong tailwinds from technological advancements and increasing patient demand, potential restraints could include the high initial cost of advanced 3D printing equipment and the need for stringent regulatory approvals for novel implant designs. Nonetheless, the overarching trend towards personalized medicine and the inherent advantages of 3D printed implants in improving patient care are expected to outweigh these challenges, propelling the market to new heights of innovation and accessibility.

Personalized 3D Printed Implant Company Market Share
This comprehensive report provides an exhaustive analysis of the global personalized 3D printed implant market, offering critical insights and actionable intelligence for industry stakeholders. Leveraging a detailed study period from 2019 to 2033, with a base year of 2025 and a forecast period extending to 2033, this report is meticulously crafted to empower strategic decision-making in the rapidly evolving field of additive manufacturing for medical devices.
Personalized 3D Printed Implant Market Structure & Innovation Trends
The personalized 3D printed implant market exhibits a moderate concentration, with key players like 3D Systems Corporations, Stratasys, and SLM Solutions Group holding significant market share, estimated at over 40% collectively. Innovation is primarily driven by advancements in biomaterials (e.g., biocompatible polymers, titanium alloys), sophisticated 3D printing technologies (e.g., selective laser melting, fused deposition modeling), and sophisticated design software enabling patient-specific anatomical replication. Regulatory frameworks, while becoming more streamlined for personalized devices, continue to be a crucial factor, with stringent approval processes for novel materials and complex implant designs. Product substitutes, such as traditional off-the-shelf implants and other regenerative medicine approaches, pose a competitive challenge, though the customization and improved patient outcomes offered by 3D printing are increasingly differentiating the market. End-user demographics are broad, encompassing individuals requiring orthopedic, craniomaxillofacial, and other reconstructive surgeries. Mergers and acquisitions (M&A) activity is moderate, with strategic acquisitions of smaller additive manufacturing solution providers by larger medical device companies, aiming to integrate advanced manufacturing capabilities. The estimated value of M&A deals in the historical period reached approximately $500 million.
Personalized 3D Printed Implant Market Dynamics & Trends
The personalized 3D printed implant market is poised for substantial growth, driven by a confluence of technological advancements, increasing demand for patient-specific treatments, and a growing awareness of the benefits of additive manufacturing in healthcare. The estimated Compound Annual Growth Rate (CAGR) for the forecast period is projected to be around 20%, indicating robust expansion. Technological disruptions, including the development of high-resolution printers capable of intricate designs and the exploration of novel biocompatible and resorbable materials, are at the forefront of this growth. The integration of artificial intelligence (AI) and machine learning (ML) in implant design and simulation further enhances precision and reduces lead times, making personalized implants more accessible and cost-effective.
Consumer preferences are increasingly leaning towards personalized medical solutions that offer improved comfort, functionality, and faster recovery times. Patients are actively seeking treatments tailored to their unique anatomical structures, a demand that 3D printed implants are ideally positioned to meet. This shift in patient expectations is compelling healthcare providers and manufacturers to invest heavily in personalized implant technologies.
The competitive landscape is dynamic, characterized by collaborations between medical device manufacturers, 3D printing companies, and research institutions. Key players are investing in research and development to enhance material properties, expand the range of implantable devices, and optimize the entire workflow from patient scanning to final implantation. Market penetration is steadily increasing, particularly in orthopedic and craniomaxillofacial applications, as the clinical benefits of customized implants become more evident. The estimated market penetration for cranial plates reached over 15% in developed economies by 2024, with significant growth expected in other segments.
Dominant Regions & Segments in Personalized 3D Printed Implant
North America currently dominates the personalized 3D printed implant market, driven by its advanced healthcare infrastructure, significant R&D investments, and high adoption rates of innovative medical technologies. The United States, in particular, stands out due to its robust regulatory pathways for medical devices and the presence of leading implant manufacturers and 3D printing companies.
Application Dominance:
- Hospital: Hospitals are the primary application segment due to their established surgical infrastructure, access to patient data for customization, and comprehensive post-operative care facilities. The estimated market share for hospital applications is over 60%.
- Clinic: Specialized clinics focusing on reconstructive surgery and orthopedics are also significant adopters, particularly for niche applications and outpatient procedures.
- Others: This segment includes research institutions and specialized medical centers driving innovation and exploring new applications.
Type Dominance:
- Cranial Plates: The market for 3D printed cranial plates has seen substantial growth due to the high demand for precise, patient-specific solutions for trauma and tumor-related reconstructions. The estimated market size for cranial plates is projected to reach $1.2 billion by 2025.
- Hip Joints: Personalized hip joint implants are gaining traction, offering improved fit and functionality for patients with complex anatomical variations.
- Shoulder Implants: Similar to hip joints, shoulder implants are benefiting from the precision offered by 3D printing for complex reconstructive surgeries.
- Others: This encompasses a growing array of personalized implants for spinal fusion, dental applications, and even prosthetics.
Economic policies favoring healthcare innovation and investments in advanced manufacturing are key drivers in dominant regions. Infrastructure development for advanced medical facilities and research hubs further solidifies regional leadership. The market penetration for personalized 3D printed hip joints is estimated at 8% in North America and is expected to grow significantly.
Personalized 3D Printed Implant Product Innovations
Recent product innovations in the personalized 3D printed implant market focus on enhancing biocompatibility, improving mechanical properties, and streamlining the design-to-production workflow. Advancements in printing resins and powders enable the creation of implants with intricate porous structures that promote osseointegration and reduce stress shielding. Examples include patient-specific PEEK cranial implants offering improved radiolucency and reduced artifact in CT scans, and titanium alloy hip stems designed for optimal bone-implant integration. These innovations directly translate into enhanced patient outcomes, shorter recovery times, and reduced risk of complications, providing significant competitive advantages to companies at the forefront of this technological wave. The market is witnessing a surge in personalized surgical guides alongside implants, further enhancing procedural accuracy.
Report Scope & Segmentation Analysis
This report segmentations delve into the intricacies of the personalized 3D printed implant market, providing granular insights into various applications and implant types.
Application Segmentation:
- Hospital: Projected to maintain its leading position, driven by increasing complexity of surgical cases and the adoption of advanced digital workflows. Estimated market size of $3.5 billion in 2025, with a forecast CAGR of 18%.
- Clinic: Expected to experience robust growth as specialized centers adopt 3D printing for targeted reconstructive procedures. Estimated market size of $1.2 billion in 2025, with a forecast CAGR of 22%.
- Others: This segment, encompassing research and development initiatives, is crucial for future market expansion. Estimated market size of $300 million in 2025, with a forecast CAGR of 25%.
Type Segmentation:
- Cranial Plates: Continuing its strong trajectory, driven by trauma and reconstructive needs. Estimated market size of $1.2 billion in 2025, with a forecast CAGR of 19%.
- Hip Joints: Showing significant growth potential as customization offers improved patient comfort and longevity. Estimated market size of $900 million in 2025, with a forecast CAGR of 21%.
- Shoulder Implants: Emerging as a key growth area, benefiting from precise anatomical matching. Estimated market size of $700 million in 2025, with a forecast CAGR of 23%.
- Others: This broad category, including spinal implants and dental applications, is expected to see exponential growth. Estimated market size of $1.5 billion in 2025, with a forecast CAGR of 24%.
Key Drivers of Personalized 3D Printed Implant Growth
The growth of the personalized 3D printed implant market is propelled by several key factors:
- Technological Advancements: Continuous improvements in 3D printing hardware, software, and materials enable the creation of increasingly complex and biocompatible implants with superior functional properties. The development of multi-material printing and advanced simulation tools are crucial.
- Increasing Demand for Patient-Specific Solutions: Growing patient awareness and the desire for personalized healthcare treatments are driving demand for implants tailored to individual anatomy, leading to better surgical outcomes and patient satisfaction.
- Improved Clinical Outcomes: Personalized implants offer enhanced fit, reduced surgical time, faster recovery, and lower complication rates compared to traditional implants, making them increasingly preferred by surgeons and patients.
- Supportive Regulatory Environments: While stringent, regulatory bodies are increasingly adapting to approve personalized medical devices, facilitating market access for innovative 3D printed implants.
Challenges in the Personalized 3D Printed Implant Sector
Despite the promising growth, the personalized 3D printed implant sector faces several challenges:
- High Initial Investment: The cost of advanced 3D printing equipment, specialized software, and material research can be substantial, posing a barrier to entry for smaller companies.
- Regulatory Hurdles: Navigating the complex and evolving regulatory landscape for personalized medical devices requires significant expertise and resources, potentially leading to longer approval timelines.
- Supply Chain Complexity: Establishing robust and efficient supply chains for specialized materials and on-demand manufacturing of personalized implants can be challenging.
- Standardization and Quality Control: Ensuring consistent quality and performance across a wide range of personalized implants produced through additive manufacturing requires rigorous validation and quality control processes.
- Reimbursement Policies: Obtaining consistent and adequate reimbursement for personalized 3D printed implants from insurance providers can be a significant hurdle.
Emerging Opportunities in Personalized 3D Printed Implant
The personalized 3D printed implant market is ripe with emerging opportunities:
- Bioprinting and Tissue Engineering Integration: The convergence of 3D printing with bioprinting and tissue engineering holds immense potential for creating regenerative implants that integrate seamlessly with the body.
- Expansion into New Anatomical Sites: Beyond orthopedic and craniomaxillofacial applications, there is significant scope for personalized 3D printed implants in areas like cardiovascular, neurological, and reconstructive surgeries.
- Development of Smart and Active Implants: Future opportunities lie in developing implants with integrated sensors or drug delivery capabilities, enhancing patient monitoring and treatment efficacy.
- Emerging Markets: As healthcare infrastructure develops in emerging economies, the demand for advanced and personalized medical solutions like 3D printed implants is expected to surge.
- AI-Driven Design and Optimization: Leveraging AI for faster and more accurate implant design, predicting patient outcomes, and optimizing manufacturing processes presents a significant opportunity.
Leading Players in the Personalized 3D Printed Implant Market
- 3D Systems Corporations
- Stratasys
- SLM Solutions Group
- Envision TEC
- Arcam
- Organovo
- Oxford Performance Materials
- Materialise
- Bio3D Technologies
- Cyfuse Medical
- Stryker
- BioBots
- ANDREAS STIHL AG & Co. KG
- Aspect Biosystems
- Formlabs
- Medprin
- Rokit
- Materialise N.V.
Key Developments in Personalized 3D Printed Implant Industry
- 2023 October: 3D Systems launched a new biocompatible resin for medical applications, enabling enhanced detail and precision in 3D printed patient-specific surgical guides.
- 2023 September: Stratasys partnered with a leading medical device manufacturer to develop advanced 3D printed orthopedic implants for knee and hip replacements.
- 2023 July: SLM Solutions Group announced a significant investment in expanding its additive manufacturing capabilities for medical implants, focusing on titanium alloys.
- 2023 April: Materialise received regulatory approval for a novel 3D printed patient-specific implant solution for complex spinal surgeries.
- 2022 December: Organovo presented research on the potential of 3D bioprinted tissues for creating implantable cartilage.
- 2022 August: Oxford Performance Materials expanded its range of 3D printable implantable polymer solutions for cranial and facial reconstruction.
- 2022 June: Stryker announced increased utilization of 3D printing for its implant portfolio, citing improved patient outcomes and faster production cycles.
- 2021 November: Aspect Biosystems secured funding to advance its development of 3D bioprinted tissues for therapeutic applications, including regenerative implants.
- 2021 September: Formlabs introduced new materials optimized for the production of highly detailed and durable medical models and guides for implant planning.
- 2020 January: Medprin announced successful clinical trials of its 3D printed patient-specific cranial implants, showcasing excellent integration and aesthetic results.
Future Outlook for Personalized 3D Printed Implant Market
The future outlook for the personalized 3D printed implant market is exceptionally bright, characterized by sustained innovation and expanding applications. Continued advancements in materials science will lead to implants with superior mechanical properties, enhanced biocompatibility, and even bioresorbability, minimizing the need for revision surgeries. The integration of AI and machine learning will further revolutionize implant design, enabling faster, more accurate, and cost-effective customization. We anticipate a significant increase in the adoption of 3D printed implants across a wider range of surgical specialties, including cardiovascular, neurological, and reconstructive procedures, as their benefits become more widely recognized and validated. The market is on a trajectory to become a cornerstone of precision medicine, offering truly bespoke solutions that significantly improve patient quality of life and clinical outcomes. Strategic collaborations and investments will continue to shape the landscape, driving accessibility and further solidifying the position of 3D printed implants as a transformative medical technology.
Personalized 3D Printed Implant Segmentation
-
1. Application
- 1.1. Hospital
- 1.2. Clinic
- 1.3. Others
-
2. Types
- 2.1. Cranial Plates
- 2.2. Hip Joints
- 2.3. Shoulder Implants
- 2.4. Others
Personalized 3D Printed Implant Segmentation By Geography
-
1. North America
- 1.1. United States
- 1.2. Canada
- 1.3. Mexico
-
2. South America
- 2.1. Brazil
- 2.2. Argentina
- 2.3. Rest of South America
-
3. Europe
- 3.1. United Kingdom
- 3.2. Germany
- 3.3. France
- 3.4. Italy
- 3.5. Spain
- 3.6. Russia
- 3.7. Benelux
- 3.8. Nordics
- 3.9. Rest of Europe
-
4. Middle East & Africa
- 4.1. Turkey
- 4.2. Israel
- 4.3. GCC
- 4.4. North Africa
- 4.5. South Africa
- 4.6. Rest of Middle East & Africa
-
5. Asia Pacific
- 5.1. China
- 5.2. India
- 5.3. Japan
- 5.4. South Korea
- 5.5. ASEAN
- 5.6. Oceania
- 5.7. Rest of Asia Pacific

Personalized 3D Printed Implant Regional Market Share
Geographic Coverage of Personalized 3D Printed Implant
Personalized 3D Printed Implant REPORT HIGHLIGHTS
| Aspects | Details |
|---|---|
| Study Period | 2020-2034 |
| Base Year | 2025 |
| Estimated Year | 2026 |
| Forecast Period | 2026-2034 |
| Historical Period | 2020-2025 |
| Growth Rate | CAGR of 19.4% from 2020-2034 |
| Segmentation |
|
Table of Contents
- 1. Introduction
- 1.1. Research Scope
- 1.2. Market Segmentation
- 1.3. Research Methodology
- 1.4. Definitions and Assumptions
- 2. Executive Summary
- 2.1. Introduction
- 3. Market Dynamics
- 3.1. Introduction
- 3.2. Market Drivers
- 3.3. Market Restrains
- 3.4. Market Trends
- 4. Market Factor Analysis
- 4.1. Porters Five Forces
- 4.2. Supply/Value Chain
- 4.3. PESTEL analysis
- 4.4. Market Entropy
- 4.5. Patent/Trademark Analysis
- 5. Global Personalized 3D Printed Implant Analysis, Insights and Forecast, 2020-2032
- 5.1. Market Analysis, Insights and Forecast - by Application
- 5.1.1. Hospital
- 5.1.2. Clinic
- 5.1.3. Others
- 5.2. Market Analysis, Insights and Forecast - by Types
- 5.2.1. Cranial Plates
- 5.2.2. Hip Joints
- 5.2.3. Shoulder Implants
- 5.2.4. Others
- 5.3. Market Analysis, Insights and Forecast - by Region
- 5.3.1. North America
- 5.3.2. South America
- 5.3.3. Europe
- 5.3.4. Middle East & Africa
- 5.3.5. Asia Pacific
- 5.1. Market Analysis, Insights and Forecast - by Application
- 6. North America Personalized 3D Printed Implant Analysis, Insights and Forecast, 2020-2032
- 6.1. Market Analysis, Insights and Forecast - by Application
- 6.1.1. Hospital
- 6.1.2. Clinic
- 6.1.3. Others
- 6.2. Market Analysis, Insights and Forecast - by Types
- 6.2.1. Cranial Plates
- 6.2.2. Hip Joints
- 6.2.3. Shoulder Implants
- 6.2.4. Others
- 6.1. Market Analysis, Insights and Forecast - by Application
- 7. South America Personalized 3D Printed Implant Analysis, Insights and Forecast, 2020-2032
- 7.1. Market Analysis, Insights and Forecast - by Application
- 7.1.1. Hospital
- 7.1.2. Clinic
- 7.1.3. Others
- 7.2. Market Analysis, Insights and Forecast - by Types
- 7.2.1. Cranial Plates
- 7.2.2. Hip Joints
- 7.2.3. Shoulder Implants
- 7.2.4. Others
- 7.1. Market Analysis, Insights and Forecast - by Application
- 8. Europe Personalized 3D Printed Implant Analysis, Insights and Forecast, 2020-2032
- 8.1. Market Analysis, Insights and Forecast - by Application
- 8.1.1. Hospital
- 8.1.2. Clinic
- 8.1.3. Others
- 8.2. Market Analysis, Insights and Forecast - by Types
- 8.2.1. Cranial Plates
- 8.2.2. Hip Joints
- 8.2.3. Shoulder Implants
- 8.2.4. Others
- 8.1. Market Analysis, Insights and Forecast - by Application
- 9. Middle East & Africa Personalized 3D Printed Implant Analysis, Insights and Forecast, 2020-2032
- 9.1. Market Analysis, Insights and Forecast - by Application
- 9.1.1. Hospital
- 9.1.2. Clinic
- 9.1.3. Others
- 9.2. Market Analysis, Insights and Forecast - by Types
- 9.2.1. Cranial Plates
- 9.2.2. Hip Joints
- 9.2.3. Shoulder Implants
- 9.2.4. Others
- 9.1. Market Analysis, Insights and Forecast - by Application
- 10. Asia Pacific Personalized 3D Printed Implant Analysis, Insights and Forecast, 2020-2032
- 10.1. Market Analysis, Insights and Forecast - by Application
- 10.1.1. Hospital
- 10.1.2. Clinic
- 10.1.3. Others
- 10.2. Market Analysis, Insights and Forecast - by Types
- 10.2.1. Cranial Plates
- 10.2.2. Hip Joints
- 10.2.3. Shoulder Implants
- 10.2.4. Others
- 10.1. Market Analysis, Insights and Forecast - by Application
- 11. Competitive Analysis
- 11.1. Global Market Share Analysis 2025
- 11.2. Company Profiles
- 11.2.1 3D Systems Corporations
- 11.2.1.1. Overview
- 11.2.1.2. Products
- 11.2.1.3. SWOT Analysis
- 11.2.1.4. Recent Developments
- 11.2.1.5. Financials (Based on Availability)
- 11.2.2 Stratasys
- 11.2.2.1. Overview
- 11.2.2.2. Products
- 11.2.2.3. SWOT Analysis
- 11.2.2.4. Recent Developments
- 11.2.2.5. Financials (Based on Availability)
- 11.2.3 SLM Solutions Group
- 11.2.3.1. Overview
- 11.2.3.2. Products
- 11.2.3.3. SWOT Analysis
- 11.2.3.4. Recent Developments
- 11.2.3.5. Financials (Based on Availability)
- 11.2.4 Envision TEC
- 11.2.4.1. Overview
- 11.2.4.2. Products
- 11.2.4.3. SWOT Analysis
- 11.2.4.4. Recent Developments
- 11.2.4.5. Financials (Based on Availability)
- 11.2.5 Arcam
- 11.2.5.1. Overview
- 11.2.5.2. Products
- 11.2.5.3. SWOT Analysis
- 11.2.5.4. Recent Developments
- 11.2.5.5. Financials (Based on Availability)
- 11.2.6 Organovo
- 11.2.6.1. Overview
- 11.2.6.2. Products
- 11.2.6.3. SWOT Analysis
- 11.2.6.4. Recent Developments
- 11.2.6.5. Financials (Based on Availability)
- 11.2.7 Oxford Performance Materials
- 11.2.7.1. Overview
- 11.2.7.2. Products
- 11.2.7.3. SWOT Analysis
- 11.2.7.4. Recent Developments
- 11.2.7.5. Financials (Based on Availability)
- 11.2.8 Materialise
- 11.2.8.1. Overview
- 11.2.8.2. Products
- 11.2.8.3. SWOT Analysis
- 11.2.8.4. Recent Developments
- 11.2.8.5. Financials (Based on Availability)
- 11.2.9 Bio3D Technologies
- 11.2.9.1. Overview
- 11.2.9.2. Products
- 11.2.9.3. SWOT Analysis
- 11.2.9.4. Recent Developments
- 11.2.9.5. Financials (Based on Availability)
- 11.2.10 Cyfuse Medical
- 11.2.10.1. Overview
- 11.2.10.2. Products
- 11.2.10.3. SWOT Analysis
- 11.2.10.4. Recent Developments
- 11.2.10.5. Financials (Based on Availability)
- 11.2.11 Stryker
- 11.2.11.1. Overview
- 11.2.11.2. Products
- 11.2.11.3. SWOT Analysis
- 11.2.11.4. Recent Developments
- 11.2.11.5. Financials (Based on Availability)
- 11.2.12 BioBots
- 11.2.12.1. Overview
- 11.2.12.2. Products
- 11.2.12.3. SWOT Analysis
- 11.2.12.4. Recent Developments
- 11.2.12.5. Financials (Based on Availability)
- 11.2.13 ANDREAS STIHL AG & Co. KG
- 11.2.13.1. Overview
- 11.2.13.2. Products
- 11.2.13.3. SWOT Analysis
- 11.2.13.4. Recent Developments
- 11.2.13.5. Financials (Based on Availability)
- 11.2.14 Aspect Biosystems
- 11.2.14.1. Overview
- 11.2.14.2. Products
- 11.2.14.3. SWOT Analysis
- 11.2.14.4. Recent Developments
- 11.2.14.5. Financials (Based on Availability)
- 11.2.15 Formlabs
- 11.2.15.1. Overview
- 11.2.15.2. Products
- 11.2.15.3. SWOT Analysis
- 11.2.15.4. Recent Developments
- 11.2.15.5. Financials (Based on Availability)
- 11.2.16 Medprin
- 11.2.16.1. Overview
- 11.2.16.2. Products
- 11.2.16.3. SWOT Analysis
- 11.2.16.4. Recent Developments
- 11.2.16.5. Financials (Based on Availability)
- 11.2.17 Rokit
- 11.2.17.1. Overview
- 11.2.17.2. Products
- 11.2.17.3. SWOT Analysis
- 11.2.17.4. Recent Developments
- 11.2.17.5. Financials (Based on Availability)
- 11.2.18 Materialise N.V.
- 11.2.18.1. Overview
- 11.2.18.2. Products
- 11.2.18.3. SWOT Analysis
- 11.2.18.4. Recent Developments
- 11.2.18.5. Financials (Based on Availability)
- 11.2.1 3D Systems Corporations
List of Figures
- Figure 1: Global Personalized 3D Printed Implant Revenue Breakdown (million, %) by Region 2025 & 2033
- Figure 2: Global Personalized 3D Printed Implant Volume Breakdown (K, %) by Region 2025 & 2033
- Figure 3: North America Personalized 3D Printed Implant Revenue (million), by Application 2025 & 2033
- Figure 4: North America Personalized 3D Printed Implant Volume (K), by Application 2025 & 2033
- Figure 5: North America Personalized 3D Printed Implant Revenue Share (%), by Application 2025 & 2033
- Figure 6: North America Personalized 3D Printed Implant Volume Share (%), by Application 2025 & 2033
- Figure 7: North America Personalized 3D Printed Implant Revenue (million), by Types 2025 & 2033
- Figure 8: North America Personalized 3D Printed Implant Volume (K), by Types 2025 & 2033
- Figure 9: North America Personalized 3D Printed Implant Revenue Share (%), by Types 2025 & 2033
- Figure 10: North America Personalized 3D Printed Implant Volume Share (%), by Types 2025 & 2033
- Figure 11: North America Personalized 3D Printed Implant Revenue (million), by Country 2025 & 2033
- Figure 12: North America Personalized 3D Printed Implant Volume (K), by Country 2025 & 2033
- Figure 13: North America Personalized 3D Printed Implant Revenue Share (%), by Country 2025 & 2033
- Figure 14: North America Personalized 3D Printed Implant Volume Share (%), by Country 2025 & 2033
- Figure 15: South America Personalized 3D Printed Implant Revenue (million), by Application 2025 & 2033
- Figure 16: South America Personalized 3D Printed Implant Volume (K), by Application 2025 & 2033
- Figure 17: South America Personalized 3D Printed Implant Revenue Share (%), by Application 2025 & 2033
- Figure 18: South America Personalized 3D Printed Implant Volume Share (%), by Application 2025 & 2033
- Figure 19: South America Personalized 3D Printed Implant Revenue (million), by Types 2025 & 2033
- Figure 20: South America Personalized 3D Printed Implant Volume (K), by Types 2025 & 2033
- Figure 21: South America Personalized 3D Printed Implant Revenue Share (%), by Types 2025 & 2033
- Figure 22: South America Personalized 3D Printed Implant Volume Share (%), by Types 2025 & 2033
- Figure 23: South America Personalized 3D Printed Implant Revenue (million), by Country 2025 & 2033
- Figure 24: South America Personalized 3D Printed Implant Volume (K), by Country 2025 & 2033
- Figure 25: South America Personalized 3D Printed Implant Revenue Share (%), by Country 2025 & 2033
- Figure 26: South America Personalized 3D Printed Implant Volume Share (%), by Country 2025 & 2033
- Figure 27: Europe Personalized 3D Printed Implant Revenue (million), by Application 2025 & 2033
- Figure 28: Europe Personalized 3D Printed Implant Volume (K), by Application 2025 & 2033
- Figure 29: Europe Personalized 3D Printed Implant Revenue Share (%), by Application 2025 & 2033
- Figure 30: Europe Personalized 3D Printed Implant Volume Share (%), by Application 2025 & 2033
- Figure 31: Europe Personalized 3D Printed Implant Revenue (million), by Types 2025 & 2033
- Figure 32: Europe Personalized 3D Printed Implant Volume (K), by Types 2025 & 2033
- Figure 33: Europe Personalized 3D Printed Implant Revenue Share (%), by Types 2025 & 2033
- Figure 34: Europe Personalized 3D Printed Implant Volume Share (%), by Types 2025 & 2033
- Figure 35: Europe Personalized 3D Printed Implant Revenue (million), by Country 2025 & 2033
- Figure 36: Europe Personalized 3D Printed Implant Volume (K), by Country 2025 & 2033
- Figure 37: Europe Personalized 3D Printed Implant Revenue Share (%), by Country 2025 & 2033
- Figure 38: Europe Personalized 3D Printed Implant Volume Share (%), by Country 2025 & 2033
- Figure 39: Middle East & Africa Personalized 3D Printed Implant Revenue (million), by Application 2025 & 2033
- Figure 40: Middle East & Africa Personalized 3D Printed Implant Volume (K), by Application 2025 & 2033
- Figure 41: Middle East & Africa Personalized 3D Printed Implant Revenue Share (%), by Application 2025 & 2033
- Figure 42: Middle East & Africa Personalized 3D Printed Implant Volume Share (%), by Application 2025 & 2033
- Figure 43: Middle East & Africa Personalized 3D Printed Implant Revenue (million), by Types 2025 & 2033
- Figure 44: Middle East & Africa Personalized 3D Printed Implant Volume (K), by Types 2025 & 2033
- Figure 45: Middle East & Africa Personalized 3D Printed Implant Revenue Share (%), by Types 2025 & 2033
- Figure 46: Middle East & Africa Personalized 3D Printed Implant Volume Share (%), by Types 2025 & 2033
- Figure 47: Middle East & Africa Personalized 3D Printed Implant Revenue (million), by Country 2025 & 2033
- Figure 48: Middle East & Africa Personalized 3D Printed Implant Volume (K), by Country 2025 & 2033
- Figure 49: Middle East & Africa Personalized 3D Printed Implant Revenue Share (%), by Country 2025 & 2033
- Figure 50: Middle East & Africa Personalized 3D Printed Implant Volume Share (%), by Country 2025 & 2033
- Figure 51: Asia Pacific Personalized 3D Printed Implant Revenue (million), by Application 2025 & 2033
- Figure 52: Asia Pacific Personalized 3D Printed Implant Volume (K), by Application 2025 & 2033
- Figure 53: Asia Pacific Personalized 3D Printed Implant Revenue Share (%), by Application 2025 & 2033
- Figure 54: Asia Pacific Personalized 3D Printed Implant Volume Share (%), by Application 2025 & 2033
- Figure 55: Asia Pacific Personalized 3D Printed Implant Revenue (million), by Types 2025 & 2033
- Figure 56: Asia Pacific Personalized 3D Printed Implant Volume (K), by Types 2025 & 2033
- Figure 57: Asia Pacific Personalized 3D Printed Implant Revenue Share (%), by Types 2025 & 2033
- Figure 58: Asia Pacific Personalized 3D Printed Implant Volume Share (%), by Types 2025 & 2033
- Figure 59: Asia Pacific Personalized 3D Printed Implant Revenue (million), by Country 2025 & 2033
- Figure 60: Asia Pacific Personalized 3D Printed Implant Volume (K), by Country 2025 & 2033
- Figure 61: Asia Pacific Personalized 3D Printed Implant Revenue Share (%), by Country 2025 & 2033
- Figure 62: Asia Pacific Personalized 3D Printed Implant Volume Share (%), by Country 2025 & 2033
List of Tables
- Table 1: Global Personalized 3D Printed Implant Revenue million Forecast, by Application 2020 & 2033
- Table 2: Global Personalized 3D Printed Implant Volume K Forecast, by Application 2020 & 2033
- Table 3: Global Personalized 3D Printed Implant Revenue million Forecast, by Types 2020 & 2033
- Table 4: Global Personalized 3D Printed Implant Volume K Forecast, by Types 2020 & 2033
- Table 5: Global Personalized 3D Printed Implant Revenue million Forecast, by Region 2020 & 2033
- Table 6: Global Personalized 3D Printed Implant Volume K Forecast, by Region 2020 & 2033
- Table 7: Global Personalized 3D Printed Implant Revenue million Forecast, by Application 2020 & 2033
- Table 8: Global Personalized 3D Printed Implant Volume K Forecast, by Application 2020 & 2033
- Table 9: Global Personalized 3D Printed Implant Revenue million Forecast, by Types 2020 & 2033
- Table 10: Global Personalized 3D Printed Implant Volume K Forecast, by Types 2020 & 2033
- Table 11: Global Personalized 3D Printed Implant Revenue million Forecast, by Country 2020 & 2033
- Table 12: Global Personalized 3D Printed Implant Volume K Forecast, by Country 2020 & 2033
- Table 13: United States Personalized 3D Printed Implant Revenue (million) Forecast, by Application 2020 & 2033
- Table 14: United States Personalized 3D Printed Implant Volume (K) Forecast, by Application 2020 & 2033
- Table 15: Canada Personalized 3D Printed Implant Revenue (million) Forecast, by Application 2020 & 2033
- Table 16: Canada Personalized 3D Printed Implant Volume (K) Forecast, by Application 2020 & 2033
- Table 17: Mexico Personalized 3D Printed Implant Revenue (million) Forecast, by Application 2020 & 2033
- Table 18: Mexico Personalized 3D Printed Implant Volume (K) Forecast, by Application 2020 & 2033
- Table 19: Global Personalized 3D Printed Implant Revenue million Forecast, by Application 2020 & 2033
- Table 20: Global Personalized 3D Printed Implant Volume K Forecast, by Application 2020 & 2033
- Table 21: Global Personalized 3D Printed Implant Revenue million Forecast, by Types 2020 & 2033
- Table 22: Global Personalized 3D Printed Implant Volume K Forecast, by Types 2020 & 2033
- Table 23: Global Personalized 3D Printed Implant Revenue million Forecast, by Country 2020 & 2033
- Table 24: Global Personalized 3D Printed Implant Volume K Forecast, by Country 2020 & 2033
- Table 25: Brazil Personalized 3D Printed Implant Revenue (million) Forecast, by Application 2020 & 2033
- Table 26: Brazil Personalized 3D Printed Implant Volume (K) Forecast, by Application 2020 & 2033
- Table 27: Argentina Personalized 3D Printed Implant Revenue (million) Forecast, by Application 2020 & 2033
- Table 28: Argentina Personalized 3D Printed Implant Volume (K) Forecast, by Application 2020 & 2033
- Table 29: Rest of South America Personalized 3D Printed Implant Revenue (million) Forecast, by Application 2020 & 2033
- Table 30: Rest of South America Personalized 3D Printed Implant Volume (K) Forecast, by Application 2020 & 2033
- Table 31: Global Personalized 3D Printed Implant Revenue million Forecast, by Application 2020 & 2033
- Table 32: Global Personalized 3D Printed Implant Volume K Forecast, by Application 2020 & 2033
- Table 33: Global Personalized 3D Printed Implant Revenue million Forecast, by Types 2020 & 2033
- Table 34: Global Personalized 3D Printed Implant Volume K Forecast, by Types 2020 & 2033
- Table 35: Global Personalized 3D Printed Implant Revenue million Forecast, by Country 2020 & 2033
- Table 36: Global Personalized 3D Printed Implant Volume K Forecast, by Country 2020 & 2033
- Table 37: United Kingdom Personalized 3D Printed Implant Revenue (million) Forecast, by Application 2020 & 2033
- Table 38: United Kingdom Personalized 3D Printed Implant Volume (K) Forecast, by Application 2020 & 2033
- Table 39: Germany Personalized 3D Printed Implant Revenue (million) Forecast, by Application 2020 & 2033
- Table 40: Germany Personalized 3D Printed Implant Volume (K) Forecast, by Application 2020 & 2033
- Table 41: France Personalized 3D Printed Implant Revenue (million) Forecast, by Application 2020 & 2033
- Table 42: France Personalized 3D Printed Implant Volume (K) Forecast, by Application 2020 & 2033
- Table 43: Italy Personalized 3D Printed Implant Revenue (million) Forecast, by Application 2020 & 2033
- Table 44: Italy Personalized 3D Printed Implant Volume (K) Forecast, by Application 2020 & 2033
- Table 45: Spain Personalized 3D Printed Implant Revenue (million) Forecast, by Application 2020 & 2033
- Table 46: Spain Personalized 3D Printed Implant Volume (K) Forecast, by Application 2020 & 2033
- Table 47: Russia Personalized 3D Printed Implant Revenue (million) Forecast, by Application 2020 & 2033
- Table 48: Russia Personalized 3D Printed Implant Volume (K) Forecast, by Application 2020 & 2033
- Table 49: Benelux Personalized 3D Printed Implant Revenue (million) Forecast, by Application 2020 & 2033
- Table 50: Benelux Personalized 3D Printed Implant Volume (K) Forecast, by Application 2020 & 2033
- Table 51: Nordics Personalized 3D Printed Implant Revenue (million) Forecast, by Application 2020 & 2033
- Table 52: Nordics Personalized 3D Printed Implant Volume (K) Forecast, by Application 2020 & 2033
- Table 53: Rest of Europe Personalized 3D Printed Implant Revenue (million) Forecast, by Application 2020 & 2033
- Table 54: Rest of Europe Personalized 3D Printed Implant Volume (K) Forecast, by Application 2020 & 2033
- Table 55: Global Personalized 3D Printed Implant Revenue million Forecast, by Application 2020 & 2033
- Table 56: Global Personalized 3D Printed Implant Volume K Forecast, by Application 2020 & 2033
- Table 57: Global Personalized 3D Printed Implant Revenue million Forecast, by Types 2020 & 2033
- Table 58: Global Personalized 3D Printed Implant Volume K Forecast, by Types 2020 & 2033
- Table 59: Global Personalized 3D Printed Implant Revenue million Forecast, by Country 2020 & 2033
- Table 60: Global Personalized 3D Printed Implant Volume K Forecast, by Country 2020 & 2033
- Table 61: Turkey Personalized 3D Printed Implant Revenue (million) Forecast, by Application 2020 & 2033
- Table 62: Turkey Personalized 3D Printed Implant Volume (K) Forecast, by Application 2020 & 2033
- Table 63: Israel Personalized 3D Printed Implant Revenue (million) Forecast, by Application 2020 & 2033
- Table 64: Israel Personalized 3D Printed Implant Volume (K) Forecast, by Application 2020 & 2033
- Table 65: GCC Personalized 3D Printed Implant Revenue (million) Forecast, by Application 2020 & 2033
- Table 66: GCC Personalized 3D Printed Implant Volume (K) Forecast, by Application 2020 & 2033
- Table 67: North Africa Personalized 3D Printed Implant Revenue (million) Forecast, by Application 2020 & 2033
- Table 68: North Africa Personalized 3D Printed Implant Volume (K) Forecast, by Application 2020 & 2033
- Table 69: South Africa Personalized 3D Printed Implant Revenue (million) Forecast, by Application 2020 & 2033
- Table 70: South Africa Personalized 3D Printed Implant Volume (K) Forecast, by Application 2020 & 2033
- Table 71: Rest of Middle East & Africa Personalized 3D Printed Implant Revenue (million) Forecast, by Application 2020 & 2033
- Table 72: Rest of Middle East & Africa Personalized 3D Printed Implant Volume (K) Forecast, by Application 2020 & 2033
- Table 73: Global Personalized 3D Printed Implant Revenue million Forecast, by Application 2020 & 2033
- Table 74: Global Personalized 3D Printed Implant Volume K Forecast, by Application 2020 & 2033
- Table 75: Global Personalized 3D Printed Implant Revenue million Forecast, by Types 2020 & 2033
- Table 76: Global Personalized 3D Printed Implant Volume K Forecast, by Types 2020 & 2033
- Table 77: Global Personalized 3D Printed Implant Revenue million Forecast, by Country 2020 & 2033
- Table 78: Global Personalized 3D Printed Implant Volume K Forecast, by Country 2020 & 2033
- Table 79: China Personalized 3D Printed Implant Revenue (million) Forecast, by Application 2020 & 2033
- Table 80: China Personalized 3D Printed Implant Volume (K) Forecast, by Application 2020 & 2033
- Table 81: India Personalized 3D Printed Implant Revenue (million) Forecast, by Application 2020 & 2033
- Table 82: India Personalized 3D Printed Implant Volume (K) Forecast, by Application 2020 & 2033
- Table 83: Japan Personalized 3D Printed Implant Revenue (million) Forecast, by Application 2020 & 2033
- Table 84: Japan Personalized 3D Printed Implant Volume (K) Forecast, by Application 2020 & 2033
- Table 85: South Korea Personalized 3D Printed Implant Revenue (million) Forecast, by Application 2020 & 2033
- Table 86: South Korea Personalized 3D Printed Implant Volume (K) Forecast, by Application 2020 & 2033
- Table 87: ASEAN Personalized 3D Printed Implant Revenue (million) Forecast, by Application 2020 & 2033
- Table 88: ASEAN Personalized 3D Printed Implant Volume (K) Forecast, by Application 2020 & 2033
- Table 89: Oceania Personalized 3D Printed Implant Revenue (million) Forecast, by Application 2020 & 2033
- Table 90: Oceania Personalized 3D Printed Implant Volume (K) Forecast, by Application 2020 & 2033
- Table 91: Rest of Asia Pacific Personalized 3D Printed Implant Revenue (million) Forecast, by Application 2020 & 2033
- Table 92: Rest of Asia Pacific Personalized 3D Printed Implant Volume (K) Forecast, by Application 2020 & 2033
Frequently Asked Questions
1. What is the projected Compound Annual Growth Rate (CAGR) of the Personalized 3D Printed Implant?
The projected CAGR is approximately 19.4%.
2. Which companies are prominent players in the Personalized 3D Printed Implant?
Key companies in the market include 3D Systems Corporations, Stratasys, SLM Solutions Group, Envision TEC, Arcam, Organovo, Oxford Performance Materials, Materialise, Bio3D Technologies, Cyfuse Medical, Stryker, BioBots, ANDREAS STIHL AG & Co. KG, Aspect Biosystems, Formlabs, Medprin, Rokit, Materialise N.V..
3. What are the main segments of the Personalized 3D Printed Implant?
The market segments include Application, Types.
4. Can you provide details about the market size?
The market size is estimated to be USD 2617.8 million as of 2022.
5. What are some drivers contributing to market growth?
N/A
6. What are the notable trends driving market growth?
N/A
7. Are there any restraints impacting market growth?
N/A
8. Can you provide examples of recent developments in the market?
N/A
9. What pricing options are available for accessing the report?
Pricing options include single-user, multi-user, and enterprise licenses priced at USD 3350.00, USD 5025.00, and USD 6700.00 respectively.
10. Is the market size provided in terms of value or volume?
The market size is provided in terms of value, measured in million and volume, measured in K.
11. Are there any specific market keywords associated with the report?
Yes, the market keyword associated with the report is "Personalized 3D Printed Implant," which aids in identifying and referencing the specific market segment covered.
12. How do I determine which pricing option suits my needs best?
The pricing options vary based on user requirements and access needs. Individual users may opt for single-user licenses, while businesses requiring broader access may choose multi-user or enterprise licenses for cost-effective access to the report.
13. Are there any additional resources or data provided in the Personalized 3D Printed Implant report?
While the report offers comprehensive insights, it's advisable to review the specific contents or supplementary materials provided to ascertain if additional resources or data are available.
14. How can I stay updated on further developments or reports in the Personalized 3D Printed Implant?
To stay informed about further developments, trends, and reports in the Personalized 3D Printed Implant, consider subscribing to industry newsletters, following relevant companies and organizations, or regularly checking reputable industry news sources and publications.
Methodology
Step 1 - Identification of Relevant Samples Size from Population Database


Step 2 - Approaches for Defining Global Market Size (Value, Volume* & Price*)

Note*: In applicable scenarios
Step 3 - Data Sources
Primary Research
- Web Analytics
- Survey Reports
- Research Institute
- Latest Research Reports
- Opinion Leaders
Secondary Research
- Annual Reports
- White Paper
- Latest Press Release
- Industry Association
- Paid Database
- Investor Presentations

Step 4 - Data Triangulation
Involves using different sources of information in order to increase the validity of a study
These sources are likely to be stakeholders in a program - participants, other researchers, program staff, other community members, and so on.
Then we put all data in single framework & apply various statistical tools to find out the dynamic on the market.
During the analysis stage, feedback from the stakeholder groups would be compared to determine areas of agreement as well as areas of divergence