

Key Insights
The Platinum Group Metals (PGM) market, comprising platinum, palladium, rhodium, iridium, ruthenium, and osmium, is poised for robust expansion. With a current market size of 41.59 billion and a projected Compound Annual Growth Rate (CAGR) of 3.31% from a base year of 2024, the industry demonstrates significant upward momentum. This growth is primarily propelled by escalating demand from the automotive sector for autocatalysts, crucial for meeting global emission standards. Emerging opportunities in the electric vehicle segment, particularly in fuel cell and battery technologies, further bolster market prospects. The electronics industry's sustained expansion and increasing utilization of PGMs in medical applications (dental, pharmaceutical) and industrial processes (glass, ceramics, pigments) also contribute to market growth. Geographically, the Asia-Pacific region, led by China and India, is a key driver due to industrialization and rising consumer spending.
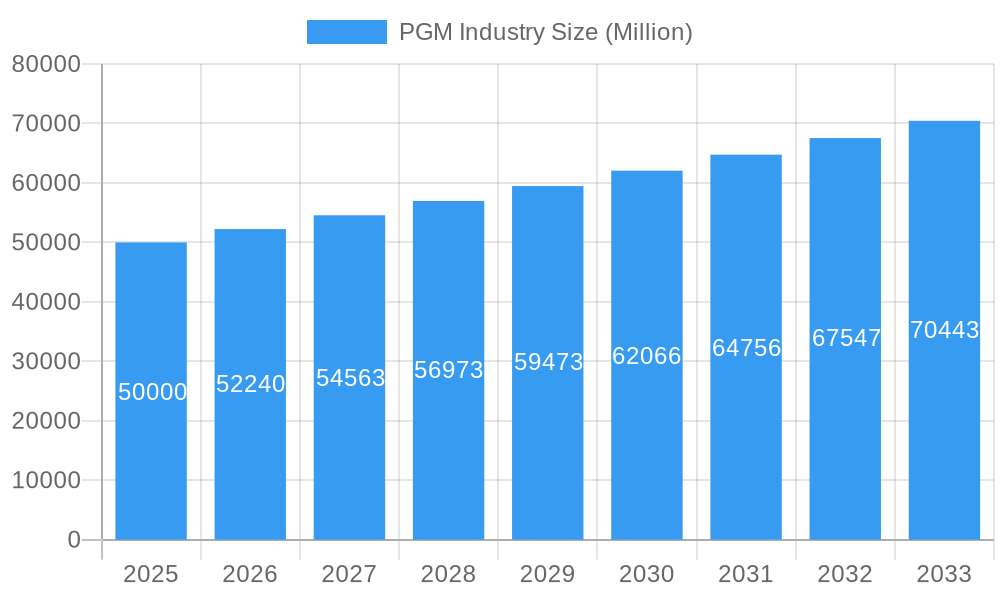
PGM Industry Market Size (In Billion)
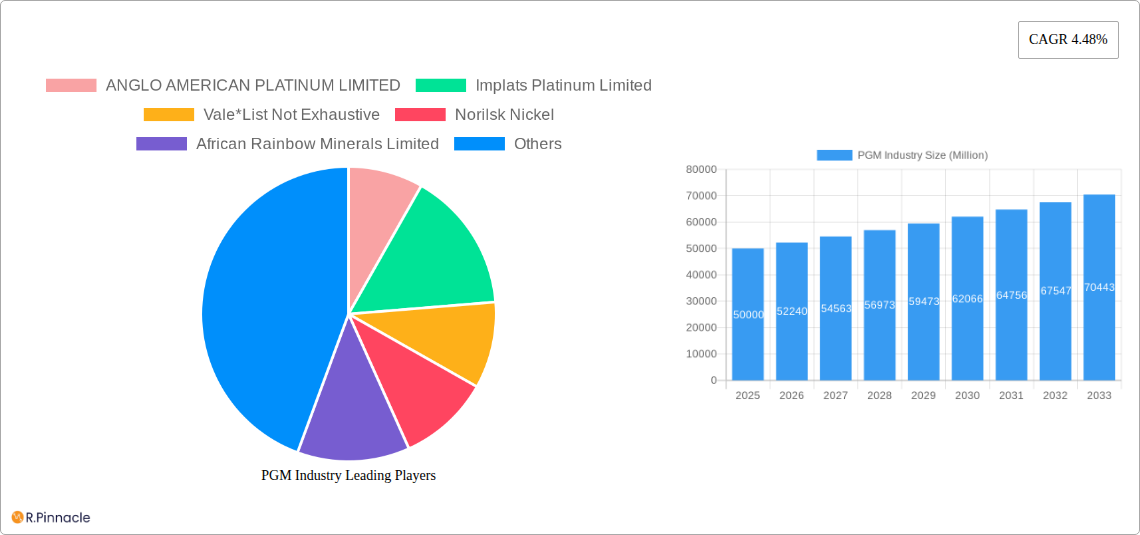
Despite its positive outlook, the PGM market faces hurdles. Price volatility, stemming from supply chain disruptions and geopolitical events, poses a significant challenge. The development and adoption of substitute materials and technologies, alongside environmental concerns associated with PGM extraction and processing, also act as market restraints. To navigate these challenges, industry stakeholders are prioritizing sustainable mining practices, exploring novel PGM applications, and investing in innovative technologies. Market segmentation reveals dominant demand in autocatalysts and electronics, with notable growth potential in medical and chemical sectors. The competitive landscape features major mining corporations and specialized chemical processors, indicative of a complex value chain. Leading entities such as Anglo American Platinum Limited, Implats Platinum Limited, and Norilsk Nickel are actively pursuing strategic growth and technological advancements to secure their market leadership.
PGM Industry Company Market Share
PGM Industry Report: 2019-2033 Market Analysis & Forecast
This comprehensive report provides a detailed analysis of the Platinum Group Metals (PGM) industry, covering the period 2019-2033. With a focus on market dynamics, innovation trends, and key players, this report offers invaluable insights for industry professionals, investors, and strategic decision-makers. The report utilizes a robust methodology, incorporating historical data (2019-2024), base year (2025), and a forecast period (2025-2033), to provide a comprehensive understanding of the PGM market's evolution and future trajectory. The global market value is projected to reach xx Million by 2033.
PGM Industry Market Structure & Innovation Trends
This section analyzes the PGM market structure, highlighting key aspects such as market concentration, innovation drivers, regulatory frameworks, and M&A activities. The analysis incorporates data from key players including Anglo American Platinum Limited, Implats Platinum Limited, Vale, Norilsk Nickel, African Rainbow Minerals Limited, GLENCORE, Northam Platinum Holdings Limited, Johnson Matthey, Sibanye-Stillwater, and Platinum Group Metals Ltd. While the list is not exhaustive, it represents a significant portion of the market landscape.
Market Concentration: The PGM market exhibits a moderately concentrated structure, with a few major players commanding significant market share. Further analysis reveals that xx% of the market is controlled by the top 5 companies in 2025, with this concentration anticipated to xx% by 2033.
Innovation Drivers: The increasing demand for PGMs in automotive catalysts, particularly from the growing electric vehicle (EV) market, is a major driver of innovation. R&D investment in fuel cell technologies and other applications also contributes to market dynamism. Moreover, advancements in recycling technologies are influencing the industry's sustainability landscape.
Regulatory Frameworks: Government regulations related to emissions and environmental protection significantly impact the PGM market. Stricter emission standards drive demand for automotive catalysts, creating a positive market influence.
Product Substitutes: While there are some potential substitutes for PGMs in certain applications, their limited effectiveness and higher costs limit their market penetration.
M&A Activity: Recent acquisitions like Sibanye-Stillwater's acquisition of Reldan (November 2023) demonstrate the increased focus on recycling and expanding the supply chain. The total value of M&A deals in the PGM industry in 2024 was estimated at xx Million, with a projected increase to xx Million by 2033.
PGM Industry Market Dynamics & Trends
This section dives deep into the market dynamics, examining factors driving market growth, technological disruptions, consumer preferences, and competitive dynamics. The analysis includes detailed exploration of the CAGR (Compound Annual Growth Rate) and market penetration for various PGM applications.
The PGM market is experiencing substantial growth driven by several factors. The rising demand for cleaner vehicles and industrial emission controls is a significant factor. Furthermore, expanding applications in electronics, fuel cells, and other advanced technologies are fueling market expansion. Technological disruptions, such as advancements in recycling and the development of new applications for PGMs, are further contributing to market growth. This translates to a projected CAGR of xx% during the forecast period. Market penetration in the autocatalyst segment, for instance, is projected to reach xx% by 2033. Competitive dynamics are shaped by strategic alliances, M&A activities, and technological advancements amongst leading industry players.
Dominant Regions & Segments in PGM Industry
This section identifies the leading regions and segments within the PGM market.
Dominant Regions: South Africa and Russia are currently dominant regions, accounting for a significant share of global PGM production. However, other regions, such as North America and Europe, are experiencing growing demand, especially due to increased demand for auto-catalysts, and thus experiencing a surge in production.
Dominant Metal Types & Applications:
- Platinum: Remains the dominant metal type, driven by its extensive use in autocatalysts.
- Palladium: Experiencing significant growth due to its use in automotive and electronics applications.
- Auto Catalysts: This application segment remains the largest consumer of PGMs, driven by stringent emission regulations globally.
- Electrical and Electronics: Growth in this segment is spurred by the increasing demand for PGMs in various electronic components, particularly in consumer electronics and computers.
Key drivers for these dominant segments and regions include:
- Strong economic growth in several regions.
- Growing investments in infrastructure, particularly in emerging economies.
- Favorable government policies supporting the adoption of cleaner technologies.
Further analysis illustrates the detailed market dominance of these segments and regions, highlighting the key factors that contribute to their leadership positions.
PGM Industry Product Innovations
Recent product innovations focus on enhancing the efficiency and sustainability of PGM applications. Advancements in catalyst technology are leading to improved emission control, and new applications in fuel cells and hydrogen technologies are emerging. Companies are also focusing on developing more efficient and cost-effective recycling processes to maximize resource utilization and minimize environmental impact.
Report Scope & Segmentation Analysis
This report comprehensively segments the PGM market by metal type (Platinum, Palladium, Rhodium, Iridium, Ruthenium, Osmium) and application (Auto Catalysts, Electrical and Electronics, Fuel Cells, Glass, Ceramics, and Pigments, Jewellery, Medical (Dental and Pharmaceuticals), Chemical Industry, Other Applications). Each segment is analyzed for its market size, growth projections, and competitive landscape.
Each segment exhibits varying growth dynamics; the autocatalyst segment continues to be the largest consumer of PGMs, while fuel cells and other emerging applications show high growth potential. The competitive landscape varies across different segments, with some segments characterized by high competition and others with relatively fewer players.
Key Drivers of PGM Industry Growth
The PGM industry's growth is driven by several key factors. The increasing demand for emission control technologies, particularly in the automotive sector, is a significant driver. The growth of fuel cell technology and the expanding use of PGMs in electronics and other advanced applications also contribute significantly. Stringent environmental regulations globally are further bolstering the demand for PGMs.
Challenges in the PGM Industry Sector
The PGM industry faces several challenges, including price volatility, supply chain disruptions, and the complexities of securing sustainable sourcing. Environmental regulations and the need for responsible mining practices also impose constraints on the industry. These factors can significantly impact the profitability and sustainability of the PGM industry. For example, supply chain disruptions in 2024 resulted in a xx% increase in PGM prices.
Emerging Opportunities in PGM Industry
Several emerging opportunities exist within the PGM industry. The growing demand for fuel cell technologies presents a significant opportunity for growth. Further exploration of the application of PGMs in electronics, medical devices, and other sectors also offers considerable potential. The development of more efficient and sustainable recycling technologies opens avenues for improved resource utilization.
Leading Players in the PGM Industry Market
- ANGLO AMERICAN PLATINUM LIMITED
- Implats Platinum Limited
- Vale
- Norilsk Nickel
- African Rainbow Minerals Limited
- GLENCORE
- Northam Platinum Holdings Limited
- Johnson Matthey
- Sibanye-Stillwater
- Platinum Group Metals Ltd
Key Developments in PGM Industry
- October 2023: Anglo-American collaborated with BMW Group South Africa and Sasol South Africa Limited to supply PGMs for hydrogen fuel-cell electric vehicles (FCEVs). This collaboration demonstrates the growing interest in hydrogen technology and its potential to drive PGM demand.
- November 2023: Sibanye-Stillwater's acquisition of Reldan significantly strengthens its position in the recycling sector, expanding its access to valuable PGMs from recycled materials. This underscores the growing importance of recycling in ensuring sustainable PGM supply chains.
Future Outlook for PGM Industry Market
The PGM market is poised for continued growth, driven by the increasing demand for clean energy solutions and technological advancements. The expanding adoption of electric vehicles and fuel cell technologies will significantly boost demand for PGMs in the coming years. Strategic collaborations and investments in recycling and sustainable sourcing will further shape the industry's future trajectory. The long-term outlook remains positive, with considerable potential for expansion across various applications.
PGM Industry Segmentation
-
1. Metal Type
- 1.1. Platinum
- 1.2. Palladium
- 1.3. Rhodium
- 1.4. Iridium
- 1.5. Ruthenium
- 1.6. Osmium
-
2. Application
- 2.1. Auto Catalysts
- 2.2. Electrical and Electronics
- 2.3. Fuel Cells
- 2.4. Glass, Ceramics, and Pigments
- 2.5. Jewellery
- 2.6. Medical (Dental and Pharmaceuticals)
- 2.7. Chemical Industry
- 2.8. Other Ap
PGM Industry Segmentation By Geography
-
1. Asia Pacific
- 1.1. China
- 1.2. India
- 1.3. Japan
- 1.4. South Korea
- 1.5. ASEAN Countries
- 1.6. Rest of Asia Pacific
-
2. North America
- 2.1. United States
- 2.2. Canada
- 2.3. Mexico
-
3. Europe
- 3.1. Germany
- 3.2. United Kingdom
- 3.3. Italy
- 3.4. France
- 3.5. Rest of Europe
-
4. South America
- 4.1. Brazil
- 4.2. Argentina
- 4.3. Rest of South America
-
5. Middle East and Africa
- 5.1. Saudi Arabia
- 5.2. South Africa
- 5.3. Rest of Middle East and Africa
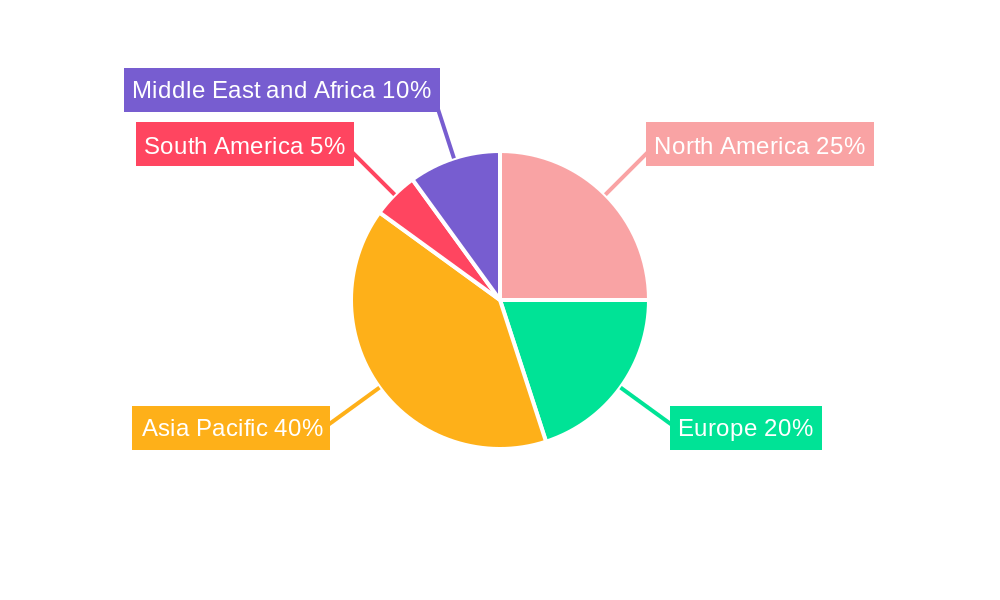
PGM Industry Regional Market Share
Geographic Coverage of PGM Industry
PGM Industry REPORT HIGHLIGHTS
| Aspects | Details |
|---|---|
| Study Period | 2020-2034 |
| Base Year | 2025 |
| Estimated Year | 2026 |
| Forecast Period | 2026-2034 |
| Historical Period | 2020-2025 |
| Growth Rate | CAGR of 3.31% from 2020-2034 |
| Segmentation |
|
Table of Contents
- 1. Introduction
- 1.1. Research Scope
- 1.2. Market Segmentation
- 1.3. Research Objective
- 1.4. Definitions and Assumptions
- 2. Executive Summary
- 2.1. Market Snapshot
- 3. Market Dynamics
- 3.1. Market Drivers
- 3.2. Market Restrains
- 3.3. Market Trends
- 3.4. Market Opportunities
- 4. Market Factor Analysis
- 4.1. Porters Five Forces
- 4.1.1. Bargaining Power of Suppliers
- 4.1.2. Bargaining Power of Buyers
- 4.1.3. Threat of New Entrants
- 4.1.4. Threat of Substitutes
- 4.1.5. Competitive Rivalry
- 4.2. PESTEL analysis
- 4.3. BCG Analysis
- 4.3.1. Stars (High Growth, High Market Share)
- 4.3.2. Cash Cows (Low Growth, High Market Share)
- 4.3.3. Question Mark (High Growth, Low Market Share)
- 4.3.4. Dogs (Low Growth, Low Market Share)
- 4.4. Ansoff Matrix Analysis
- 4.5. Supply Chain Analysis
- 4.6. Regulatory Landscape
- 4.7. Current Market Potential and Opportunity Assessment (TAM–SAM–SOM Framework)
- 4.8. PRI Analyst Note
- 4.1. Porters Five Forces
- 5. Market Analysis, Insights and Forecast 2021-2033
- 5.1. Market Analysis, Insights and Forecast - by Metal Type
- 5.1.1. Platinum
- 5.1.2. Palladium
- 5.1.3. Rhodium
- 5.1.4. Iridium
- 5.1.5. Ruthenium
- 5.1.6. Osmium
- 5.2. Market Analysis, Insights and Forecast - by Application
- 5.2.1. Auto Catalysts
- 5.2.2. Electrical and Electronics
- 5.2.3. Fuel Cells
- 5.2.4. Glass, Ceramics, and Pigments
- 5.2.5. Jewellery
- 5.2.6. Medical (Dental and Pharmaceuticals)
- 5.2.7. Chemical Industry
- 5.2.8. Other Ap
- 5.3. Market Analysis, Insights and Forecast - by Region
- 5.3.1. Asia Pacific
- 5.3.2. North America
- 5.3.3. Europe
- 5.3.4. South America
- 5.3.5. Middle East and Africa
- 5.1. Market Analysis, Insights and Forecast - by Metal Type
- 6. Global PGM Industry Analysis, Insights and Forecast, 2021-2033
- 6.1. Market Analysis, Insights and Forecast - by Metal Type
- 6.1.1. Platinum
- 6.1.2. Palladium
- 6.1.3. Rhodium
- 6.1.4. Iridium
- 6.1.5. Ruthenium
- 6.1.6. Osmium
- 6.2. Market Analysis, Insights and Forecast - by Application
- 6.2.1. Auto Catalysts
- 6.2.2. Electrical and Electronics
- 6.2.3. Fuel Cells
- 6.2.4. Glass, Ceramics, and Pigments
- 6.2.5. Jewellery
- 6.2.6. Medical (Dental and Pharmaceuticals)
- 6.2.7. Chemical Industry
- 6.2.8. Other Ap
- 6.1. Market Analysis, Insights and Forecast - by Metal Type
- 7. Asia Pacific PGM Industry Analysis, Insights and Forecast, 2020-2032
- 7.1. Market Analysis, Insights and Forecast - by Metal Type
- 7.1.1. Platinum
- 7.1.2. Palladium
- 7.1.3. Rhodium
- 7.1.4. Iridium
- 7.1.5. Ruthenium
- 7.1.6. Osmium
- 7.2. Market Analysis, Insights and Forecast - by Application
- 7.2.1. Auto Catalysts
- 7.2.2. Electrical and Electronics
- 7.2.3. Fuel Cells
- 7.2.4. Glass, Ceramics, and Pigments
- 7.2.5. Jewellery
- 7.2.6. Medical (Dental and Pharmaceuticals)
- 7.2.7. Chemical Industry
- 7.2.8. Other Ap
- 7.1. Market Analysis, Insights and Forecast - by Metal Type
- 8. North America PGM Industry Analysis, Insights and Forecast, 2020-2032
- 8.1. Market Analysis, Insights and Forecast - by Metal Type
- 8.1.1. Platinum
- 8.1.2. Palladium
- 8.1.3. Rhodium
- 8.1.4. Iridium
- 8.1.5. Ruthenium
- 8.1.6. Osmium
- 8.2. Market Analysis, Insights and Forecast - by Application
- 8.2.1. Auto Catalysts
- 8.2.2. Electrical and Electronics
- 8.2.3. Fuel Cells
- 8.2.4. Glass, Ceramics, and Pigments
- 8.2.5. Jewellery
- 8.2.6. Medical (Dental and Pharmaceuticals)
- 8.2.7. Chemical Industry
- 8.2.8. Other Ap
- 8.1. Market Analysis, Insights and Forecast - by Metal Type
- 9. Europe PGM Industry Analysis, Insights and Forecast, 2020-2032
- 9.1. Market Analysis, Insights and Forecast - by Metal Type
- 9.1.1. Platinum
- 9.1.2. Palladium
- 9.1.3. Rhodium
- 9.1.4. Iridium
- 9.1.5. Ruthenium
- 9.1.6. Osmium
- 9.2. Market Analysis, Insights and Forecast - by Application
- 9.2.1. Auto Catalysts
- 9.2.2. Electrical and Electronics
- 9.2.3. Fuel Cells
- 9.2.4. Glass, Ceramics, and Pigments
- 9.2.5. Jewellery
- 9.2.6. Medical (Dental and Pharmaceuticals)
- 9.2.7. Chemical Industry
- 9.2.8. Other Ap
- 9.1. Market Analysis, Insights and Forecast - by Metal Type
- 10. South America PGM Industry Analysis, Insights and Forecast, 2020-2032
- 10.1. Market Analysis, Insights and Forecast - by Metal Type
- 10.1.1. Platinum
- 10.1.2. Palladium
- 10.1.3. Rhodium
- 10.1.4. Iridium
- 10.1.5. Ruthenium
- 10.1.6. Osmium
- 10.2. Market Analysis, Insights and Forecast - by Application
- 10.2.1. Auto Catalysts
- 10.2.2. Electrical and Electronics
- 10.2.3. Fuel Cells
- 10.2.4. Glass, Ceramics, and Pigments
- 10.2.5. Jewellery
- 10.2.6. Medical (Dental and Pharmaceuticals)
- 10.2.7. Chemical Industry
- 10.2.8. Other Ap
- 10.1. Market Analysis, Insights and Forecast - by Metal Type
- 11. Middle East and Africa PGM Industry Analysis, Insights and Forecast, 2020-2032
- 11.1. Market Analysis, Insights and Forecast - by Metal Type
- 11.1.1. Platinum
- 11.1.2. Palladium
- 11.1.3. Rhodium
- 11.1.4. Iridium
- 11.1.5. Ruthenium
- 11.1.6. Osmium
- 11.2. Market Analysis, Insights and Forecast - by Application
- 11.2.1. Auto Catalysts
- 11.2.2. Electrical and Electronics
- 11.2.3. Fuel Cells
- 11.2.4. Glass, Ceramics, and Pigments
- 11.2.5. Jewellery
- 11.2.6. Medical (Dental and Pharmaceuticals)
- 11.2.7. Chemical Industry
- 11.2.8. Other Ap
- 11.1. Market Analysis, Insights and Forecast - by Metal Type
- 12. Competitive Analysis
- 12.1. Company Profiles
- 12.1.1 ANGLO AMERICAN PLATINUM LIMITED
- 12.1.1.1. Company Overview
- 12.1.1.2. Products
- 12.1.1.3. Company Financials
- 12.1.1.4. SWOT Analysis
- 12.1.2 Implats Platinum Limited
- 12.1.2.1. Company Overview
- 12.1.2.2. Products
- 12.1.2.3. Company Financials
- 12.1.2.4. SWOT Analysis
- 12.1.3 Vale*List Not Exhaustive
- 12.1.3.1. Company Overview
- 12.1.3.2. Products
- 12.1.3.3. Company Financials
- 12.1.3.4. SWOT Analysis
- 12.1.4 Norilsk Nickel
- 12.1.4.1. Company Overview
- 12.1.4.2. Products
- 12.1.4.3. Company Financials
- 12.1.4.4. SWOT Analysis
- 12.1.5 African Rainbow Minerals Limited
- 12.1.5.1. Company Overview
- 12.1.5.2. Products
- 12.1.5.3. Company Financials
- 12.1.5.4. SWOT Analysis
- 12.1.6 GLENCORE
- 12.1.6.1. Company Overview
- 12.1.6.2. Products
- 12.1.6.3. Company Financials
- 12.1.6.4. SWOT Analysis
- 12.1.7 Northam Platinum Holdings Limited
- 12.1.7.1. Company Overview
- 12.1.7.2. Products
- 12.1.7.3. Company Financials
- 12.1.7.4. SWOT Analysis
- 12.1.8 Johnson Matthey
- 12.1.8.1. Company Overview
- 12.1.8.2. Products
- 12.1.8.3. Company Financials
- 12.1.8.4. SWOT Analysis
- 12.1.9 Sibanye-Stillwater
- 12.1.9.1. Company Overview
- 12.1.9.2. Products
- 12.1.9.3. Company Financials
- 12.1.9.4. SWOT Analysis
- 12.1.10 Platinum Group Metals Ltd
- 12.1.10.1. Company Overview
- 12.1.10.2. Products
- 12.1.10.3. Company Financials
- 12.1.10.4. SWOT Analysis
- 12.1.1 ANGLO AMERICAN PLATINUM LIMITED
- 12.2. Market Entropy
- 12.2.1 Company's Key Areas Served
- 12.2.2 Recent Developments
- 12.3. Company Market Share Analysis 2025
- 12.3.1 Top 5 Companies Market Share Analysis
- 12.3.2 Top 3 Companies Market Share Analysis
- 12.4. List of Potential Customers
- 13. Research Methodology
List of Figures
- Figure 1: Global PGM Industry Revenue Breakdown (billion, %) by Region 2025 & 2033
- Figure 2: Global PGM Industry Volume Breakdown (tons, %) by Region 2025 & 2033
- Figure 3: Asia Pacific PGM Industry Revenue (billion), by Metal Type 2025 & 2033
- Figure 4: Asia Pacific PGM Industry Volume (tons), by Metal Type 2025 & 2033
- Figure 5: Asia Pacific PGM Industry Revenue Share (%), by Metal Type 2025 & 2033
- Figure 6: Asia Pacific PGM Industry Volume Share (%), by Metal Type 2025 & 2033
- Figure 7: Asia Pacific PGM Industry Revenue (billion), by Application 2025 & 2033
- Figure 8: Asia Pacific PGM Industry Volume (tons), by Application 2025 & 2033
- Figure 9: Asia Pacific PGM Industry Revenue Share (%), by Application 2025 & 2033
- Figure 10: Asia Pacific PGM Industry Volume Share (%), by Application 2025 & 2033
- Figure 11: Asia Pacific PGM Industry Revenue (billion), by Country 2025 & 2033
- Figure 12: Asia Pacific PGM Industry Volume (tons), by Country 2025 & 2033
- Figure 13: Asia Pacific PGM Industry Revenue Share (%), by Country 2025 & 2033
- Figure 14: Asia Pacific PGM Industry Volume Share (%), by Country 2025 & 2033
- Figure 15: North America PGM Industry Revenue (billion), by Metal Type 2025 & 2033
- Figure 16: North America PGM Industry Volume (tons), by Metal Type 2025 & 2033
- Figure 17: North America PGM Industry Revenue Share (%), by Metal Type 2025 & 2033
- Figure 18: North America PGM Industry Volume Share (%), by Metal Type 2025 & 2033
- Figure 19: North America PGM Industry Revenue (billion), by Application 2025 & 2033
- Figure 20: North America PGM Industry Volume (tons), by Application 2025 & 2033
- Figure 21: North America PGM Industry Revenue Share (%), by Application 2025 & 2033
- Figure 22: North America PGM Industry Volume Share (%), by Application 2025 & 2033
- Figure 23: North America PGM Industry Revenue (billion), by Country 2025 & 2033
- Figure 24: North America PGM Industry Volume (tons), by Country 2025 & 2033
- Figure 25: North America PGM Industry Revenue Share (%), by Country 2025 & 2033
- Figure 26: North America PGM Industry Volume Share (%), by Country 2025 & 2033
- Figure 27: Europe PGM Industry Revenue (billion), by Metal Type 2025 & 2033
- Figure 28: Europe PGM Industry Volume (tons), by Metal Type 2025 & 2033
- Figure 29: Europe PGM Industry Revenue Share (%), by Metal Type 2025 & 2033
- Figure 30: Europe PGM Industry Volume Share (%), by Metal Type 2025 & 2033
- Figure 31: Europe PGM Industry Revenue (billion), by Application 2025 & 2033
- Figure 32: Europe PGM Industry Volume (tons), by Application 2025 & 2033
- Figure 33: Europe PGM Industry Revenue Share (%), by Application 2025 & 2033
- Figure 34: Europe PGM Industry Volume Share (%), by Application 2025 & 2033
- Figure 35: Europe PGM Industry Revenue (billion), by Country 2025 & 2033
- Figure 36: Europe PGM Industry Volume (tons), by Country 2025 & 2033
- Figure 37: Europe PGM Industry Revenue Share (%), by Country 2025 & 2033
- Figure 38: Europe PGM Industry Volume Share (%), by Country 2025 & 2033
- Figure 39: South America PGM Industry Revenue (billion), by Metal Type 2025 & 2033
- Figure 40: South America PGM Industry Volume (tons), by Metal Type 2025 & 2033
- Figure 41: South America PGM Industry Revenue Share (%), by Metal Type 2025 & 2033
- Figure 42: South America PGM Industry Volume Share (%), by Metal Type 2025 & 2033
- Figure 43: South America PGM Industry Revenue (billion), by Application 2025 & 2033
- Figure 44: South America PGM Industry Volume (tons), by Application 2025 & 2033
- Figure 45: South America PGM Industry Revenue Share (%), by Application 2025 & 2033
- Figure 46: South America PGM Industry Volume Share (%), by Application 2025 & 2033
- Figure 47: South America PGM Industry Revenue (billion), by Country 2025 & 2033
- Figure 48: South America PGM Industry Volume (tons), by Country 2025 & 2033
- Figure 49: South America PGM Industry Revenue Share (%), by Country 2025 & 2033
- Figure 50: South America PGM Industry Volume Share (%), by Country 2025 & 2033
- Figure 51: Middle East and Africa PGM Industry Revenue (billion), by Metal Type 2025 & 2033
- Figure 52: Middle East and Africa PGM Industry Volume (tons), by Metal Type 2025 & 2033
- Figure 53: Middle East and Africa PGM Industry Revenue Share (%), by Metal Type 2025 & 2033
- Figure 54: Middle East and Africa PGM Industry Volume Share (%), by Metal Type 2025 & 2033
- Figure 55: Middle East and Africa PGM Industry Revenue (billion), by Application 2025 & 2033
- Figure 56: Middle East and Africa PGM Industry Volume (tons), by Application 2025 & 2033
- Figure 57: Middle East and Africa PGM Industry Revenue Share (%), by Application 2025 & 2033
- Figure 58: Middle East and Africa PGM Industry Volume Share (%), by Application 2025 & 2033
- Figure 59: Middle East and Africa PGM Industry Revenue (billion), by Country 2025 & 2033
- Figure 60: Middle East and Africa PGM Industry Volume (tons), by Country 2025 & 2033
- Figure 61: Middle East and Africa PGM Industry Revenue Share (%), by Country 2025 & 2033
- Figure 62: Middle East and Africa PGM Industry Volume Share (%), by Country 2025 & 2033
List of Tables
- Table 1: Global PGM Industry Revenue billion Forecast, by Metal Type 2020 & 2033
- Table 2: Global PGM Industry Volume tons Forecast, by Metal Type 2020 & 2033
- Table 3: Global PGM Industry Revenue billion Forecast, by Application 2020 & 2033
- Table 4: Global PGM Industry Volume tons Forecast, by Application 2020 & 2033
- Table 5: Global PGM Industry Revenue billion Forecast, by Region 2020 & 2033
- Table 6: Global PGM Industry Volume tons Forecast, by Region 2020 & 2033
- Table 7: Global PGM Industry Revenue billion Forecast, by Metal Type 2020 & 2033
- Table 8: Global PGM Industry Volume tons Forecast, by Metal Type 2020 & 2033
- Table 9: Global PGM Industry Revenue billion Forecast, by Application 2020 & 2033
- Table 10: Global PGM Industry Volume tons Forecast, by Application 2020 & 2033
- Table 11: Global PGM Industry Revenue billion Forecast, by Country 2020 & 2033
- Table 12: Global PGM Industry Volume tons Forecast, by Country 2020 & 2033
- Table 13: China PGM Industry Revenue (billion) Forecast, by Application 2020 & 2033
- Table 14: China PGM Industry Volume (tons) Forecast, by Application 2020 & 2033
- Table 15: India PGM Industry Revenue (billion) Forecast, by Application 2020 & 2033
- Table 16: India PGM Industry Volume (tons) Forecast, by Application 2020 & 2033
- Table 17: Japan PGM Industry Revenue (billion) Forecast, by Application 2020 & 2033
- Table 18: Japan PGM Industry Volume (tons) Forecast, by Application 2020 & 2033
- Table 19: South Korea PGM Industry Revenue (billion) Forecast, by Application 2020 & 2033
- Table 20: South Korea PGM Industry Volume (tons) Forecast, by Application 2020 & 2033
- Table 21: ASEAN Countries PGM Industry Revenue (billion) Forecast, by Application 2020 & 2033
- Table 22: ASEAN Countries PGM Industry Volume (tons) Forecast, by Application 2020 & 2033
- Table 23: Rest of Asia Pacific PGM Industry Revenue (billion) Forecast, by Application 2020 & 2033
- Table 24: Rest of Asia Pacific PGM Industry Volume (tons) Forecast, by Application 2020 & 2033
- Table 25: Global PGM Industry Revenue billion Forecast, by Metal Type 2020 & 2033
- Table 26: Global PGM Industry Volume tons Forecast, by Metal Type 2020 & 2033
- Table 27: Global PGM Industry Revenue billion Forecast, by Application 2020 & 2033
- Table 28: Global PGM Industry Volume tons Forecast, by Application 2020 & 2033
- Table 29: Global PGM Industry Revenue billion Forecast, by Country 2020 & 2033
- Table 30: Global PGM Industry Volume tons Forecast, by Country 2020 & 2033
- Table 31: United States PGM Industry Revenue (billion) Forecast, by Application 2020 & 2033
- Table 32: United States PGM Industry Volume (tons) Forecast, by Application 2020 & 2033
- Table 33: Canada PGM Industry Revenue (billion) Forecast, by Application 2020 & 2033
- Table 34: Canada PGM Industry Volume (tons) Forecast, by Application 2020 & 2033
- Table 35: Mexico PGM Industry Revenue (billion) Forecast, by Application 2020 & 2033
- Table 36: Mexico PGM Industry Volume (tons) Forecast, by Application 2020 & 2033
- Table 37: Global PGM Industry Revenue billion Forecast, by Metal Type 2020 & 2033
- Table 38: Global PGM Industry Volume tons Forecast, by Metal Type 2020 & 2033
- Table 39: Global PGM Industry Revenue billion Forecast, by Application 2020 & 2033
- Table 40: Global PGM Industry Volume tons Forecast, by Application 2020 & 2033
- Table 41: Global PGM Industry Revenue billion Forecast, by Country 2020 & 2033
- Table 42: Global PGM Industry Volume tons Forecast, by Country 2020 & 2033
- Table 43: Germany PGM Industry Revenue (billion) Forecast, by Application 2020 & 2033
- Table 44: Germany PGM Industry Volume (tons) Forecast, by Application 2020 & 2033
- Table 45: United Kingdom PGM Industry Revenue (billion) Forecast, by Application 2020 & 2033
- Table 46: United Kingdom PGM Industry Volume (tons) Forecast, by Application 2020 & 2033
- Table 47: Italy PGM Industry Revenue (billion) Forecast, by Application 2020 & 2033
- Table 48: Italy PGM Industry Volume (tons) Forecast, by Application 2020 & 2033
- Table 49: France PGM Industry Revenue (billion) Forecast, by Application 2020 & 2033
- Table 50: France PGM Industry Volume (tons) Forecast, by Application 2020 & 2033
- Table 51: Rest of Europe PGM Industry Revenue (billion) Forecast, by Application 2020 & 2033
- Table 52: Rest of Europe PGM Industry Volume (tons) Forecast, by Application 2020 & 2033
- Table 53: Global PGM Industry Revenue billion Forecast, by Metal Type 2020 & 2033
- Table 54: Global PGM Industry Volume tons Forecast, by Metal Type 2020 & 2033
- Table 55: Global PGM Industry Revenue billion Forecast, by Application 2020 & 2033
- Table 56: Global PGM Industry Volume tons Forecast, by Application 2020 & 2033
- Table 57: Global PGM Industry Revenue billion Forecast, by Country 2020 & 2033
- Table 58: Global PGM Industry Volume tons Forecast, by Country 2020 & 2033
- Table 59: Brazil PGM Industry Revenue (billion) Forecast, by Application 2020 & 2033
- Table 60: Brazil PGM Industry Volume (tons) Forecast, by Application 2020 & 2033
- Table 61: Argentina PGM Industry Revenue (billion) Forecast, by Application 2020 & 2033
- Table 62: Argentina PGM Industry Volume (tons) Forecast, by Application 2020 & 2033
- Table 63: Rest of South America PGM Industry Revenue (billion) Forecast, by Application 2020 & 2033
- Table 64: Rest of South America PGM Industry Volume (tons) Forecast, by Application 2020 & 2033
- Table 65: Global PGM Industry Revenue billion Forecast, by Metal Type 2020 & 2033
- Table 66: Global PGM Industry Volume tons Forecast, by Metal Type 2020 & 2033
- Table 67: Global PGM Industry Revenue billion Forecast, by Application 2020 & 2033
- Table 68: Global PGM Industry Volume tons Forecast, by Application 2020 & 2033
- Table 69: Global PGM Industry Revenue billion Forecast, by Country 2020 & 2033
- Table 70: Global PGM Industry Volume tons Forecast, by Country 2020 & 2033
- Table 71: Saudi Arabia PGM Industry Revenue (billion) Forecast, by Application 2020 & 2033
- Table 72: Saudi Arabia PGM Industry Volume (tons) Forecast, by Application 2020 & 2033
- Table 73: South Africa PGM Industry Revenue (billion) Forecast, by Application 2020 & 2033
- Table 74: South Africa PGM Industry Volume (tons) Forecast, by Application 2020 & 2033
- Table 75: Rest of Middle East and Africa PGM Industry Revenue (billion) Forecast, by Application 2020 & 2033
- Table 76: Rest of Middle East and Africa PGM Industry Volume (tons) Forecast, by Application 2020 & 2033
Frequently Asked Questions
1. What is the projected Compound Annual Growth Rate (CAGR) of the PGM Industry?
The projected CAGR is approximately 3.31%.
2. Which companies are prominent players in the PGM Industry?
Key companies in the market include ANGLO AMERICAN PLATINUM LIMITED, Implats Platinum Limited, Vale*List Not Exhaustive, Norilsk Nickel, African Rainbow Minerals Limited, GLENCORE, Northam Platinum Holdings Limited, Johnson Matthey, Sibanye-Stillwater, Platinum Group Metals Ltd.
3. What are the main segments of the PGM Industry?
The market segments include Metal Type, Application.
4. Can you provide details about the market size?
The market size is estimated to be USD 41.59 billion as of 2022.
5. What are some drivers contributing to market growth?
Growing Demand for Catalytic Converters from the Automotive Industry; Increasing Demand for Platinum. Palladium. and Ruthenium from the Electronics Industry; Growing Jewelry Consumption in Asia-Pacific Countries.
6. What are the notable trends driving market growth?
Autocatalysts Segment to Dominate the Market.
7. Are there any restraints impacting market growth?
High Costs Involved in Production and Maintenance; Other Restraints.
8. Can you provide examples of recent developments in the market?
November 2023: Sibanye-Stillwater agreed to acquire Reldan, a metal recycler based in the United States. Reldan is a Pennsylvania-based recycling group that reprocesses various waste streams, including industrial and electronic waste, to recycle green precious metals such as platinum and palladium.
9. What pricing options are available for accessing the report?
Pricing options include single-user, multi-user, and enterprise licenses priced at USD 4750, USD 5250, and USD 8750 respectively.
10. Is the market size provided in terms of value or volume?
The market size is provided in terms of value, measured in billion and volume, measured in tons.
11. Are there any specific market keywords associated with the report?
Yes, the market keyword associated with the report is "PGM Industry," which aids in identifying and referencing the specific market segment covered.
12. How do I determine which pricing option suits my needs best?
The pricing options vary based on user requirements and access needs. Individual users may opt for single-user licenses, while businesses requiring broader access may choose multi-user or enterprise licenses for cost-effective access to the report.
13. Are there any additional resources or data provided in the PGM Industry report?
While the report offers comprehensive insights, it's advisable to review the specific contents or supplementary materials provided to ascertain if additional resources or data are available.
14. How can I stay updated on further developments or reports in the PGM Industry?
To stay informed about further developments, trends, and reports in the PGM Industry, consider subscribing to industry newsletters, following relevant companies and organizations, or regularly checking reputable industry news sources and publications.
Methodology
Step 1 - Identification of Relevant Samples Size from Population Database


Step 2 - Approaches for Defining Global Market Size (Value, Volume* & Price*)

Note*: In applicable scenarios
Step 3 - Data Sources
Primary Research
- Web Analytics
- Survey Reports
- Research Institute
- Latest Research Reports
- Opinion Leaders
Secondary Research
- Annual Reports
- White Paper
- Latest Press Release
- Industry Association
- Paid Database
- Investor Presentations

Step 4 - Data Triangulation
Involves using different sources of information in order to increase the validity of a study
These sources are likely to be stakeholders in a program - participants, other researchers, program staff, other community members, and so on.
Then we put all data in single framework & apply various statistical tools to find out the dynamic on the market.
During the analysis stage, feedback from the stakeholder groups would be compared to determine areas of agreement as well as areas of divergence