

Key Insights
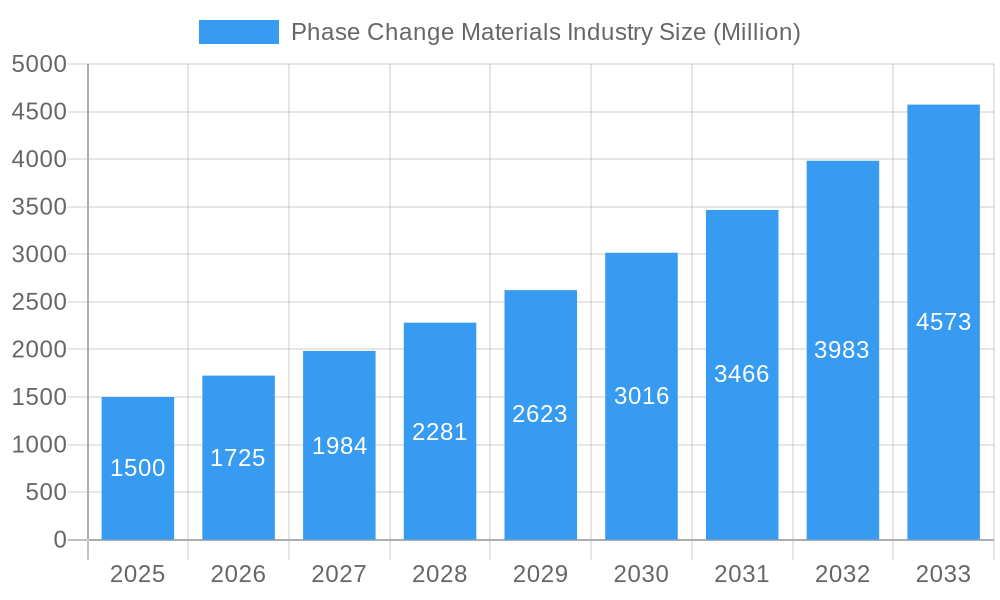
The Phase Change Materials (PCM) market is poised for substantial growth, projected to reach 729.76 million by 2025 and expand at a compound annual growth rate (CAGR) of 17.58% from 2025 to 2033. This expansion is driven by increasing adoption across key sectors. The building and construction industry's integration of PCMs for enhanced energy efficiency, reducing HVAC reliance, is a primary catalyst. The packaging sector's need for effective temperature control in logistics, particularly for temperature-sensitive goods and cold chain management, further fuels demand. Innovations in PCM encapsulation technologies, including micro- and molecular methods, are broadening applications in electronics and textiles for critical thermal management. Despite initial cost considerations and regulatory factors, ongoing R&D promises more cost-effective and adaptable PCM solutions.
Phase Change Materials Industry Market Size (In Million)
Market segmentation highlights significant potential within specific product categories and end-user industries. While organic PCMs lead due to their eco-friendly attributes, inorganic and bio-based PCMs are increasingly favored for their superior thermal performance and cost-effectiveness. Micro-encapsulation technology is experiencing rapid adoption for its application versatility. The building and construction sector remains a dominant end-user, followed by packaging and textiles. Geographically, North America and Europe lead market share, with Asia-Pacific anticipated to exhibit the fastest growth due to industrialization and urbanization. Key market players, including Appvion Inc., Henkel AG & Co KGaA, and Shin-Etsu Chemical Co. Ltd., are driving market dynamics through innovation and strategic collaborations. The forecast indicates sustained market expansion, propelled by technological advancements and escalating environmental consciousness.
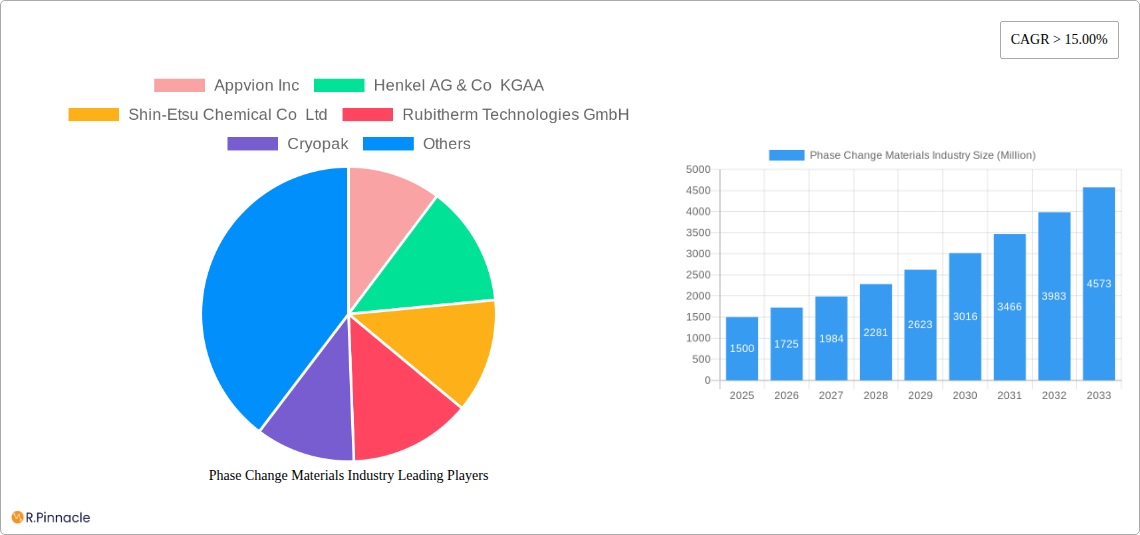
Phase Change Materials Industry Company Market Share
Phase Change Materials (PCM) Industry Market Report: 2019-2033
This comprehensive report provides a detailed analysis of the Phase Change Materials (PCM) industry, offering invaluable insights for industry professionals, investors, and researchers. The study period covers 2019-2033, with 2025 as the base and estimated year, and a forecast period of 2025-2033. The report analyzes a market expected to reach xx Million by 2033, uncovering key trends and growth opportunities within this dynamic sector.
Phase Change Materials Industry Market Structure & Innovation Trends
The Phase Change Materials (PCM) industry is characterized by a moderately concentrated market structure, with several key players holding significant market share. While precise market share figures for each company are proprietary, leading players include Appvion Inc, Henkel AG & Co KGaA, Shin-Etsu Chemical Co Ltd, Rubitherm Technologies GmbH, and Cryopak. These companies are driving innovation through R&D investments, focusing on improving PCM efficiency, developing new encapsulation technologies, and expanding into diverse end-user industries. Recent years have witnessed several M&A activities, with deal values ranging from xx Million to xx Million, further consolidating the market. These acquisitions have primarily focused on enhancing product portfolios and expanding geographical reach.
- Market Concentration: Moderately concentrated, with a few major players dominating.
- Innovation Drivers: R&D investments in efficiency improvements, novel encapsulation technologies, and diverse applications.
- Regulatory Frameworks: Vary across regions, impacting material approvals and sustainability initiatives.
- Product Substitutes: Limited direct substitutes, but alternative thermal management solutions exist.
- End-User Demographics: Diverse, spanning building & construction, packaging, textiles, electronics, and transportation.
- M&A Activity: Significant M&A activity observed, driving market consolidation.
Phase Change Materials Industry Market Dynamics & Trends
The PCM market exhibits robust growth, driven by increasing demand across various end-use sectors. The Compound Annual Growth Rate (CAGR) during the forecast period (2025-2033) is projected to be xx%, fueled by factors such as stringent energy efficiency regulations, growing awareness of sustainable solutions, and technological advancements in PCM encapsulation and application. Market penetration is steadily increasing, particularly in building and construction, where PCMs are being incorporated into insulation materials for enhanced temperature regulation. Technological disruptions, such as the development of bio-based PCMs and improved micro-encapsulation techniques, are further accelerating market growth. The competitive landscape remains dynamic, with companies vying for market share through product innovation, strategic partnerships, and geographical expansion.
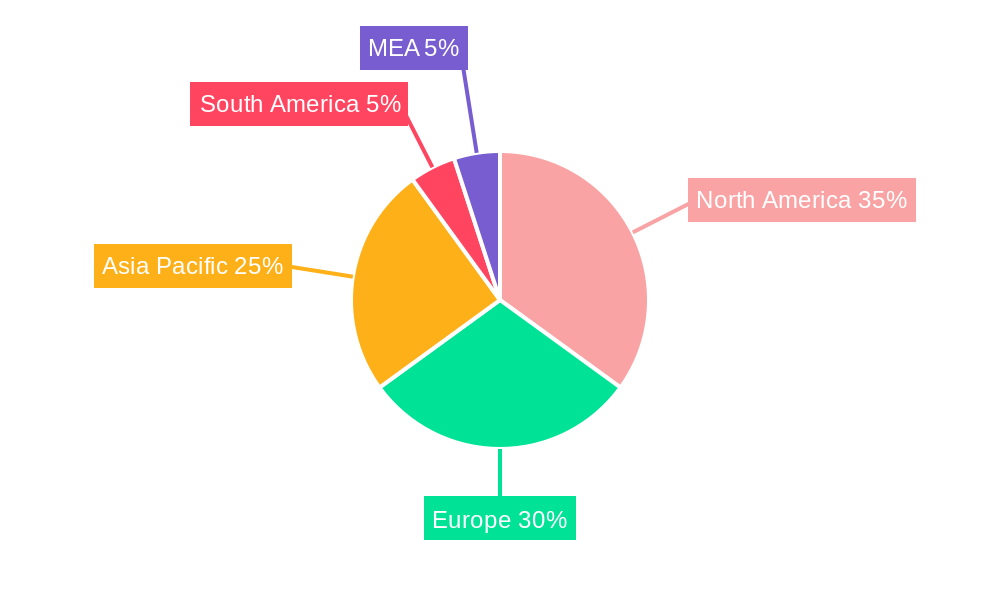
Dominant Regions & Segments in Phase Change Materials Industry
The North American and European regions currently dominate the PCM market, driven by robust construction activity and stringent energy efficiency standards. However, the Asia-Pacific region is expected to witness significant growth in the coming years due to increasing industrialization and rising disposable incomes.
Dominant Segments:
- By Product Type: Organic PCMs currently hold the largest market share, followed by inorganic and bio-based PCMs, which are gaining traction due to their sustainability advantages.
- By Encapsulation Technology: Micro-encapsulation is the dominant technology, offering superior performance and versatility.
- By End-user Industry: The building and construction sector accounts for a significant portion of the market, followed by the packaging and electronics industries.
Key Drivers:
- Economic policies: Government incentives and regulations supporting energy efficiency.
- Infrastructure development: Expansion of building and construction activities globally.
- Technological advancements: Improvements in PCM production, encapsulation, and application.
Phase Change Materials Industry Product Innovations
Recent innovations in the PCM industry focus on developing high-performance, cost-effective, and sustainable PCMs. This includes advancements in micro-encapsulation technologies for improved stability and thermal performance, and the introduction of bio-based PCMs addressing environmental concerns. These innovations cater to the evolving needs of diverse end-user industries, enhancing market competitiveness and penetration. Key features include improved thermal storage capacity, enhanced durability, and eco-friendly formulations.
Report Scope & Segmentation Analysis
This report comprehensively analyzes the PCM market across various segments:
- By Product Type: Organic, Inorganic, Bio-based (Growth projections for each segment will be detailed within the full report).
- By Encapsulation Technology: Macro, Micro, Molecular (Market sizes and competitive dynamics will be detailed within the full report).
- By End-user Industry: Building and Construction, Packaging, Textiles, Electronics, Transportation, Other End-user Industries (Growth projections for each segment will be detailed within the full report).
Key Drivers of Phase Change Materials Industry Growth
The PCM market is driven by several key factors:
- Stringent energy efficiency regulations: Governments worldwide are implementing stricter regulations to reduce energy consumption and carbon emissions.
- Growing demand for sustainable solutions: The increasing emphasis on environmental sustainability is fueling the adoption of eco-friendly PCMs.
- Technological advancements: Continuous innovations in PCM production and application are enhancing their performance and expanding their applications.
Challenges in the Phase Change Materials Industry Sector
The PCM industry faces several challenges:
- High initial investment costs: The implementation of PCM technologies can be expensive, especially in large-scale projects.
- Supply chain constraints: The availability of raw materials and specialized manufacturing capabilities can impact production and supply.
- Competition from alternative technologies: PCM technologies face competition from other thermal management solutions.
Emerging Opportunities in Phase Change Materials Industry
Emerging opportunities for the PCM industry include:
- Expansion into new markets: Growing demand in sectors like healthcare and aerospace presents significant market expansion potential.
- Development of novel applications: PCM technology finds application in areas such as thermal energy storage and waste heat recovery.
- Integration with smart building technologies: PCM integration into smart building systems optimizes energy efficiency and control.
Leading Players in the Phase Change Materials Industry Market
- Appvion Inc
- Henkel AG & Co KGaA
- Shin-Etsu Chemical Co Ltd
- Rubitherm Technologies GmbH
- Cryopak
- Microtek Laboratories Inc
- Croda International Plc
- Outlast Technologies LLC
- Entropy Solution
- Shenzhen Aochuan Technology Co Ltd
- Laird Technologies
- National Gypsum Services Company
- Parker Hannifin Corp
Key Developments in Phase Change Materials Industry
- September 2022: Sinomax USA launched Bio Frost, the first bio-based PCM in foam bedding, offering a sustainable cooling solution.
- October 2022: Shanghai Polytechnic University developed efficient phase change microcapsules for enhanced solar energy storage.
Future Outlook for Phase Change Materials Industry Market
The PCM market is poised for significant growth, driven by increasing demand for energy-efficient and sustainable solutions. Strategic investments in R&D, partnerships, and expansion into emerging markets will be crucial for companies to capitalize on the substantial market potential. The development of innovative PCM applications and the integration of PCM technologies into smart systems will further drive market expansion and growth.
Phase Change Materials Industry Segmentation
-
1. Product Type
- 1.1. Organic
- 1.2. Inorganic
- 1.3. Bio-based
-
2. Encapsulation Technology
- 2.1. Macro
- 2.2. Micro
- 2.3. Molecular
-
3. End-user Industry
- 3.1. Building and Construction
- 3.2. Packaging
- 3.3. Textiles
- 3.4. Electronics
- 3.5. Transportation
- 3.6. Other End-user Industries
Phase Change Materials Industry Segmentation By Geography
-
1. Asia Pacific
- 1.1. China
- 1.2. India
- 1.3. Japan
- 1.4. South Korea
- 1.5. Rest of Asia Pacific
-
2. North America
- 2.1. United States
- 2.2. Canada
- 2.3. Mexico
-
3. Europe
- 3.1. Germany
- 3.2. United Kingdom
- 3.3. Italy
- 3.4. France
- 3.5. Rest of Europe
-
4. Rest of the World
- 4.1. Brazil
- 4.2. Saudi Arabia
- 4.3. South Africa
- 4.4. Other Countries
Phase Change Materials Industry Regional Market Share
Geographic Coverage of Phase Change Materials Industry
Phase Change Materials Industry REPORT HIGHLIGHTS
| Aspects | Details |
|---|---|
| Study Period | 2020-2034 |
| Base Year | 2025 |
| Estimated Year | 2026 |
| Forecast Period | 2026-2034 |
| Historical Period | 2020-2025 |
| Growth Rate | CAGR of 17.58% from 2020-2034 |
| Segmentation |
|
Table of Contents
- 1. Introduction
- 1.1. Research Scope
- 1.2. Market Segmentation
- 1.3. Research Objective
- 1.4. Definitions and Assumptions
- 2. Executive Summary
- 2.1. Market Snapshot
- 3. Market Dynamics
- 3.1. Market Drivers
- 3.2. Market Restrains
- 3.3. Market Trends
- 3.4. Market Opportunities
- 4. Market Factor Analysis
- 4.1. Porters Five Forces
- 4.1.1. Bargaining Power of Suppliers
- 4.1.2. Bargaining Power of Buyers
- 4.1.3. Threat of New Entrants
- 4.1.4. Threat of Substitutes
- 4.1.5. Competitive Rivalry
- 4.2. PESTEL analysis
- 4.3. BCG Analysis
- 4.3.1. Stars (High Growth, High Market Share)
- 4.3.2. Cash Cows (Low Growth, High Market Share)
- 4.3.3. Question Mark (High Growth, Low Market Share)
- 4.3.4. Dogs (Low Growth, Low Market Share)
- 4.4. Ansoff Matrix Analysis
- 4.5. Supply Chain Analysis
- 4.6. Regulatory Landscape
- 4.7. Current Market Potential and Opportunity Assessment (TAM–SAM–SOM Framework)
- 4.8. PRI Analyst Note
- 4.1. Porters Five Forces
- 5. Market Analysis, Insights and Forecast 2021-2033
- 5.1. Market Analysis, Insights and Forecast - by Product Type
- 5.1.1. Organic
- 5.1.2. Inorganic
- 5.1.3. Bio-based
- 5.2. Market Analysis, Insights and Forecast - by Encapsulation Technology
- 5.2.1. Macro
- 5.2.2. Micro
- 5.2.3. Molecular
- 5.3. Market Analysis, Insights and Forecast - by End-user Industry
- 5.3.1. Building and Construction
- 5.3.2. Packaging
- 5.3.3. Textiles
- 5.3.4. Electronics
- 5.3.5. Transportation
- 5.3.6. Other End-user Industries
- 5.4. Market Analysis, Insights and Forecast - by Region
- 5.4.1. Asia Pacific
- 5.4.2. North America
- 5.4.3. Europe
- 5.4.4. Rest of the World
- 5.1. Market Analysis, Insights and Forecast - by Product Type
- 6. Global Phase Change Materials Industry Analysis, Insights and Forecast, 2021-2033
- 6.1. Market Analysis, Insights and Forecast - by Product Type
- 6.1.1. Organic
- 6.1.2. Inorganic
- 6.1.3. Bio-based
- 6.2. Market Analysis, Insights and Forecast - by Encapsulation Technology
- 6.2.1. Macro
- 6.2.2. Micro
- 6.2.3. Molecular
- 6.3. Market Analysis, Insights and Forecast - by End-user Industry
- 6.3.1. Building and Construction
- 6.3.2. Packaging
- 6.3.3. Textiles
- 6.3.4. Electronics
- 6.3.5. Transportation
- 6.3.6. Other End-user Industries
- 6.1. Market Analysis, Insights and Forecast - by Product Type
- 7. Asia Pacific Phase Change Materials Industry Analysis, Insights and Forecast, 2020-2032
- 7.1. Market Analysis, Insights and Forecast - by Product Type
- 7.1.1. Organic
- 7.1.2. Inorganic
- 7.1.3. Bio-based
- 7.2. Market Analysis, Insights and Forecast - by Encapsulation Technology
- 7.2.1. Macro
- 7.2.2. Micro
- 7.2.3. Molecular
- 7.3. Market Analysis, Insights and Forecast - by End-user Industry
- 7.3.1. Building and Construction
- 7.3.2. Packaging
- 7.3.3. Textiles
- 7.3.4. Electronics
- 7.3.5. Transportation
- 7.3.6. Other End-user Industries
- 7.1. Market Analysis, Insights and Forecast - by Product Type
- 8. North America Phase Change Materials Industry Analysis, Insights and Forecast, 2020-2032
- 8.1. Market Analysis, Insights and Forecast - by Product Type
- 8.1.1. Organic
- 8.1.2. Inorganic
- 8.1.3. Bio-based
- 8.2. Market Analysis, Insights and Forecast - by Encapsulation Technology
- 8.2.1. Macro
- 8.2.2. Micro
- 8.2.3. Molecular
- 8.3. Market Analysis, Insights and Forecast - by End-user Industry
- 8.3.1. Building and Construction
- 8.3.2. Packaging
- 8.3.3. Textiles
- 8.3.4. Electronics
- 8.3.5. Transportation
- 8.3.6. Other End-user Industries
- 8.1. Market Analysis, Insights and Forecast - by Product Type
- 9. Europe Phase Change Materials Industry Analysis, Insights and Forecast, 2020-2032
- 9.1. Market Analysis, Insights and Forecast - by Product Type
- 9.1.1. Organic
- 9.1.2. Inorganic
- 9.1.3. Bio-based
- 9.2. Market Analysis, Insights and Forecast - by Encapsulation Technology
- 9.2.1. Macro
- 9.2.2. Micro
- 9.2.3. Molecular
- 9.3. Market Analysis, Insights and Forecast - by End-user Industry
- 9.3.1. Building and Construction
- 9.3.2. Packaging
- 9.3.3. Textiles
- 9.3.4. Electronics
- 9.3.5. Transportation
- 9.3.6. Other End-user Industries
- 9.1. Market Analysis, Insights and Forecast - by Product Type
- 10. Rest of the World Phase Change Materials Industry Analysis, Insights and Forecast, 2020-2032
- 10.1. Market Analysis, Insights and Forecast - by Product Type
- 10.1.1. Organic
- 10.1.2. Inorganic
- 10.1.3. Bio-based
- 10.2. Market Analysis, Insights and Forecast - by Encapsulation Technology
- 10.2.1. Macro
- 10.2.2. Micro
- 10.2.3. Molecular
- 10.3. Market Analysis, Insights and Forecast - by End-user Industry
- 10.3.1. Building and Construction
- 10.3.2. Packaging
- 10.3.3. Textiles
- 10.3.4. Electronics
- 10.3.5. Transportation
- 10.3.6. Other End-user Industries
- 10.1. Market Analysis, Insights and Forecast - by Product Type
- 11. Competitive Analysis
- 11.1. Company Profiles
- 11.1.1 Appvion Inc
- 11.1.1.1. Company Overview
- 11.1.1.2. Products
- 11.1.1.3. Company Financials
- 11.1.1.4. SWOT Analysis
- 11.1.2 Henkel AG & Co KGAA
- 11.1.2.1. Company Overview
- 11.1.2.2. Products
- 11.1.2.3. Company Financials
- 11.1.2.4. SWOT Analysis
- 11.1.3 Shin-Etsu Chemical Co Ltd
- 11.1.3.1. Company Overview
- 11.1.3.2. Products
- 11.1.3.3. Company Financials
- 11.1.3.4. SWOT Analysis
- 11.1.4 Rubitherm Technologies GmbH
- 11.1.4.1. Company Overview
- 11.1.4.2. Products
- 11.1.4.3. Company Financials
- 11.1.4.4. SWOT Analysis
- 11.1.5 Cryopak
- 11.1.5.1. Company Overview
- 11.1.5.2. Products
- 11.1.5.3. Company Financials
- 11.1.5.4. SWOT Analysis
- 11.1.6 Microtek Laboratories Inc
- 11.1.6.1. Company Overview
- 11.1.6.2. Products
- 11.1.6.3. Company Financials
- 11.1.6.4. SWOT Analysis
- 11.1.7 Croda International Plc
- 11.1.7.1. Company Overview
- 11.1.7.2. Products
- 11.1.7.3. Company Financials
- 11.1.7.4. SWOT Analysis
- 11.1.8 Outlast Technologies LLC
- 11.1.8.1. Company Overview
- 11.1.8.2. Products
- 11.1.8.3. Company Financials
- 11.1.8.4. SWOT Analysis
- 11.1.9 Entropy Solution
- 11.1.9.1. Company Overview
- 11.1.9.2. Products
- 11.1.9.3. Company Financials
- 11.1.9.4. SWOT Analysis
- 11.1.10 Shenzhen Aochuan Technology Co Ltd
- 11.1.10.1. Company Overview
- 11.1.10.2. Products
- 11.1.10.3. Company Financials
- 11.1.10.4. SWOT Analysis
- 11.1.11 Laird Technologies
- 11.1.11.1. Company Overview
- 11.1.11.2. Products
- 11.1.11.3. Company Financials
- 11.1.11.4. SWOT Analysis
- 11.1.12 National Gypsum Services Company
- 11.1.12.1. Company Overview
- 11.1.12.2. Products
- 11.1.12.3. Company Financials
- 11.1.12.4. SWOT Analysis
- 11.1.13 Parker Hannifin Corp
- 11.1.13.1. Company Overview
- 11.1.13.2. Products
- 11.1.13.3. Company Financials
- 11.1.13.4. SWOT Analysis
- 11.1.1 Appvion Inc
- 11.2. Market Entropy
- 11.2.1 Company's Key Areas Served
- 11.2.2 Recent Developments
- 11.3. Company Market Share Analysis 2025
- 11.3.1 Top 5 Companies Market Share Analysis
- 11.3.2 Top 3 Companies Market Share Analysis
- 11.4. List of Potential Customers
- 12. Research Methodology
List of Figures
- Figure 1: Global Phase Change Materials Industry Revenue Breakdown (million, %) by Region 2025 & 2033
- Figure 2: Global Phase Change Materials Industry Volume Breakdown (K Tons, %) by Region 2025 & 2033
- Figure 3: Asia Pacific Phase Change Materials Industry Revenue (million), by Product Type 2025 & 2033
- Figure 4: Asia Pacific Phase Change Materials Industry Volume (K Tons), by Product Type 2025 & 2033
- Figure 5: Asia Pacific Phase Change Materials Industry Revenue Share (%), by Product Type 2025 & 2033
- Figure 6: Asia Pacific Phase Change Materials Industry Volume Share (%), by Product Type 2025 & 2033
- Figure 7: Asia Pacific Phase Change Materials Industry Revenue (million), by Encapsulation Technology 2025 & 2033
- Figure 8: Asia Pacific Phase Change Materials Industry Volume (K Tons), by Encapsulation Technology 2025 & 2033
- Figure 9: Asia Pacific Phase Change Materials Industry Revenue Share (%), by Encapsulation Technology 2025 & 2033
- Figure 10: Asia Pacific Phase Change Materials Industry Volume Share (%), by Encapsulation Technology 2025 & 2033
- Figure 11: Asia Pacific Phase Change Materials Industry Revenue (million), by End-user Industry 2025 & 2033
- Figure 12: Asia Pacific Phase Change Materials Industry Volume (K Tons), by End-user Industry 2025 & 2033
- Figure 13: Asia Pacific Phase Change Materials Industry Revenue Share (%), by End-user Industry 2025 & 2033
- Figure 14: Asia Pacific Phase Change Materials Industry Volume Share (%), by End-user Industry 2025 & 2033
- Figure 15: Asia Pacific Phase Change Materials Industry Revenue (million), by Country 2025 & 2033
- Figure 16: Asia Pacific Phase Change Materials Industry Volume (K Tons), by Country 2025 & 2033
- Figure 17: Asia Pacific Phase Change Materials Industry Revenue Share (%), by Country 2025 & 2033
- Figure 18: Asia Pacific Phase Change Materials Industry Volume Share (%), by Country 2025 & 2033
- Figure 19: North America Phase Change Materials Industry Revenue (million), by Product Type 2025 & 2033
- Figure 20: North America Phase Change Materials Industry Volume (K Tons), by Product Type 2025 & 2033
- Figure 21: North America Phase Change Materials Industry Revenue Share (%), by Product Type 2025 & 2033
- Figure 22: North America Phase Change Materials Industry Volume Share (%), by Product Type 2025 & 2033
- Figure 23: North America Phase Change Materials Industry Revenue (million), by Encapsulation Technology 2025 & 2033
- Figure 24: North America Phase Change Materials Industry Volume (K Tons), by Encapsulation Technology 2025 & 2033
- Figure 25: North America Phase Change Materials Industry Revenue Share (%), by Encapsulation Technology 2025 & 2033
- Figure 26: North America Phase Change Materials Industry Volume Share (%), by Encapsulation Technology 2025 & 2033
- Figure 27: North America Phase Change Materials Industry Revenue (million), by End-user Industry 2025 & 2033
- Figure 28: North America Phase Change Materials Industry Volume (K Tons), by End-user Industry 2025 & 2033
- Figure 29: North America Phase Change Materials Industry Revenue Share (%), by End-user Industry 2025 & 2033
- Figure 30: North America Phase Change Materials Industry Volume Share (%), by End-user Industry 2025 & 2033
- Figure 31: North America Phase Change Materials Industry Revenue (million), by Country 2025 & 2033
- Figure 32: North America Phase Change Materials Industry Volume (K Tons), by Country 2025 & 2033
- Figure 33: North America Phase Change Materials Industry Revenue Share (%), by Country 2025 & 2033
- Figure 34: North America Phase Change Materials Industry Volume Share (%), by Country 2025 & 2033
- Figure 35: Europe Phase Change Materials Industry Revenue (million), by Product Type 2025 & 2033
- Figure 36: Europe Phase Change Materials Industry Volume (K Tons), by Product Type 2025 & 2033
- Figure 37: Europe Phase Change Materials Industry Revenue Share (%), by Product Type 2025 & 2033
- Figure 38: Europe Phase Change Materials Industry Volume Share (%), by Product Type 2025 & 2033
- Figure 39: Europe Phase Change Materials Industry Revenue (million), by Encapsulation Technology 2025 & 2033
- Figure 40: Europe Phase Change Materials Industry Volume (K Tons), by Encapsulation Technology 2025 & 2033
- Figure 41: Europe Phase Change Materials Industry Revenue Share (%), by Encapsulation Technology 2025 & 2033
- Figure 42: Europe Phase Change Materials Industry Volume Share (%), by Encapsulation Technology 2025 & 2033
- Figure 43: Europe Phase Change Materials Industry Revenue (million), by End-user Industry 2025 & 2033
- Figure 44: Europe Phase Change Materials Industry Volume (K Tons), by End-user Industry 2025 & 2033
- Figure 45: Europe Phase Change Materials Industry Revenue Share (%), by End-user Industry 2025 & 2033
- Figure 46: Europe Phase Change Materials Industry Volume Share (%), by End-user Industry 2025 & 2033
- Figure 47: Europe Phase Change Materials Industry Revenue (million), by Country 2025 & 2033
- Figure 48: Europe Phase Change Materials Industry Volume (K Tons), by Country 2025 & 2033
- Figure 49: Europe Phase Change Materials Industry Revenue Share (%), by Country 2025 & 2033
- Figure 50: Europe Phase Change Materials Industry Volume Share (%), by Country 2025 & 2033
- Figure 51: Rest of the World Phase Change Materials Industry Revenue (million), by Product Type 2025 & 2033
- Figure 52: Rest of the World Phase Change Materials Industry Volume (K Tons), by Product Type 2025 & 2033
- Figure 53: Rest of the World Phase Change Materials Industry Revenue Share (%), by Product Type 2025 & 2033
- Figure 54: Rest of the World Phase Change Materials Industry Volume Share (%), by Product Type 2025 & 2033
- Figure 55: Rest of the World Phase Change Materials Industry Revenue (million), by Encapsulation Technology 2025 & 2033
- Figure 56: Rest of the World Phase Change Materials Industry Volume (K Tons), by Encapsulation Technology 2025 & 2033
- Figure 57: Rest of the World Phase Change Materials Industry Revenue Share (%), by Encapsulation Technology 2025 & 2033
- Figure 58: Rest of the World Phase Change Materials Industry Volume Share (%), by Encapsulation Technology 2025 & 2033
- Figure 59: Rest of the World Phase Change Materials Industry Revenue (million), by End-user Industry 2025 & 2033
- Figure 60: Rest of the World Phase Change Materials Industry Volume (K Tons), by End-user Industry 2025 & 2033
- Figure 61: Rest of the World Phase Change Materials Industry Revenue Share (%), by End-user Industry 2025 & 2033
- Figure 62: Rest of the World Phase Change Materials Industry Volume Share (%), by End-user Industry 2025 & 2033
- Figure 63: Rest of the World Phase Change Materials Industry Revenue (million), by Country 2025 & 2033
- Figure 64: Rest of the World Phase Change Materials Industry Volume (K Tons), by Country 2025 & 2033
- Figure 65: Rest of the World Phase Change Materials Industry Revenue Share (%), by Country 2025 & 2033
- Figure 66: Rest of the World Phase Change Materials Industry Volume Share (%), by Country 2025 & 2033
List of Tables
- Table 1: Global Phase Change Materials Industry Revenue million Forecast, by Product Type 2020 & 2033
- Table 2: Global Phase Change Materials Industry Volume K Tons Forecast, by Product Type 2020 & 2033
- Table 3: Global Phase Change Materials Industry Revenue million Forecast, by Encapsulation Technology 2020 & 2033
- Table 4: Global Phase Change Materials Industry Volume K Tons Forecast, by Encapsulation Technology 2020 & 2033
- Table 5: Global Phase Change Materials Industry Revenue million Forecast, by End-user Industry 2020 & 2033
- Table 6: Global Phase Change Materials Industry Volume K Tons Forecast, by End-user Industry 2020 & 2033
- Table 7: Global Phase Change Materials Industry Revenue million Forecast, by Region 2020 & 2033
- Table 8: Global Phase Change Materials Industry Volume K Tons Forecast, by Region 2020 & 2033
- Table 9: Global Phase Change Materials Industry Revenue million Forecast, by Product Type 2020 & 2033
- Table 10: Global Phase Change Materials Industry Volume K Tons Forecast, by Product Type 2020 & 2033
- Table 11: Global Phase Change Materials Industry Revenue million Forecast, by Encapsulation Technology 2020 & 2033
- Table 12: Global Phase Change Materials Industry Volume K Tons Forecast, by Encapsulation Technology 2020 & 2033
- Table 13: Global Phase Change Materials Industry Revenue million Forecast, by End-user Industry 2020 & 2033
- Table 14: Global Phase Change Materials Industry Volume K Tons Forecast, by End-user Industry 2020 & 2033
- Table 15: Global Phase Change Materials Industry Revenue million Forecast, by Country 2020 & 2033
- Table 16: Global Phase Change Materials Industry Volume K Tons Forecast, by Country 2020 & 2033
- Table 17: China Phase Change Materials Industry Revenue (million) Forecast, by Application 2020 & 2033
- Table 18: China Phase Change Materials Industry Volume (K Tons) Forecast, by Application 2020 & 2033
- Table 19: India Phase Change Materials Industry Revenue (million) Forecast, by Application 2020 & 2033
- Table 20: India Phase Change Materials Industry Volume (K Tons) Forecast, by Application 2020 & 2033
- Table 21: Japan Phase Change Materials Industry Revenue (million) Forecast, by Application 2020 & 2033
- Table 22: Japan Phase Change Materials Industry Volume (K Tons) Forecast, by Application 2020 & 2033
- Table 23: South Korea Phase Change Materials Industry Revenue (million) Forecast, by Application 2020 & 2033
- Table 24: South Korea Phase Change Materials Industry Volume (K Tons) Forecast, by Application 2020 & 2033
- Table 25: Rest of Asia Pacific Phase Change Materials Industry Revenue (million) Forecast, by Application 2020 & 2033
- Table 26: Rest of Asia Pacific Phase Change Materials Industry Volume (K Tons) Forecast, by Application 2020 & 2033
- Table 27: Global Phase Change Materials Industry Revenue million Forecast, by Product Type 2020 & 2033
- Table 28: Global Phase Change Materials Industry Volume K Tons Forecast, by Product Type 2020 & 2033
- Table 29: Global Phase Change Materials Industry Revenue million Forecast, by Encapsulation Technology 2020 & 2033
- Table 30: Global Phase Change Materials Industry Volume K Tons Forecast, by Encapsulation Technology 2020 & 2033
- Table 31: Global Phase Change Materials Industry Revenue million Forecast, by End-user Industry 2020 & 2033
- Table 32: Global Phase Change Materials Industry Volume K Tons Forecast, by End-user Industry 2020 & 2033
- Table 33: Global Phase Change Materials Industry Revenue million Forecast, by Country 2020 & 2033
- Table 34: Global Phase Change Materials Industry Volume K Tons Forecast, by Country 2020 & 2033
- Table 35: United States Phase Change Materials Industry Revenue (million) Forecast, by Application 2020 & 2033
- Table 36: United States Phase Change Materials Industry Volume (K Tons) Forecast, by Application 2020 & 2033
- Table 37: Canada Phase Change Materials Industry Revenue (million) Forecast, by Application 2020 & 2033
- Table 38: Canada Phase Change Materials Industry Volume (K Tons) Forecast, by Application 2020 & 2033
- Table 39: Mexico Phase Change Materials Industry Revenue (million) Forecast, by Application 2020 & 2033
- Table 40: Mexico Phase Change Materials Industry Volume (K Tons) Forecast, by Application 2020 & 2033
- Table 41: Global Phase Change Materials Industry Revenue million Forecast, by Product Type 2020 & 2033
- Table 42: Global Phase Change Materials Industry Volume K Tons Forecast, by Product Type 2020 & 2033
- Table 43: Global Phase Change Materials Industry Revenue million Forecast, by Encapsulation Technology 2020 & 2033
- Table 44: Global Phase Change Materials Industry Volume K Tons Forecast, by Encapsulation Technology 2020 & 2033
- Table 45: Global Phase Change Materials Industry Revenue million Forecast, by End-user Industry 2020 & 2033
- Table 46: Global Phase Change Materials Industry Volume K Tons Forecast, by End-user Industry 2020 & 2033
- Table 47: Global Phase Change Materials Industry Revenue million Forecast, by Country 2020 & 2033
- Table 48: Global Phase Change Materials Industry Volume K Tons Forecast, by Country 2020 & 2033
- Table 49: Germany Phase Change Materials Industry Revenue (million) Forecast, by Application 2020 & 2033
- Table 50: Germany Phase Change Materials Industry Volume (K Tons) Forecast, by Application 2020 & 2033
- Table 51: United Kingdom Phase Change Materials Industry Revenue (million) Forecast, by Application 2020 & 2033
- Table 52: United Kingdom Phase Change Materials Industry Volume (K Tons) Forecast, by Application 2020 & 2033
- Table 53: Italy Phase Change Materials Industry Revenue (million) Forecast, by Application 2020 & 2033
- Table 54: Italy Phase Change Materials Industry Volume (K Tons) Forecast, by Application 2020 & 2033
- Table 55: France Phase Change Materials Industry Revenue (million) Forecast, by Application 2020 & 2033
- Table 56: France Phase Change Materials Industry Volume (K Tons) Forecast, by Application 2020 & 2033
- Table 57: Rest of Europe Phase Change Materials Industry Revenue (million) Forecast, by Application 2020 & 2033
- Table 58: Rest of Europe Phase Change Materials Industry Volume (K Tons) Forecast, by Application 2020 & 2033
- Table 59: Global Phase Change Materials Industry Revenue million Forecast, by Product Type 2020 & 2033
- Table 60: Global Phase Change Materials Industry Volume K Tons Forecast, by Product Type 2020 & 2033
- Table 61: Global Phase Change Materials Industry Revenue million Forecast, by Encapsulation Technology 2020 & 2033
- Table 62: Global Phase Change Materials Industry Volume K Tons Forecast, by Encapsulation Technology 2020 & 2033
- Table 63: Global Phase Change Materials Industry Revenue million Forecast, by End-user Industry 2020 & 2033
- Table 64: Global Phase Change Materials Industry Volume K Tons Forecast, by End-user Industry 2020 & 2033
- Table 65: Global Phase Change Materials Industry Revenue million Forecast, by Country 2020 & 2033
- Table 66: Global Phase Change Materials Industry Volume K Tons Forecast, by Country 2020 & 2033
- Table 67: Brazil Phase Change Materials Industry Revenue (million) Forecast, by Application 2020 & 2033
- Table 68: Brazil Phase Change Materials Industry Volume (K Tons) Forecast, by Application 2020 & 2033
- Table 69: Saudi Arabia Phase Change Materials Industry Revenue (million) Forecast, by Application 2020 & 2033
- Table 70: Saudi Arabia Phase Change Materials Industry Volume (K Tons) Forecast, by Application 2020 & 2033
- Table 71: South Africa Phase Change Materials Industry Revenue (million) Forecast, by Application 2020 & 2033
- Table 72: South Africa Phase Change Materials Industry Volume (K Tons) Forecast, by Application 2020 & 2033
- Table 73: Other Countries Phase Change Materials Industry Revenue (million) Forecast, by Application 2020 & 2033
- Table 74: Other Countries Phase Change Materials Industry Volume (K Tons) Forecast, by Application 2020 & 2033
Frequently Asked Questions
1. What is the projected Compound Annual Growth Rate (CAGR) of the Phase Change Materials Industry?
The projected CAGR is approximately 17.58%.
2. Which companies are prominent players in the Phase Change Materials Industry?
Key companies in the market include Appvion Inc, Henkel AG & Co KGAA, Shin-Etsu Chemical Co Ltd, Rubitherm Technologies GmbH, Cryopak, Microtek Laboratories Inc, Croda International Plc, Outlast Technologies LLC, Entropy Solution, Shenzhen Aochuan Technology Co Ltd, Laird Technologies, National Gypsum Services Company, Parker Hannifin Corp.
3. What are the main segments of the Phase Change Materials Industry?
The market segments include Product Type, Encapsulation Technology, End-user Industry.
4. Can you provide details about the market size?
The market size is estimated to be USD 729.76 million as of 2022.
5. What are some drivers contributing to market growth?
Expanding Global Trend Towards Energy Conservation and Sustainable Development; Other Drivers.
6. What are the notable trends driving market growth?
Building and Construction Industry to Dominate the Market.
7. Are there any restraints impacting market growth?
Hazardous Nature of Phase Change Materials; Other Restraints.
8. Can you provide examples of recent developments in the market?
October 2022: Shanghai Polytechnic University researchers announced the development of a new efficient phase change microcapsules for storing solar energy. The newly designed microcapsule demonstrated enhanced heat transfer, storage properties, and high-performance photothermal conversion.
9. What pricing options are available for accessing the report?
Pricing options include single-user, multi-user, and enterprise licenses priced at USD 4750, USD 5250, and USD 8750 respectively.
10. Is the market size provided in terms of value or volume?
The market size is provided in terms of value, measured in million and volume, measured in K Tons.
11. Are there any specific market keywords associated with the report?
Yes, the market keyword associated with the report is "Phase Change Materials Industry," which aids in identifying and referencing the specific market segment covered.
12. How do I determine which pricing option suits my needs best?
The pricing options vary based on user requirements and access needs. Individual users may opt for single-user licenses, while businesses requiring broader access may choose multi-user or enterprise licenses for cost-effective access to the report.
13. Are there any additional resources or data provided in the Phase Change Materials Industry report?
While the report offers comprehensive insights, it's advisable to review the specific contents or supplementary materials provided to ascertain if additional resources or data are available.
14. How can I stay updated on further developments or reports in the Phase Change Materials Industry?
To stay informed about further developments, trends, and reports in the Phase Change Materials Industry, consider subscribing to industry newsletters, following relevant companies and organizations, or regularly checking reputable industry news sources and publications.
Methodology
Step 1 - Identification of Relevant Samples Size from Population Database


Step 2 - Approaches for Defining Global Market Size (Value, Volume* & Price*)

Note*: In applicable scenarios
Step 3 - Data Sources
Primary Research
- Web Analytics
- Survey Reports
- Research Institute
- Latest Research Reports
- Opinion Leaders
Secondary Research
- Annual Reports
- White Paper
- Latest Press Release
- Industry Association
- Paid Database
- Investor Presentations

Step 4 - Data Triangulation
Involves using different sources of information in order to increase the validity of a study
These sources are likely to be stakeholders in a program - participants, other researchers, program staff, other community members, and so on.
Then we put all data in single framework & apply various statistical tools to find out the dynamic on the market.
During the analysis stage, feedback from the stakeholder groups would be compared to determine areas of agreement as well as areas of divergence