


Key Insights
The global phosphatic fertilizer market, projected at $14.46 billion in 2025, is set for robust expansion, with an anticipated Compound Annual Growth Rate (CAGR) of 8.15% from 2025 to 2033. This growth is underpinned by increasing global population and the subsequent demand for enhanced agricultural output to ensure food security. The adoption of intensive farming and precision agriculture, particularly in emerging economies, is also a key driver, boosting the need for phosphatic fertilizers to optimize crop yields. Government initiatives supporting sustainable agriculture and agricultural infrastructure development further contribute to market dynamics. However, challenges persist, including fluctuating raw material prices, environmental concerns from phosphorus runoff, and the potential for nutrient source substitution. The fertigation application mode is expected to capture a significant share due to its efficiency and cost-effectiveness. Field crops currently lead in consumption, with horticultural crops projected for faster growth driven by rising demand for high-value produce. Leading players such as Coromandel International Ltd, PhosAgro, and Koch Industries are influencing the market through strategic expansions and technological advancements. Regional growth will be shaped by agricultural practices, economic development, and policy, with Asia-Pacific and North America anticipated to lead due to their substantial agricultural sectors and high fertilizer utilization.
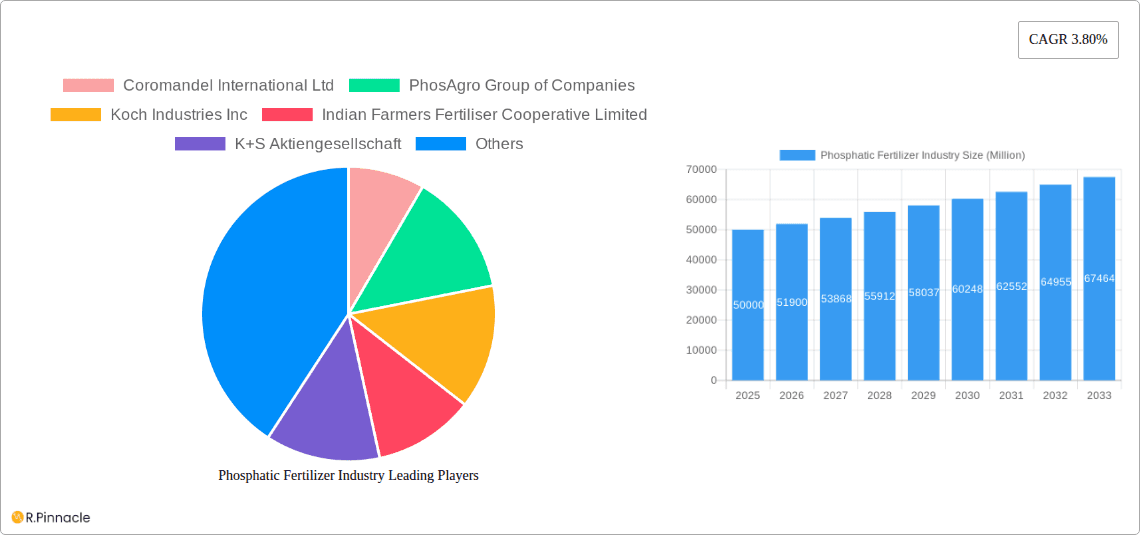
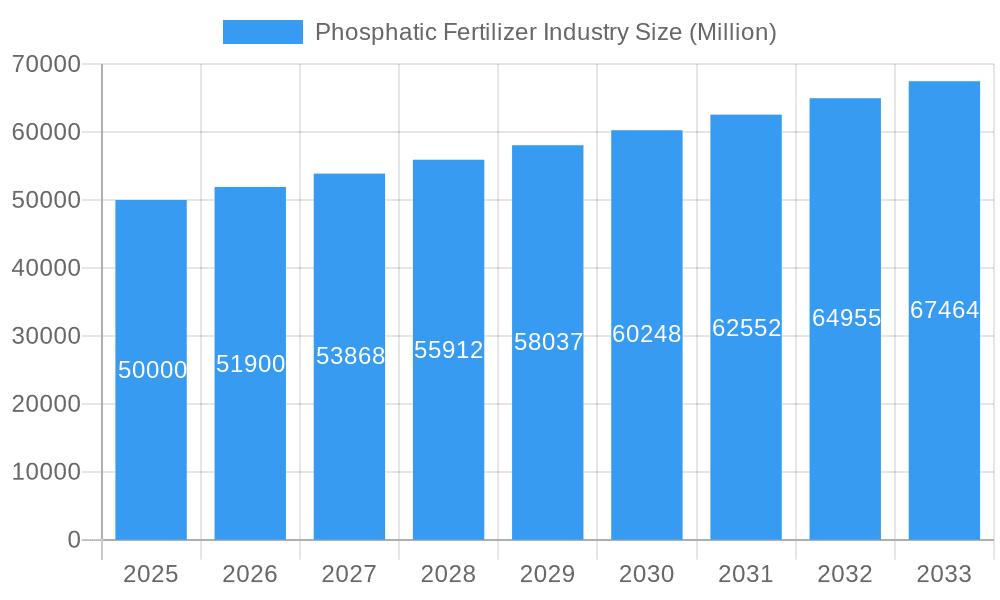
Phosphatic Fertilizer Industry Market Size (In Billion)

The forecast period (2025-2033) will likely emphasize sustainable and efficient fertilizer application methods, including precision farming and advanced nutrient management strategies. These approaches aim to improve crop yields while minimizing environmental impact. The market is expected to remain consolidated, with key players focusing on product innovation, strategic alliances, and global expansion. Addressing raw material volatility and evolving environmental regulations will be crucial for sustained growth. Innovations in fertilizer formulations, prioritizing enhanced efficiency and reduced environmental impact, will be vital for long-term market success.
Phosphatic Fertilizer Industry Company Market Share
Phosphatic Fertilizer Industry Report: 2019-2033
This comprehensive report provides an in-depth analysis of the global phosphatic fertilizer industry, offering invaluable insights for industry professionals, investors, and stakeholders. Covering the period from 2019 to 2033, with a base year of 2025, this report meticulously examines market dynamics, competitive landscapes, and future growth opportunities. The report leverages a robust methodology incorporating historical data (2019-2024), current estimations (2025), and detailed forecasts (2025-2033) to present a holistic view of this crucial sector. Key players such as Coromandel International Ltd, PhosAgro Group of Companies, Koch Industries Inc, Indian Farmers Fertiliser Cooperative Limited, K+S Aktiengesellschaft, EuroChem Group, SABIC Agri-Nutrients Co, and Nutrien Ltd are analyzed, with their strategies and market positions dissected.
Phosphatic Fertilizer Industry Market Structure & Innovation Trends
This section analyzes the phosphatic fertilizer market's structure, highlighting key trends influencing its evolution. The market exhibits moderate concentration, with the top eight players holding an estimated xx% market share in 2025. Innovation is driven by the need for higher efficiency fertilizers, sustainable production methods, and precise application technologies. Regulatory frameworks, varying across regions, significantly impact production and distribution. Key product substitutes include organic fertilizers and biofertilizers, though their market penetration remains relatively low at xx% in 2025. End-user demographics are largely influenced by agricultural practices and crop types, with field crops dominating consumption. Mergers and acquisitions (M&A) are common, with recent deals such as SABIC Agri-Nutrients' USD 320 Million acquisition of a 49% stake in ETG Inputs Holdco Limited in April 2023, shaping market consolidation. Further, K+S's acquisition of a 75% share in Industrial Commodities Holdings (Pty) Ltd's fertilizer business in April 2023 signifies expansion into new markets.
- Market Concentration: Top 8 players hold approximately xx% market share (2025).
- Innovation Drivers: Higher efficiency, sustainability, and precision application.
- Regulatory Landscape: Varies significantly across regions, influencing production and distribution.
- M&A Activity: Significant consolidation observed with notable deals totaling USD xx Million in the past three years.
Phosphatic Fertilizer Industry Market Dynamics & Trends
The phosphatic fertilizer market is projected to experience a CAGR of xx% during the forecast period (2025-2033), driven by factors like increasing global population, rising demand for food, and government initiatives promoting agricultural development. Technological advancements in fertilizer production and application methods are enhancing efficiency and reducing environmental impact. Changing consumer preferences toward sustainable and high-yielding crops are also influencing market trends. Competitive dynamics are intense, with major players focusing on product differentiation, strategic partnerships, and market expansion. Market penetration of advanced fertilizer technologies is estimated at xx% in 2025, with projections to reach xx% by 2033. Challenges such as volatile raw material prices and environmental concerns pose significant restraints on market growth.
Dominant Regions & Segments in Phosphatic Fertilizer Industry
The report identifies [Leading Region/Country] as the dominant region/country in the phosphatic fertilizer market, driven by factors such as:
- Strong agricultural base: Extensive arable land and favorable climatic conditions.
- Government support: Subsidies and policies promoting fertilizer usage.
- Developed infrastructure: Efficient transportation and distribution networks.
Dominant Segments:
- Type: Straight phosphatic fertilizers dominate the market with a market share of xx% in 2025 due to their cost-effectiveness and widespread use.
- Application Mode: Soil application remains the most prevalent method, accounting for xx% of total application in 2025. However, Fertigation is showing significant growth, driven by its efficiency and precision.
- Crop Type: Field crops (e.g., cereals, oilseeds, pulses) represent the largest segment, consuming approximately xx% of total phosphatic fertilizer production in 2025, due to their large acreage and high fertilizer demand.
Phosphatic Fertilizer Industry Product Innovations
Recent innovations focus on enhancing nutrient use efficiency, reducing environmental impact, and improving crop yields. Controlled-release fertilizers, water-soluble fertilizers, and bio-based fertilizers are gaining traction. These innovations offer improved nutrient uptake by plants, reduced nutrient runoff, and enhanced crop productivity, aligning with the growing demand for sustainable agricultural practices. The market is witnessing a shift toward specialized fertilizers tailored to specific crops and soil conditions.
Report Scope & Segmentation Analysis
This report provides a comprehensive segmentation analysis of the phosphatic fertilizer market across various parameters:
Type: Straight, Others. The straight segment is projected to grow at a CAGR of xx% from 2025 to 2033.
Application Mode: Fertigation, Foliar, Soil. Fertigation is experiencing rapid growth due to its precision and efficiency.
Crop Type: Field Crops, Horticultural Crops, Turf & Ornamental. Field crops remain the dominant segment, with significant growth potential expected in horticultural and ornamental crops.
Each segment's market size, growth projections, and competitive dynamics are thoroughly analyzed in the report.
Key Drivers of Phosphatic Fertilizer Industry Growth
Several factors are driving the growth of the phosphatic fertilizer industry:
- Rising global food demand: Driven by population growth and changing dietary patterns.
- Government initiatives: Supporting agricultural development and fertilizer usage.
- Technological advancements: Enhancing fertilizer efficiency and reducing environmental impact.
- Increased adoption of modern farming techniques: Including precision agriculture and intensive farming practices.
Challenges in the Phosphatic Fertilizer Industry Sector
The industry faces various challenges, including:
- Raw material price volatility: Affecting production costs and profitability.
- Environmental concerns: Related to phosphate mining and fertilizer runoff.
- Stringent environmental regulations: Increasing compliance costs and potentially limiting production.
- Competition from alternative fertilizers: Including organic and bio-fertilizers.
Emerging Opportunities in Phosphatic Fertilizer Industry
The industry presents several exciting opportunities:
- Growth in emerging economies: With increasing agricultural activities and fertilizer demand.
- Development of sustainable and efficient fertilizer technologies: Reducing environmental impact.
- Expansion of precision agriculture: Optimizing fertilizer application and reducing waste.
- Focus on specialty fertilizers: Tailored to specific crop needs and soil conditions.
Leading Players in the Phosphatic Fertilizer Industry Market
- Coromandel International Ltd
- PhosAgro Group of Companies
- Koch Industries Inc
- Indian Farmers Fertiliser Cooperative Limited
- K+S Aktiengesellschaft
- EuroChem Group
- SABIC Agri-Nutrients Co
- Nutrien Ltd
Key Developments in Phosphatic Fertilizer Industry
- April 2023: SABIC Agri-Nutrients Company acquired a 49% stake in ETG Inputs Holdco Limited for USD 320 Million, aiming to integrate the agri-nutrients value chain.
- April 2023: K+S acquired a 75% share of Industrial Commodities Holdings (Pty) Ltd's fertilizer business, expanding its presence in southern and eastern Africa.
- November 2021: Coromandel International announced a new sulfur acid plant with a 1,650 metric ton per day capacity.
Future Outlook for Phosphatic Fertilizer Industry Market
The phosphatic fertilizer market is poised for continued growth, driven by factors such as increasing food demand, technological advancements, and government support. Strategic investments in sustainable production methods, precision agriculture, and product innovation will be crucial for success in this dynamic market. The market’s future depends on balancing the needs of food security with environmental sustainability.
Phosphatic Fertilizer Industry Segmentation
- 1. Production Analysis
- 2. Consumption Analysis
- 3. Import Market Analysis (Value & Volume)
- 4. Export Market Analysis (Value & Volume)
- 5. Price Trend Analysis
Phosphatic Fertilizer Industry Segmentation By Geography
-
1. North America
- 1.1. United States
- 1.2. Canada
- 1.3. Mexico
-
2. South America
- 2.1. Brazil
- 2.2. Argentina
- 2.3. Rest of South America
-
3. Europe
- 3.1. United Kingdom
- 3.2. Germany
- 3.3. France
- 3.4. Italy
- 3.5. Spain
- 3.6. Russia
- 3.7. Benelux
- 3.8. Nordics
- 3.9. Rest of Europe
-
4. Middle East & Africa
- 4.1. Turkey
- 4.2. Israel
- 4.3. GCC
- 4.4. North Africa
- 4.5. South Africa
- 4.6. Rest of Middle East & Africa
-
5. Asia Pacific
- 5.1. China
- 5.2. India
- 5.3. Japan
- 5.4. South Korea
- 5.5. ASEAN
- 5.6. Oceania
- 5.7. Rest of Asia Pacific

Phosphatic Fertilizer Industry Regional Market Share
Geographic Coverage of Phosphatic Fertilizer Industry
Phosphatic Fertilizer Industry REPORT HIGHLIGHTS
| Aspects | Details |
|---|---|
| Study Period | 2020-2034 |
| Base Year | 2025 |
| Estimated Year | 2026 |
| Forecast Period | 2026-2034 |
| Historical Period | 2020-2025 |
| Growth Rate | CAGR of 8.15% from 2020-2034 |
| Segmentation |
|
Table of Contents
- 1. Introduction
- 1.1. Research Scope
- 1.2. Market Segmentation
- 1.3. Research Methodology
- 1.4. Definitions and Assumptions
- 2. Executive Summary
- 2.1. Introduction
- 3. Market Dynamics
- 3.1. Introduction
- 3.2. Market Drivers
- 3.2.1. Adoption of Organic and Eco-friendly Farming Practices; Declining Area of Arable Land and Rising Food Security Concerns
- 3.3. Market Restrains
- 3.3.1. High Demand for Conventional and Synthetic Products; Lack of Awareness and Other Factors Limiting the Adoption of Agricultural Inoculants
- 3.4. Market Trends
- 3.4.1. OTHER KEY INDUSTRY TRENDS COVERED IN THE REPORT
- 4. Market Factor Analysis
- 4.1. Porters Five Forces
- 4.2. Supply/Value Chain
- 4.3. PESTEL analysis
- 4.4. Market Entropy
- 4.5. Patent/Trademark Analysis
- 5. Global Phosphatic Fertilizer Industry Analysis, Insights and Forecast, 2020-2032
- 5.1. Market Analysis, Insights and Forecast - by Production Analysis
- 5.2. Market Analysis, Insights and Forecast - by Consumption Analysis
- 5.3. Market Analysis, Insights and Forecast - by Import Market Analysis (Value & Volume)
- 5.4. Market Analysis, Insights and Forecast - by Export Market Analysis (Value & Volume)
- 5.5. Market Analysis, Insights and Forecast - by Price Trend Analysis
- 5.6. Market Analysis, Insights and Forecast - by Region
- 5.6.1. North America
- 5.6.2. South America
- 5.6.3. Europe
- 5.6.4. Middle East & Africa
- 5.6.5. Asia Pacific
- 5.1. Market Analysis, Insights and Forecast - by Production Analysis
- 6. North America Phosphatic Fertilizer Industry Analysis, Insights and Forecast, 2020-2032
- 6.1. Market Analysis, Insights and Forecast - by Production Analysis
- 6.2. Market Analysis, Insights and Forecast - by Consumption Analysis
- 6.3. Market Analysis, Insights and Forecast - by Import Market Analysis (Value & Volume)
- 6.4. Market Analysis, Insights and Forecast - by Export Market Analysis (Value & Volume)
- 6.5. Market Analysis, Insights and Forecast - by Price Trend Analysis
- 6.1. Market Analysis, Insights and Forecast - by Production Analysis
- 7. South America Phosphatic Fertilizer Industry Analysis, Insights and Forecast, 2020-2032
- 7.1. Market Analysis, Insights and Forecast - by Production Analysis
- 7.2. Market Analysis, Insights and Forecast - by Consumption Analysis
- 7.3. Market Analysis, Insights and Forecast - by Import Market Analysis (Value & Volume)
- 7.4. Market Analysis, Insights and Forecast - by Export Market Analysis (Value & Volume)
- 7.5. Market Analysis, Insights and Forecast - by Price Trend Analysis
- 7.1. Market Analysis, Insights and Forecast - by Production Analysis
- 8. Europe Phosphatic Fertilizer Industry Analysis, Insights and Forecast, 2020-2032
- 8.1. Market Analysis, Insights and Forecast - by Production Analysis
- 8.2. Market Analysis, Insights and Forecast - by Consumption Analysis
- 8.3. Market Analysis, Insights and Forecast - by Import Market Analysis (Value & Volume)
- 8.4. Market Analysis, Insights and Forecast - by Export Market Analysis (Value & Volume)
- 8.5. Market Analysis, Insights and Forecast - by Price Trend Analysis
- 8.1. Market Analysis, Insights and Forecast - by Production Analysis
- 9. Middle East & Africa Phosphatic Fertilizer Industry Analysis, Insights and Forecast, 2020-2032
- 9.1. Market Analysis, Insights and Forecast - by Production Analysis
- 9.2. Market Analysis, Insights and Forecast - by Consumption Analysis
- 9.3. Market Analysis, Insights and Forecast - by Import Market Analysis (Value & Volume)
- 9.4. Market Analysis, Insights and Forecast - by Export Market Analysis (Value & Volume)
- 9.5. Market Analysis, Insights and Forecast - by Price Trend Analysis
- 9.1. Market Analysis, Insights and Forecast - by Production Analysis
- 10. Asia Pacific Phosphatic Fertilizer Industry Analysis, Insights and Forecast, 2020-2032
- 10.1. Market Analysis, Insights and Forecast - by Production Analysis
- 10.2. Market Analysis, Insights and Forecast - by Consumption Analysis
- 10.3. Market Analysis, Insights and Forecast - by Import Market Analysis (Value & Volume)
- 10.4. Market Analysis, Insights and Forecast - by Export Market Analysis (Value & Volume)
- 10.5. Market Analysis, Insights and Forecast - by Price Trend Analysis
- 10.1. Market Analysis, Insights and Forecast - by Production Analysis
- 11. Competitive Analysis
- 11.1. Global Market Share Analysis 2025
- 11.2. Company Profiles
- 11.2.1 Coromandel International Ltd
- 11.2.1.1. Overview
- 11.2.1.2. Products
- 11.2.1.3. SWOT Analysis
- 11.2.1.4. Recent Developments
- 11.2.1.5. Financials (Based on Availability)
- 11.2.2 PhosAgro Group of Companies
- 11.2.2.1. Overview
- 11.2.2.2. Products
- 11.2.2.3. SWOT Analysis
- 11.2.2.4. Recent Developments
- 11.2.2.5. Financials (Based on Availability)
- 11.2.3 Koch Industries Inc
- 11.2.3.1. Overview
- 11.2.3.2. Products
- 11.2.3.3. SWOT Analysis
- 11.2.3.4. Recent Developments
- 11.2.3.5. Financials (Based on Availability)
- 11.2.4 Indian Farmers Fertiliser Cooperative Limited
- 11.2.4.1. Overview
- 11.2.4.2. Products
- 11.2.4.3. SWOT Analysis
- 11.2.4.4. Recent Developments
- 11.2.4.5. Financials (Based on Availability)
- 11.2.5 K+S Aktiengesellschaft
- 11.2.5.1. Overview
- 11.2.5.2. Products
- 11.2.5.3. SWOT Analysis
- 11.2.5.4. Recent Developments
- 11.2.5.5. Financials (Based on Availability)
- 11.2.6 EuroChem Group
- 11.2.6.1. Overview
- 11.2.6.2. Products
- 11.2.6.3. SWOT Analysis
- 11.2.6.4. Recent Developments
- 11.2.6.5. Financials (Based on Availability)
- 11.2.7 SABIC Agri-Nutrients Co
- 11.2.7.1. Overview
- 11.2.7.2. Products
- 11.2.7.3. SWOT Analysis
- 11.2.7.4. Recent Developments
- 11.2.7.5. Financials (Based on Availability)
- 11.2.8 Nutrien Ltd
- 11.2.8.1. Overview
- 11.2.8.2. Products
- 11.2.8.3. SWOT Analysis
- 11.2.8.4. Recent Developments
- 11.2.8.5. Financials (Based on Availability)
- 11.2.1 Coromandel International Ltd
List of Figures
- Figure 1: Global Phosphatic Fertilizer Industry Revenue Breakdown (billion, %) by Region 2025 & 2033
- Figure 2: North America Phosphatic Fertilizer Industry Revenue (billion), by Production Analysis 2025 & 2033
- Figure 3: North America Phosphatic Fertilizer Industry Revenue Share (%), by Production Analysis 2025 & 2033
- Figure 4: North America Phosphatic Fertilizer Industry Revenue (billion), by Consumption Analysis 2025 & 2033
- Figure 5: North America Phosphatic Fertilizer Industry Revenue Share (%), by Consumption Analysis 2025 & 2033
- Figure 6: North America Phosphatic Fertilizer Industry Revenue (billion), by Import Market Analysis (Value & Volume) 2025 & 2033
- Figure 7: North America Phosphatic Fertilizer Industry Revenue Share (%), by Import Market Analysis (Value & Volume) 2025 & 2033
- Figure 8: North America Phosphatic Fertilizer Industry Revenue (billion), by Export Market Analysis (Value & Volume) 2025 & 2033
- Figure 9: North America Phosphatic Fertilizer Industry Revenue Share (%), by Export Market Analysis (Value & Volume) 2025 & 2033
- Figure 10: North America Phosphatic Fertilizer Industry Revenue (billion), by Price Trend Analysis 2025 & 2033
- Figure 11: North America Phosphatic Fertilizer Industry Revenue Share (%), by Price Trend Analysis 2025 & 2033
- Figure 12: North America Phosphatic Fertilizer Industry Revenue (billion), by Country 2025 & 2033
- Figure 13: North America Phosphatic Fertilizer Industry Revenue Share (%), by Country 2025 & 2033
- Figure 14: South America Phosphatic Fertilizer Industry Revenue (billion), by Production Analysis 2025 & 2033
- Figure 15: South America Phosphatic Fertilizer Industry Revenue Share (%), by Production Analysis 2025 & 2033
- Figure 16: South America Phosphatic Fertilizer Industry Revenue (billion), by Consumption Analysis 2025 & 2033
- Figure 17: South America Phosphatic Fertilizer Industry Revenue Share (%), by Consumption Analysis 2025 & 2033
- Figure 18: South America Phosphatic Fertilizer Industry Revenue (billion), by Import Market Analysis (Value & Volume) 2025 & 2033
- Figure 19: South America Phosphatic Fertilizer Industry Revenue Share (%), by Import Market Analysis (Value & Volume) 2025 & 2033
- Figure 20: South America Phosphatic Fertilizer Industry Revenue (billion), by Export Market Analysis (Value & Volume) 2025 & 2033
- Figure 21: South America Phosphatic Fertilizer Industry Revenue Share (%), by Export Market Analysis (Value & Volume) 2025 & 2033
- Figure 22: South America Phosphatic Fertilizer Industry Revenue (billion), by Price Trend Analysis 2025 & 2033
- Figure 23: South America Phosphatic Fertilizer Industry Revenue Share (%), by Price Trend Analysis 2025 & 2033
- Figure 24: South America Phosphatic Fertilizer Industry Revenue (billion), by Country 2025 & 2033
- Figure 25: South America Phosphatic Fertilizer Industry Revenue Share (%), by Country 2025 & 2033
- Figure 26: Europe Phosphatic Fertilizer Industry Revenue (billion), by Production Analysis 2025 & 2033
- Figure 27: Europe Phosphatic Fertilizer Industry Revenue Share (%), by Production Analysis 2025 & 2033
- Figure 28: Europe Phosphatic Fertilizer Industry Revenue (billion), by Consumption Analysis 2025 & 2033
- Figure 29: Europe Phosphatic Fertilizer Industry Revenue Share (%), by Consumption Analysis 2025 & 2033
- Figure 30: Europe Phosphatic Fertilizer Industry Revenue (billion), by Import Market Analysis (Value & Volume) 2025 & 2033
- Figure 31: Europe Phosphatic Fertilizer Industry Revenue Share (%), by Import Market Analysis (Value & Volume) 2025 & 2033
- Figure 32: Europe Phosphatic Fertilizer Industry Revenue (billion), by Export Market Analysis (Value & Volume) 2025 & 2033
- Figure 33: Europe Phosphatic Fertilizer Industry Revenue Share (%), by Export Market Analysis (Value & Volume) 2025 & 2033
- Figure 34: Europe Phosphatic Fertilizer Industry Revenue (billion), by Price Trend Analysis 2025 & 2033
- Figure 35: Europe Phosphatic Fertilizer Industry Revenue Share (%), by Price Trend Analysis 2025 & 2033
- Figure 36: Europe Phosphatic Fertilizer Industry Revenue (billion), by Country 2025 & 2033
- Figure 37: Europe Phosphatic Fertilizer Industry Revenue Share (%), by Country 2025 & 2033
- Figure 38: Middle East & Africa Phosphatic Fertilizer Industry Revenue (billion), by Production Analysis 2025 & 2033
- Figure 39: Middle East & Africa Phosphatic Fertilizer Industry Revenue Share (%), by Production Analysis 2025 & 2033
- Figure 40: Middle East & Africa Phosphatic Fertilizer Industry Revenue (billion), by Consumption Analysis 2025 & 2033
- Figure 41: Middle East & Africa Phosphatic Fertilizer Industry Revenue Share (%), by Consumption Analysis 2025 & 2033
- Figure 42: Middle East & Africa Phosphatic Fertilizer Industry Revenue (billion), by Import Market Analysis (Value & Volume) 2025 & 2033
- Figure 43: Middle East & Africa Phosphatic Fertilizer Industry Revenue Share (%), by Import Market Analysis (Value & Volume) 2025 & 2033
- Figure 44: Middle East & Africa Phosphatic Fertilizer Industry Revenue (billion), by Export Market Analysis (Value & Volume) 2025 & 2033
- Figure 45: Middle East & Africa Phosphatic Fertilizer Industry Revenue Share (%), by Export Market Analysis (Value & Volume) 2025 & 2033
- Figure 46: Middle East & Africa Phosphatic Fertilizer Industry Revenue (billion), by Price Trend Analysis 2025 & 2033
- Figure 47: Middle East & Africa Phosphatic Fertilizer Industry Revenue Share (%), by Price Trend Analysis 2025 & 2033
- Figure 48: Middle East & Africa Phosphatic Fertilizer Industry Revenue (billion), by Country 2025 & 2033
- Figure 49: Middle East & Africa Phosphatic Fertilizer Industry Revenue Share (%), by Country 2025 & 2033
- Figure 50: Asia Pacific Phosphatic Fertilizer Industry Revenue (billion), by Production Analysis 2025 & 2033
- Figure 51: Asia Pacific Phosphatic Fertilizer Industry Revenue Share (%), by Production Analysis 2025 & 2033
- Figure 52: Asia Pacific Phosphatic Fertilizer Industry Revenue (billion), by Consumption Analysis 2025 & 2033
- Figure 53: Asia Pacific Phosphatic Fertilizer Industry Revenue Share (%), by Consumption Analysis 2025 & 2033
- Figure 54: Asia Pacific Phosphatic Fertilizer Industry Revenue (billion), by Import Market Analysis (Value & Volume) 2025 & 2033
- Figure 55: Asia Pacific Phosphatic Fertilizer Industry Revenue Share (%), by Import Market Analysis (Value & Volume) 2025 & 2033
- Figure 56: Asia Pacific Phosphatic Fertilizer Industry Revenue (billion), by Export Market Analysis (Value & Volume) 2025 & 2033
- Figure 57: Asia Pacific Phosphatic Fertilizer Industry Revenue Share (%), by Export Market Analysis (Value & Volume) 2025 & 2033
- Figure 58: Asia Pacific Phosphatic Fertilizer Industry Revenue (billion), by Price Trend Analysis 2025 & 2033
- Figure 59: Asia Pacific Phosphatic Fertilizer Industry Revenue Share (%), by Price Trend Analysis 2025 & 2033
- Figure 60: Asia Pacific Phosphatic Fertilizer Industry Revenue (billion), by Country 2025 & 2033
- Figure 61: Asia Pacific Phosphatic Fertilizer Industry Revenue Share (%), by Country 2025 & 2033
List of Tables
- Table 1: Global Phosphatic Fertilizer Industry Revenue billion Forecast, by Production Analysis 2020 & 2033
- Table 2: Global Phosphatic Fertilizer Industry Revenue billion Forecast, by Consumption Analysis 2020 & 2033
- Table 3: Global Phosphatic Fertilizer Industry Revenue billion Forecast, by Import Market Analysis (Value & Volume) 2020 & 2033
- Table 4: Global Phosphatic Fertilizer Industry Revenue billion Forecast, by Export Market Analysis (Value & Volume) 2020 & 2033
- Table 5: Global Phosphatic Fertilizer Industry Revenue billion Forecast, by Price Trend Analysis 2020 & 2033
- Table 6: Global Phosphatic Fertilizer Industry Revenue billion Forecast, by Region 2020 & 2033
- Table 7: Global Phosphatic Fertilizer Industry Revenue billion Forecast, by Production Analysis 2020 & 2033
- Table 8: Global Phosphatic Fertilizer Industry Revenue billion Forecast, by Consumption Analysis 2020 & 2033
- Table 9: Global Phosphatic Fertilizer Industry Revenue billion Forecast, by Import Market Analysis (Value & Volume) 2020 & 2033
- Table 10: Global Phosphatic Fertilizer Industry Revenue billion Forecast, by Export Market Analysis (Value & Volume) 2020 & 2033
- Table 11: Global Phosphatic Fertilizer Industry Revenue billion Forecast, by Price Trend Analysis 2020 & 2033
- Table 12: Global Phosphatic Fertilizer Industry Revenue billion Forecast, by Country 2020 & 2033
- Table 13: United States Phosphatic Fertilizer Industry Revenue (billion) Forecast, by Application 2020 & 2033
- Table 14: Canada Phosphatic Fertilizer Industry Revenue (billion) Forecast, by Application 2020 & 2033
- Table 15: Mexico Phosphatic Fertilizer Industry Revenue (billion) Forecast, by Application 2020 & 2033
- Table 16: Global Phosphatic Fertilizer Industry Revenue billion Forecast, by Production Analysis 2020 & 2033
- Table 17: Global Phosphatic Fertilizer Industry Revenue billion Forecast, by Consumption Analysis 2020 & 2033
- Table 18: Global Phosphatic Fertilizer Industry Revenue billion Forecast, by Import Market Analysis (Value & Volume) 2020 & 2033
- Table 19: Global Phosphatic Fertilizer Industry Revenue billion Forecast, by Export Market Analysis (Value & Volume) 2020 & 2033
- Table 20: Global Phosphatic Fertilizer Industry Revenue billion Forecast, by Price Trend Analysis 2020 & 2033
- Table 21: Global Phosphatic Fertilizer Industry Revenue billion Forecast, by Country 2020 & 2033
- Table 22: Brazil Phosphatic Fertilizer Industry Revenue (billion) Forecast, by Application 2020 & 2033
- Table 23: Argentina Phosphatic Fertilizer Industry Revenue (billion) Forecast, by Application 2020 & 2033
- Table 24: Rest of South America Phosphatic Fertilizer Industry Revenue (billion) Forecast, by Application 2020 & 2033
- Table 25: Global Phosphatic Fertilizer Industry Revenue billion Forecast, by Production Analysis 2020 & 2033
- Table 26: Global Phosphatic Fertilizer Industry Revenue billion Forecast, by Consumption Analysis 2020 & 2033
- Table 27: Global Phosphatic Fertilizer Industry Revenue billion Forecast, by Import Market Analysis (Value & Volume) 2020 & 2033
- Table 28: Global Phosphatic Fertilizer Industry Revenue billion Forecast, by Export Market Analysis (Value & Volume) 2020 & 2033
- Table 29: Global Phosphatic Fertilizer Industry Revenue billion Forecast, by Price Trend Analysis 2020 & 2033
- Table 30: Global Phosphatic Fertilizer Industry Revenue billion Forecast, by Country 2020 & 2033
- Table 31: United Kingdom Phosphatic Fertilizer Industry Revenue (billion) Forecast, by Application 2020 & 2033
- Table 32: Germany Phosphatic Fertilizer Industry Revenue (billion) Forecast, by Application 2020 & 2033
- Table 33: France Phosphatic Fertilizer Industry Revenue (billion) Forecast, by Application 2020 & 2033
- Table 34: Italy Phosphatic Fertilizer Industry Revenue (billion) Forecast, by Application 2020 & 2033
- Table 35: Spain Phosphatic Fertilizer Industry Revenue (billion) Forecast, by Application 2020 & 2033
- Table 36: Russia Phosphatic Fertilizer Industry Revenue (billion) Forecast, by Application 2020 & 2033
- Table 37: Benelux Phosphatic Fertilizer Industry Revenue (billion) Forecast, by Application 2020 & 2033
- Table 38: Nordics Phosphatic Fertilizer Industry Revenue (billion) Forecast, by Application 2020 & 2033
- Table 39: Rest of Europe Phosphatic Fertilizer Industry Revenue (billion) Forecast, by Application 2020 & 2033
- Table 40: Global Phosphatic Fertilizer Industry Revenue billion Forecast, by Production Analysis 2020 & 2033
- Table 41: Global Phosphatic Fertilizer Industry Revenue billion Forecast, by Consumption Analysis 2020 & 2033
- Table 42: Global Phosphatic Fertilizer Industry Revenue billion Forecast, by Import Market Analysis (Value & Volume) 2020 & 2033
- Table 43: Global Phosphatic Fertilizer Industry Revenue billion Forecast, by Export Market Analysis (Value & Volume) 2020 & 2033
- Table 44: Global Phosphatic Fertilizer Industry Revenue billion Forecast, by Price Trend Analysis 2020 & 2033
- Table 45: Global Phosphatic Fertilizer Industry Revenue billion Forecast, by Country 2020 & 2033
- Table 46: Turkey Phosphatic Fertilizer Industry Revenue (billion) Forecast, by Application 2020 & 2033
- Table 47: Israel Phosphatic Fertilizer Industry Revenue (billion) Forecast, by Application 2020 & 2033
- Table 48: GCC Phosphatic Fertilizer Industry Revenue (billion) Forecast, by Application 2020 & 2033
- Table 49: North Africa Phosphatic Fertilizer Industry Revenue (billion) Forecast, by Application 2020 & 2033
- Table 50: South Africa Phosphatic Fertilizer Industry Revenue (billion) Forecast, by Application 2020 & 2033
- Table 51: Rest of Middle East & Africa Phosphatic Fertilizer Industry Revenue (billion) Forecast, by Application 2020 & 2033
- Table 52: Global Phosphatic Fertilizer Industry Revenue billion Forecast, by Production Analysis 2020 & 2033
- Table 53: Global Phosphatic Fertilizer Industry Revenue billion Forecast, by Consumption Analysis 2020 & 2033
- Table 54: Global Phosphatic Fertilizer Industry Revenue billion Forecast, by Import Market Analysis (Value & Volume) 2020 & 2033
- Table 55: Global Phosphatic Fertilizer Industry Revenue billion Forecast, by Export Market Analysis (Value & Volume) 2020 & 2033
- Table 56: Global Phosphatic Fertilizer Industry Revenue billion Forecast, by Price Trend Analysis 2020 & 2033
- Table 57: Global Phosphatic Fertilizer Industry Revenue billion Forecast, by Country 2020 & 2033
- Table 58: China Phosphatic Fertilizer Industry Revenue (billion) Forecast, by Application 2020 & 2033
- Table 59: India Phosphatic Fertilizer Industry Revenue (billion) Forecast, by Application 2020 & 2033
- Table 60: Japan Phosphatic Fertilizer Industry Revenue (billion) Forecast, by Application 2020 & 2033
- Table 61: South Korea Phosphatic Fertilizer Industry Revenue (billion) Forecast, by Application 2020 & 2033
- Table 62: ASEAN Phosphatic Fertilizer Industry Revenue (billion) Forecast, by Application 2020 & 2033
- Table 63: Oceania Phosphatic Fertilizer Industry Revenue (billion) Forecast, by Application 2020 & 2033
- Table 64: Rest of Asia Pacific Phosphatic Fertilizer Industry Revenue (billion) Forecast, by Application 2020 & 2033
Frequently Asked Questions
1. What is the projected Compound Annual Growth Rate (CAGR) of the Phosphatic Fertilizer Industry?
The projected CAGR is approximately 8.15%.
2. Which companies are prominent players in the Phosphatic Fertilizer Industry?
Key companies in the market include Coromandel International Ltd, PhosAgro Group of Companies, Koch Industries Inc, Indian Farmers Fertiliser Cooperative Limited, K+S Aktiengesellschaft, EuroChem Group, SABIC Agri-Nutrients Co, Nutrien Ltd.
3. What are the main segments of the Phosphatic Fertilizer Industry?
The market segments include Production Analysis, Consumption Analysis, Import Market Analysis (Value & Volume), Export Market Analysis (Value & Volume), Price Trend Analysis.
4. Can you provide details about the market size?
The market size is estimated to be USD 14.46 billion as of 2022.
5. What are some drivers contributing to market growth?
Adoption of Organic and Eco-friendly Farming Practices; Declining Area of Arable Land and Rising Food Security Concerns.
6. What are the notable trends driving market growth?
OTHER KEY INDUSTRY TRENDS COVERED IN THE REPORT.
7. Are there any restraints impacting market growth?
High Demand for Conventional and Synthetic Products; Lack of Awareness and Other Factors Limiting the Adoption of Agricultural Inoculants.
8. Can you provide examples of recent developments in the market?
April 2023: SABIC Agri-Nutrients Company acquired the ETC Group (ETG) with a 49% stake in the ETG Inputs Holdco Limited for a transaction value of USD 320 million. The agreement is part of SABIC Agri-Nutrients Company's strategy to integrate the value chain and distribution of agri-nutrients markets.April 2023: K+S acquired a 75% share of the fertilizer business of a South African trading company, Industrial Commodities Holdings (Pty) Ltd (ICH). In addition to expanding the core business, K+S is strengthening its operations in southern and eastern Africa as a result of this acquisition. The newly acquired fertilizer business in the future is to be operated in a joint venture under the name of FertivPty Ltd.November 2021: Coromandel International announced a new sulfur acid plant at Visakhapatnam. The plant will have a 1,650 metric ton per day production capacity.
9. What pricing options are available for accessing the report?
Pricing options include single-user, multi-user, and enterprise licenses priced at USD 3800, USD 4500, and USD 5800 respectively.
10. Is the market size provided in terms of value or volume?
The market size is provided in terms of value, measured in billion.
11. Are there any specific market keywords associated with the report?
Yes, the market keyword associated with the report is "Phosphatic Fertilizer Industry," which aids in identifying and referencing the specific market segment covered.
12. How do I determine which pricing option suits my needs best?
The pricing options vary based on user requirements and access needs. Individual users may opt for single-user licenses, while businesses requiring broader access may choose multi-user or enterprise licenses for cost-effective access to the report.
13. Are there any additional resources or data provided in the Phosphatic Fertilizer Industry report?
While the report offers comprehensive insights, it's advisable to review the specific contents or supplementary materials provided to ascertain if additional resources or data are available.
14. How can I stay updated on further developments or reports in the Phosphatic Fertilizer Industry?
To stay informed about further developments, trends, and reports in the Phosphatic Fertilizer Industry, consider subscribing to industry newsletters, following relevant companies and organizations, or regularly checking reputable industry news sources and publications.
Methodology
Step 1 - Identification of Relevant Samples Size from Population Database


Step 2 - Approaches for Defining Global Market Size (Value, Volume* & Price*)

Note*: In applicable scenarios
Step 3 - Data Sources
Primary Research
- Web Analytics
- Survey Reports
- Research Institute
- Latest Research Reports
- Opinion Leaders
Secondary Research
- Annual Reports
- White Paper
- Latest Press Release
- Industry Association
- Paid Database
- Investor Presentations

Step 4 - Data Triangulation
Involves using different sources of information in order to increase the validity of a study
These sources are likely to be stakeholders in a program - participants, other researchers, program staff, other community members, and so on.
Then we put all data in single framework & apply various statistical tools to find out the dynamic on the market.
During the analysis stage, feedback from the stakeholder groups would be compared to determine areas of agreement as well as areas of divergence