

Key Insights
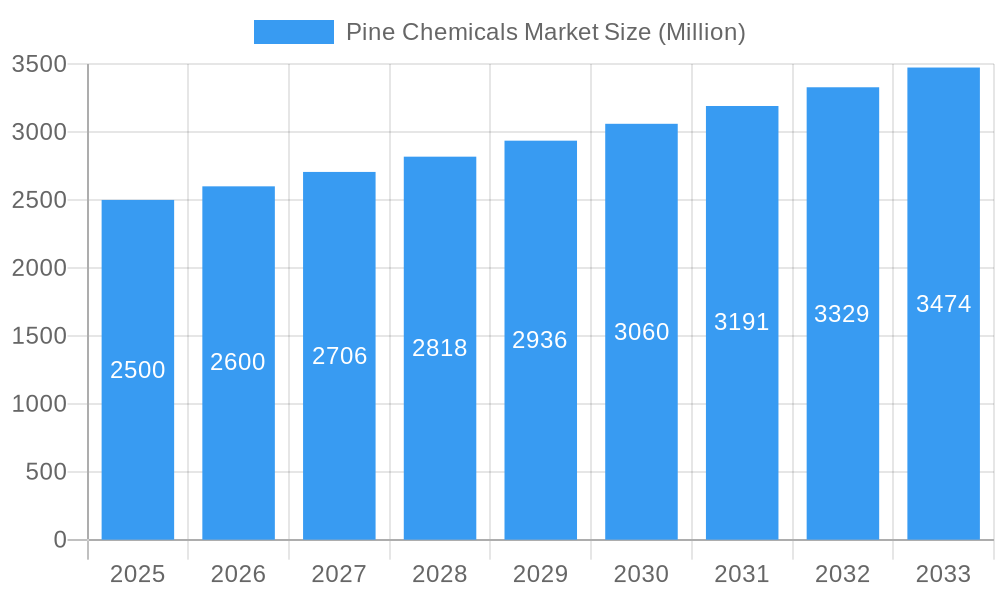
The global Pine Chemicals market is poised for substantial expansion, with a projected market size of $17.3 billion by 2033, growing at a Compound Annual Growth Rate (CAGR) of 5% from the 2025 base year. This growth is propelled by escalating demand from the construction, coatings, and adhesives sectors, leveraging the essential properties of rosin and tall oil. The increasing preference for sustainable, bio-based alternatives further bolsters market trajectory, underscoring the inherent environmental advantages of pine chemicals. Challenges include price volatility of raw materials like wood pulp, impacting production costs and market dynamics. The market is segmented by product type, including Tall Oil, Tall Oil Pitch, Rosin, Wood Rosin, Turpentine, and Other Turpentines, with key applications in construction and coatings. North America and Europe currently dominate market share due to established industrial bases and robust infrastructure. However, the Asia-Pacific region is anticipated to experience significant growth driven by rapid industrialization and infrastructure development.
Pine Chemicals Market Market Size (In Billion)
The forecast period (2025-2033) indicates sustained market growth, fueled by innovation in product development and a focus on enhanced performance and sustainability. Investment in research and development is crucial for improving pine-derived chemical properties and exploring novel applications, including renewable energy and biomaterials. While raw material price fluctuations persist, strategic collaborations, sustainable sourcing, and optimized supply chains are expected to mitigate these impacts. The long-term outlook for the Pine Chemicals market remains highly positive, reflecting its crucial role as a sustainable and adaptable resource across diverse key industries.
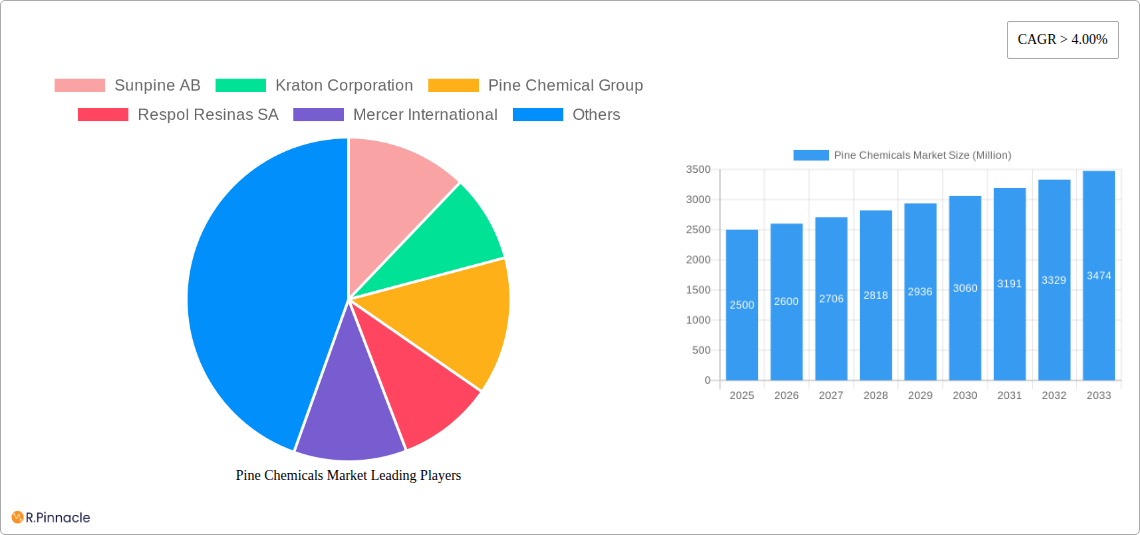
Pine Chemicals Market Company Market Share
Pine Chemicals Market Report: 2019-2033 Forecast
This comprehensive report provides an in-depth analysis of the global Pine Chemicals Market, offering invaluable insights for industry professionals, investors, and strategic decision-makers. With a detailed study period spanning 2019-2033 (Base Year: 2025, Forecast Period: 2025-2033), this report unveils the market's current dynamics and future trajectory. The report incorporates data from the historical period (2019-2024) and leverages key metrics to provide actionable intelligence. The market size is predicted to reach xx Million by 2033, showcasing significant growth potential.
Pine Chemicals Market Market Structure & Innovation Trends
This section analyzes the competitive landscape of the Pine Chemicals market, focusing on market concentration, innovation drivers, regulatory frameworks, product substitutes, and M&A activities. The market is moderately concentrated, with key players holding significant market share. Sunpine AB, Kraton Corporation, and Ingevity Corporation are amongst the prominent players, commanding a combined xx% market share in 2025 (estimated). Innovation is driven by the increasing demand for sustainable and bio-based alternatives, leading to R&D efforts focused on improving product performance and reducing environmental impact. Stringent environmental regulations are also shaping market dynamics, promoting the adoption of eco-friendly production processes.
- Market Concentration: Moderately concentrated, with top 5 players holding xx% market share (estimated).
- Innovation Drivers: Demand for sustainable alternatives, improved product performance, and reduced environmental impact.
- Regulatory Frameworks: Stringent environmental regulations driving adoption of eco-friendly processes.
- Product Substitutes: Synthetic resins and polymers pose a competitive challenge.
- M&A Activities: Recent acquisitions and mergers (detailed below) indicate increased consolidation in the market. The total M&A deal value in the period 2019-2024 is estimated at xx Million. The Grupo Resinas Brasil (RB) acquisition of Pinopine is an example of this trend.
Pine Chemicals Market Market Dynamics & Trends
The Pine Chemicals market is experiencing robust growth, driven by several factors. The increasing demand from various end-use industries, such as adhesives, coatings, and inks, is a key driver. Technological advancements, such as the development of novel rosin derivatives and improved production processes, are further boosting market expansion. Consumer preferences for sustainable and eco-friendly products are also contributing to the market's growth. Competitive dynamics are intense, with companies focusing on product innovation, cost optimization, and strategic partnerships to gain market share. The market is anticipated to exhibit a CAGR of xx% during the forecast period (2025-2033), driven largely by growth in the xx region. Market penetration in emerging economies is also projected to significantly increase, especially in Asia-Pacific, due to rapid industrialization and infrastructure development.
Dominant Regions & Segments in Pine Chemicals Market
The North American region is currently the leading market for pine chemicals, driven by strong demand from the pulp and paper, adhesives, and coatings industries. Europe follows closely, with significant production capacities and established market players. Asia-Pacific is expected to witness the fastest growth in the forecast period due to rapid industrialization and expanding end-use applications.
- Product Type: Tall oil holds the largest market share, followed by rosin and turpentine.
- Application: The adhesives and coatings industries are the major consumers of pine chemicals.
- Key Drivers (North America): Strong demand from pulp and paper, coatings and adhesives industries. Established manufacturing base, and robust R&D activities.
- Key Drivers (Europe): Well-established production capacities, strong presence of key players, and a focus on sustainable practices.
- Key Drivers (Asia-Pacific): Rapid industrialization and infrastructure development, growing demand from various end-use industries.
Pine Chemicals Market Product Innovations
Recent innovations in the Pine Chemicals market are focused on developing high-performance, sustainable, and cost-effective products. Companies are investing in R&D to create new rosin derivatives with enhanced properties, expanding application possibilities in various industries. The introduction of bio-based binders, such as DRT’s DERTOPHALT, exemplifies this trend, reflecting the market's shift towards sustainable solutions. These innovations are improving product performance and market competitiveness.
Report Scope & Segmentation Analysis
This report provides a comprehensive segmentation of the Pine Chemicals Market based on product type (Tall Oil, Tall Oil Pitch (TOP), Rosin (Wood Rosin), Turpentine (Other Turpentines)) and application. Each segment is analyzed in terms of its growth potential, market size, and competitive dynamics. Detailed growth projections are provided for each segment throughout the forecast period. The report also includes a detailed analysis of regional markets.
- Tall Oil: The Tall Oil segment is projected to grow at a CAGR of xx% during the forecast period, driven by increasing demand from the biofuel and chemical industries.
- Tall Oil Pitch (TOP): The TOP segment is expected to witness steady growth, driven by its use in various applications, including adhesives and sealants.
- Rosin (Wood Rosin): The Wood Rosin segment is anticipated to register moderate growth driven by its applications in paper sizing, adhesives, and inks.
- Turpentine (Other Turpentines): The Turpentine segment is likely to experience relatively stable growth, driven by its applications in solvents, paints and coatings.
Key Drivers of Pine Chemicals Market Growth
The Pine Chemicals market growth is propelled by several factors: the increasing demand for sustainable and bio-based materials, advancements in product technology leading to improved performance and versatility, and expansion of applications across various industries such as adhesives, coatings, and inks. Government support for renewable resources and stringent regulations on synthetic alternatives further accelerate the market's expansion.
Challenges in the Pine Chemicals Market Sector
The Pine Chemicals market faces challenges such as volatility in raw material prices, supply chain disruptions, and intense competition from synthetic alternatives. Stringent environmental regulations also necessitate significant investments in sustainable production processes. The impact of these challenges is estimated to reduce the overall market growth by approximately xx% during the forecast period.
Emerging Opportunities in Pine Chemicals Market
Emerging opportunities lie in the development of new, high-value applications for pine chemicals, particularly in areas like bio-based materials and renewable energy. Expanding into new geographical markets, particularly developing economies, also presents significant growth potential. Focusing on sustainable and eco-friendly production processes is key to capitalizing on growing consumer preferences.
Leading Players in the Pine Chemicals Market Market
- Sunpine AB
- Kraton Corporation
- Pine Chemical Group
- Respol Resinas SA
- Mercer International
- Harima Chemicals Group Inc
- OOO Torgoviy Dom Lesokhimik
- Ingevity Corporation
- Forchem Oyj
- Synthomer Plc
- Arakawa Chemical Industries Ltd
- DRT (Dérivés Résiniques et Terpéniques)
Key Developments in Pine Chemicals Market Industry
- March 2024: Grupo Resinas Brasil (RB) acquires majority share in Pinopine, Portugal, expanding its market presence in gum rosin derivatives.
- September 2023: DRT invests in a new production facility in France, boosting its capacity for hydrogenated rosin and resin derivatives.
- June 2022: DRT launches DERTOPHALT, a 100% natural, plant-based binder, demonstrating innovation in sustainable alternatives.
Future Outlook for Pine Chemicals Market Market
The Pine Chemicals market is poised for continued growth, driven by increasing demand for sustainable alternatives and technological advancements. Strategic partnerships, acquisitions, and focus on R&D will be key to success. Companies focusing on innovation, sustainability, and efficient supply chains are best positioned to capture significant market share in the coming years.
Pine Chemicals Market Segmentation
-
1. Product Type
-
1.1. Tall Oil
- 1.1.1. Crude Tall Oil (CTO)
- 1.1.2. Tall Oil Fatty Acid (TOFA)
- 1.1.3. Distilled Tall Oil (DTO)
- 1.1.4. Tall Oil Pitch (TOP)
-
1.2. Rosin
- 1.2.1. Tall Oil Rosin
- 1.2.2. Gum Rosin
- 1.2.3. Wood Rosin
-
1.3. Turpentine
- 1.3.1. Gum/Wood Turpentine
- 1.3.2. Crude Sulphate Turpentine
- 1.3.3. Other Turpentines
-
1.4. Application
- 1.4.1. Adhesives and Sealants
- 1.4.2. Coatings
- 1.4.3. Printing Inks
- 1.4.4. Lubricants and Lubricity Additives
- 1.4.5. Biofuels
- 1.4.6. Paper Sizing
- 1.4.7. Rubber
- 1.4.8. Soaps and Detergents
- 1.4.9. Other Ap
-
1.1. Tall Oil
Pine Chemicals Market Segmentation By Geography
-
1. Asia Pacific
- 1.1. China
- 1.2. India
- 1.3. Japan
- 1.4. South Korea
- 1.5. ASEAN Countries
- 1.6. Rest of Asia Pacific
-
2. North America
- 2.1. United States
- 2.2. Canada
- 2.3. Mexico
-
3. Europe
- 3.1. Germany
- 3.2. United Kingdom
- 3.3. Italy
- 3.4. France
- 3.5. Rest of Europe
-
4. South America
- 4.1. Brazil
- 4.2. Argentina
- 4.3. Rest of South America
-
5. Middle East and Africa
- 5.1. Saudi Arabia
- 5.2. South Africa
- 5.3. Rest of Middle East and Africa
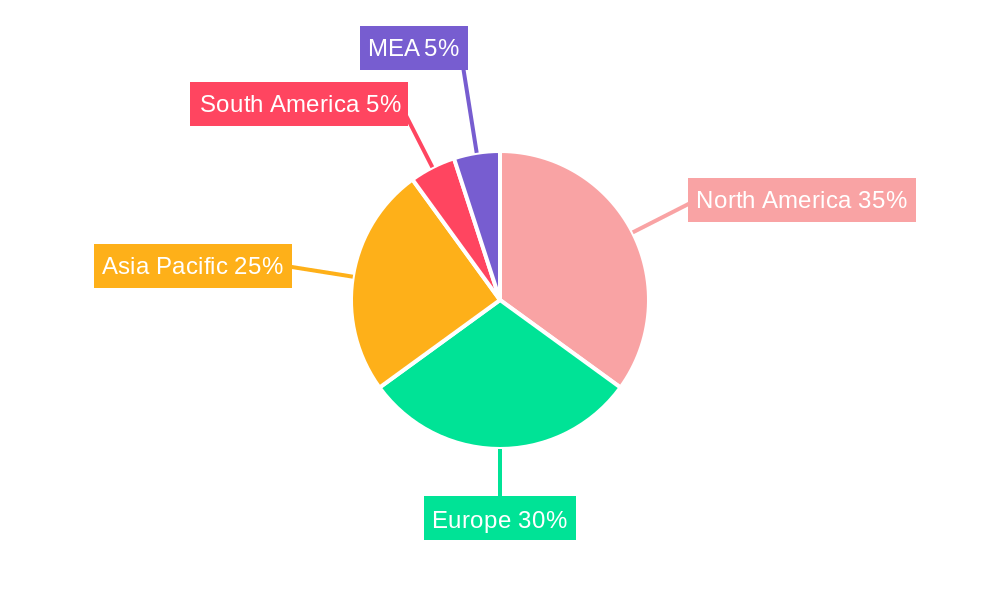
Pine Chemicals Market Regional Market Share
Geographic Coverage of Pine Chemicals Market
Pine Chemicals Market REPORT HIGHLIGHTS
| Aspects | Details |
|---|---|
| Study Period | 2020-2034 |
| Base Year | 2025 |
| Estimated Year | 2026 |
| Forecast Period | 2026-2034 |
| Historical Period | 2020-2025 |
| Growth Rate | CAGR of 5% from 2020-2034 |
| Segmentation |
|
Table of Contents
- 1. Introduction
- 1.1. Research Scope
- 1.2. Market Segmentation
- 1.3. Research Objective
- 1.4. Definitions and Assumptions
- 2. Executive Summary
- 2.1. Market Snapshot
- 3. Market Dynamics
- 3.1. Market Drivers
- 3.2. Market Restrains
- 3.3. Market Trends
- 3.4. Market Opportunities
- 4. Market Factor Analysis
- 4.1. Porters Five Forces
- 4.1.1. Bargaining Power of Suppliers
- 4.1.2. Bargaining Power of Buyers
- 4.1.3. Threat of New Entrants
- 4.1.4. Threat of Substitutes
- 4.1.5. Competitive Rivalry
- 4.2. PESTEL analysis
- 4.3. BCG Analysis
- 4.3.1. Stars (High Growth, High Market Share)
- 4.3.2. Cash Cows (Low Growth, High Market Share)
- 4.3.3. Question Mark (High Growth, Low Market Share)
- 4.3.4. Dogs (Low Growth, Low Market Share)
- 4.4. Ansoff Matrix Analysis
- 4.5. Supply Chain Analysis
- 4.6. Regulatory Landscape
- 4.7. Current Market Potential and Opportunity Assessment (TAM–SAM–SOM Framework)
- 4.8. PRI Analyst Note
- 4.1. Porters Five Forces
- 5. Market Analysis, Insights and Forecast 2021-2033
- 5.1. Market Analysis, Insights and Forecast - by Product Type
- 5.1.1. Tall Oil
- 5.1.1.1. Crude Tall Oil (CTO)
- 5.1.1.2. Tall Oil Fatty Acid (TOFA)
- 5.1.1.3. Distilled Tall Oil (DTO)
- 5.1.1.4. Tall Oil Pitch (TOP)
- 5.1.2. Rosin
- 5.1.2.1. Tall Oil Rosin
- 5.1.2.2. Gum Rosin
- 5.1.2.3. Wood Rosin
- 5.1.3. Turpentine
- 5.1.3.1. Gum/Wood Turpentine
- 5.1.3.2. Crude Sulphate Turpentine
- 5.1.3.3. Other Turpentines
- 5.1.4. Application
- 5.1.4.1. Adhesives and Sealants
- 5.1.4.2. Coatings
- 5.1.4.3. Printing Inks
- 5.1.4.4. Lubricants and Lubricity Additives
- 5.1.4.5. Biofuels
- 5.1.4.6. Paper Sizing
- 5.1.4.7. Rubber
- 5.1.4.8. Soaps and Detergents
- 5.1.4.9. Other Ap
- 5.1.1. Tall Oil
- 5.2. Market Analysis, Insights and Forecast - by Region
- 5.2.1. Asia Pacific
- 5.2.2. North America
- 5.2.3. Europe
- 5.2.4. South America
- 5.2.5. Middle East and Africa
- 5.1. Market Analysis, Insights and Forecast - by Product Type
- 6. Global Pine Chemicals Market Analysis, Insights and Forecast, 2021-2033
- 6.1. Market Analysis, Insights and Forecast - by Product Type
- 6.1.1. Tall Oil
- 6.1.1.1. Crude Tall Oil (CTO)
- 6.1.1.2. Tall Oil Fatty Acid (TOFA)
- 6.1.1.3. Distilled Tall Oil (DTO)
- 6.1.1.4. Tall Oil Pitch (TOP)
- 6.1.2. Rosin
- 6.1.2.1. Tall Oil Rosin
- 6.1.2.2. Gum Rosin
- 6.1.2.3. Wood Rosin
- 6.1.3. Turpentine
- 6.1.3.1. Gum/Wood Turpentine
- 6.1.3.2. Crude Sulphate Turpentine
- 6.1.3.3. Other Turpentines
- 6.1.4. Application
- 6.1.4.1. Adhesives and Sealants
- 6.1.4.2. Coatings
- 6.1.4.3. Printing Inks
- 6.1.4.4. Lubricants and Lubricity Additives
- 6.1.4.5. Biofuels
- 6.1.4.6. Paper Sizing
- 6.1.4.7. Rubber
- 6.1.4.8. Soaps and Detergents
- 6.1.4.9. Other Ap
- 6.1.1. Tall Oil
- 6.1. Market Analysis, Insights and Forecast - by Product Type
- 7. Asia Pacific Pine Chemicals Market Analysis, Insights and Forecast, 2020-2032
- 7.1. Market Analysis, Insights and Forecast - by Product Type
- 7.1.1. Tall Oil
- 7.1.1.1. Crude Tall Oil (CTO)
- 7.1.1.2. Tall Oil Fatty Acid (TOFA)
- 7.1.1.3. Distilled Tall Oil (DTO)
- 7.1.1.4. Tall Oil Pitch (TOP)
- 7.1.2. Rosin
- 7.1.2.1. Tall Oil Rosin
- 7.1.2.2. Gum Rosin
- 7.1.2.3. Wood Rosin
- 7.1.3. Turpentine
- 7.1.3.1. Gum/Wood Turpentine
- 7.1.3.2. Crude Sulphate Turpentine
- 7.1.3.3. Other Turpentines
- 7.1.4. Application
- 7.1.4.1. Adhesives and Sealants
- 7.1.4.2. Coatings
- 7.1.4.3. Printing Inks
- 7.1.4.4. Lubricants and Lubricity Additives
- 7.1.4.5. Biofuels
- 7.1.4.6. Paper Sizing
- 7.1.4.7. Rubber
- 7.1.4.8. Soaps and Detergents
- 7.1.4.9. Other Ap
- 7.1.1. Tall Oil
- 7.1. Market Analysis, Insights and Forecast - by Product Type
- 8. North America Pine Chemicals Market Analysis, Insights and Forecast, 2020-2032
- 8.1. Market Analysis, Insights and Forecast - by Product Type
- 8.1.1. Tall Oil
- 8.1.1.1. Crude Tall Oil (CTO)
- 8.1.1.2. Tall Oil Fatty Acid (TOFA)
- 8.1.1.3. Distilled Tall Oil (DTO)
- 8.1.1.4. Tall Oil Pitch (TOP)
- 8.1.2. Rosin
- 8.1.2.1. Tall Oil Rosin
- 8.1.2.2. Gum Rosin
- 8.1.2.3. Wood Rosin
- 8.1.3. Turpentine
- 8.1.3.1. Gum/Wood Turpentine
- 8.1.3.2. Crude Sulphate Turpentine
- 8.1.3.3. Other Turpentines
- 8.1.4. Application
- 8.1.4.1. Adhesives and Sealants
- 8.1.4.2. Coatings
- 8.1.4.3. Printing Inks
- 8.1.4.4. Lubricants and Lubricity Additives
- 8.1.4.5. Biofuels
- 8.1.4.6. Paper Sizing
- 8.1.4.7. Rubber
- 8.1.4.8. Soaps and Detergents
- 8.1.4.9. Other Ap
- 8.1.1. Tall Oil
- 8.1. Market Analysis, Insights and Forecast - by Product Type
- 9. Europe Pine Chemicals Market Analysis, Insights and Forecast, 2020-2032
- 9.1. Market Analysis, Insights and Forecast - by Product Type
- 9.1.1. Tall Oil
- 9.1.1.1. Crude Tall Oil (CTO)
- 9.1.1.2. Tall Oil Fatty Acid (TOFA)
- 9.1.1.3. Distilled Tall Oil (DTO)
- 9.1.1.4. Tall Oil Pitch (TOP)
- 9.1.2. Rosin
- 9.1.2.1. Tall Oil Rosin
- 9.1.2.2. Gum Rosin
- 9.1.2.3. Wood Rosin
- 9.1.3. Turpentine
- 9.1.3.1. Gum/Wood Turpentine
- 9.1.3.2. Crude Sulphate Turpentine
- 9.1.3.3. Other Turpentines
- 9.1.4. Application
- 9.1.4.1. Adhesives and Sealants
- 9.1.4.2. Coatings
- 9.1.4.3. Printing Inks
- 9.1.4.4. Lubricants and Lubricity Additives
- 9.1.4.5. Biofuels
- 9.1.4.6. Paper Sizing
- 9.1.4.7. Rubber
- 9.1.4.8. Soaps and Detergents
- 9.1.4.9. Other Ap
- 9.1.1. Tall Oil
- 9.1. Market Analysis, Insights and Forecast - by Product Type
- 10. South America Pine Chemicals Market Analysis, Insights and Forecast, 2020-2032
- 10.1. Market Analysis, Insights and Forecast - by Product Type
- 10.1.1. Tall Oil
- 10.1.1.1. Crude Tall Oil (CTO)
- 10.1.1.2. Tall Oil Fatty Acid (TOFA)
- 10.1.1.3. Distilled Tall Oil (DTO)
- 10.1.1.4. Tall Oil Pitch (TOP)
- 10.1.2. Rosin
- 10.1.2.1. Tall Oil Rosin
- 10.1.2.2. Gum Rosin
- 10.1.2.3. Wood Rosin
- 10.1.3. Turpentine
- 10.1.3.1. Gum/Wood Turpentine
- 10.1.3.2. Crude Sulphate Turpentine
- 10.1.3.3. Other Turpentines
- 10.1.4. Application
- 10.1.4.1. Adhesives and Sealants
- 10.1.4.2. Coatings
- 10.1.4.3. Printing Inks
- 10.1.4.4. Lubricants and Lubricity Additives
- 10.1.4.5. Biofuels
- 10.1.4.6. Paper Sizing
- 10.1.4.7. Rubber
- 10.1.4.8. Soaps and Detergents
- 10.1.4.9. Other Ap
- 10.1.1. Tall Oil
- 10.1. Market Analysis, Insights and Forecast - by Product Type
- 11. Middle East and Africa Pine Chemicals Market Analysis, Insights and Forecast, 2020-2032
- 11.1. Market Analysis, Insights and Forecast - by Product Type
- 11.1.1. Tall Oil
- 11.1.1.1. Crude Tall Oil (CTO)
- 11.1.1.2. Tall Oil Fatty Acid (TOFA)
- 11.1.1.3. Distilled Tall Oil (DTO)
- 11.1.1.4. Tall Oil Pitch (TOP)
- 11.1.2. Rosin
- 11.1.2.1. Tall Oil Rosin
- 11.1.2.2. Gum Rosin
- 11.1.2.3. Wood Rosin
- 11.1.3. Turpentine
- 11.1.3.1. Gum/Wood Turpentine
- 11.1.3.2. Crude Sulphate Turpentine
- 11.1.3.3. Other Turpentines
- 11.1.4. Application
- 11.1.4.1. Adhesives and Sealants
- 11.1.4.2. Coatings
- 11.1.4.3. Printing Inks
- 11.1.4.4. Lubricants and Lubricity Additives
- 11.1.4.5. Biofuels
- 11.1.4.6. Paper Sizing
- 11.1.4.7. Rubber
- 11.1.4.8. Soaps and Detergents
- 11.1.4.9. Other Ap
- 11.1.1. Tall Oil
- 11.1. Market Analysis, Insights and Forecast - by Product Type
- 12. Competitive Analysis
- 12.1. Company Profiles
- 12.1.1 Sunpine AB
- 12.1.1.1. Company Overview
- 12.1.1.2. Products
- 12.1.1.3. Company Financials
- 12.1.1.4. SWOT Analysis
- 12.1.2 Kraton Corporation
- 12.1.2.1. Company Overview
- 12.1.2.2. Products
- 12.1.2.3. Company Financials
- 12.1.2.4. SWOT Analysis
- 12.1.3 Pine Chemical Group
- 12.1.3.1. Company Overview
- 12.1.3.2. Products
- 12.1.3.3. Company Financials
- 12.1.3.4. SWOT Analysis
- 12.1.4 Respol Resinas SA
- 12.1.4.1. Company Overview
- 12.1.4.2. Products
- 12.1.4.3. Company Financials
- 12.1.4.4. SWOT Analysis
- 12.1.5 Mercer International
- 12.1.5.1. Company Overview
- 12.1.5.2. Products
- 12.1.5.3. Company Financials
- 12.1.5.4. SWOT Analysis
- 12.1.6 Harima Chemicals Group Inc
- 12.1.6.1. Company Overview
- 12.1.6.2. Products
- 12.1.6.3. Company Financials
- 12.1.6.4. SWOT Analysis
- 12.1.7 OOO Torgoviy Dom Lesokhimik
- 12.1.7.1. Company Overview
- 12.1.7.2. Products
- 12.1.7.3. Company Financials
- 12.1.7.4. SWOT Analysis
- 12.1.8 Ingevity Corporation
- 12.1.8.1. Company Overview
- 12.1.8.2. Products
- 12.1.8.3. Company Financials
- 12.1.8.4. SWOT Analysis
- 12.1.9 Forchem Oyj
- 12.1.9.1. Company Overview
- 12.1.9.2. Products
- 12.1.9.3. Company Financials
- 12.1.9.4. SWOT Analysis
- 12.1.10 Synthomer Plc
- 12.1.10.1. Company Overview
- 12.1.10.2. Products
- 12.1.10.3. Company Financials
- 12.1.10.4. SWOT Analysis
- 12.1.11 Arakawa Chemical Industries Ltd
- 12.1.11.1. Company Overview
- 12.1.11.2. Products
- 12.1.11.3. Company Financials
- 12.1.11.4. SWOT Analysis
- 12.1.12 DRT (Dérivés Résiniques et Terpéniques)
- 12.1.12.1. Company Overview
- 12.1.12.2. Products
- 12.1.12.3. Company Financials
- 12.1.12.4. SWOT Analysis
- 12.1.1 Sunpine AB
- 12.2. Market Entropy
- 12.2.1 Company's Key Areas Served
- 12.2.2 Recent Developments
- 12.3. Company Market Share Analysis 2025
- 12.3.1 Top 5 Companies Market Share Analysis
- 12.3.2 Top 3 Companies Market Share Analysis
- 12.4. List of Potential Customers
- 13. Research Methodology
List of Figures
- Figure 1: Global Pine Chemicals Market Revenue Breakdown (billion, %) by Region 2025 & 2033
- Figure 2: Global Pine Chemicals Market Volume Breakdown (K Tons, %) by Region 2025 & 2033
- Figure 3: Asia Pacific Pine Chemicals Market Revenue (billion), by Product Type 2025 & 2033
- Figure 4: Asia Pacific Pine Chemicals Market Volume (K Tons), by Product Type 2025 & 2033
- Figure 5: Asia Pacific Pine Chemicals Market Revenue Share (%), by Product Type 2025 & 2033
- Figure 6: Asia Pacific Pine Chemicals Market Volume Share (%), by Product Type 2025 & 2033
- Figure 7: Asia Pacific Pine Chemicals Market Revenue (billion), by Country 2025 & 2033
- Figure 8: Asia Pacific Pine Chemicals Market Volume (K Tons), by Country 2025 & 2033
- Figure 9: Asia Pacific Pine Chemicals Market Revenue Share (%), by Country 2025 & 2033
- Figure 10: Asia Pacific Pine Chemicals Market Volume Share (%), by Country 2025 & 2033
- Figure 11: North America Pine Chemicals Market Revenue (billion), by Product Type 2025 & 2033
- Figure 12: North America Pine Chemicals Market Volume (K Tons), by Product Type 2025 & 2033
- Figure 13: North America Pine Chemicals Market Revenue Share (%), by Product Type 2025 & 2033
- Figure 14: North America Pine Chemicals Market Volume Share (%), by Product Type 2025 & 2033
- Figure 15: North America Pine Chemicals Market Revenue (billion), by Country 2025 & 2033
- Figure 16: North America Pine Chemicals Market Volume (K Tons), by Country 2025 & 2033
- Figure 17: North America Pine Chemicals Market Revenue Share (%), by Country 2025 & 2033
- Figure 18: North America Pine Chemicals Market Volume Share (%), by Country 2025 & 2033
- Figure 19: Europe Pine Chemicals Market Revenue (billion), by Product Type 2025 & 2033
- Figure 20: Europe Pine Chemicals Market Volume (K Tons), by Product Type 2025 & 2033
- Figure 21: Europe Pine Chemicals Market Revenue Share (%), by Product Type 2025 & 2033
- Figure 22: Europe Pine Chemicals Market Volume Share (%), by Product Type 2025 & 2033
- Figure 23: Europe Pine Chemicals Market Revenue (billion), by Country 2025 & 2033
- Figure 24: Europe Pine Chemicals Market Volume (K Tons), by Country 2025 & 2033
- Figure 25: Europe Pine Chemicals Market Revenue Share (%), by Country 2025 & 2033
- Figure 26: Europe Pine Chemicals Market Volume Share (%), by Country 2025 & 2033
- Figure 27: South America Pine Chemicals Market Revenue (billion), by Product Type 2025 & 2033
- Figure 28: South America Pine Chemicals Market Volume (K Tons), by Product Type 2025 & 2033
- Figure 29: South America Pine Chemicals Market Revenue Share (%), by Product Type 2025 & 2033
- Figure 30: South America Pine Chemicals Market Volume Share (%), by Product Type 2025 & 2033
- Figure 31: South America Pine Chemicals Market Revenue (billion), by Country 2025 & 2033
- Figure 32: South America Pine Chemicals Market Volume (K Tons), by Country 2025 & 2033
- Figure 33: South America Pine Chemicals Market Revenue Share (%), by Country 2025 & 2033
- Figure 34: South America Pine Chemicals Market Volume Share (%), by Country 2025 & 2033
- Figure 35: Middle East and Africa Pine Chemicals Market Revenue (billion), by Product Type 2025 & 2033
- Figure 36: Middle East and Africa Pine Chemicals Market Volume (K Tons), by Product Type 2025 & 2033
- Figure 37: Middle East and Africa Pine Chemicals Market Revenue Share (%), by Product Type 2025 & 2033
- Figure 38: Middle East and Africa Pine Chemicals Market Volume Share (%), by Product Type 2025 & 2033
- Figure 39: Middle East and Africa Pine Chemicals Market Revenue (billion), by Country 2025 & 2033
- Figure 40: Middle East and Africa Pine Chemicals Market Volume (K Tons), by Country 2025 & 2033
- Figure 41: Middle East and Africa Pine Chemicals Market Revenue Share (%), by Country 2025 & 2033
- Figure 42: Middle East and Africa Pine Chemicals Market Volume Share (%), by Country 2025 & 2033
List of Tables
- Table 1: Global Pine Chemicals Market Revenue billion Forecast, by Product Type 2020 & 2033
- Table 2: Global Pine Chemicals Market Volume K Tons Forecast, by Product Type 2020 & 2033
- Table 3: Global Pine Chemicals Market Revenue billion Forecast, by Region 2020 & 2033
- Table 4: Global Pine Chemicals Market Volume K Tons Forecast, by Region 2020 & 2033
- Table 5: Global Pine Chemicals Market Revenue billion Forecast, by Product Type 2020 & 2033
- Table 6: Global Pine Chemicals Market Volume K Tons Forecast, by Product Type 2020 & 2033
- Table 7: Global Pine Chemicals Market Revenue billion Forecast, by Country 2020 & 2033
- Table 8: Global Pine Chemicals Market Volume K Tons Forecast, by Country 2020 & 2033
- Table 9: China Pine Chemicals Market Revenue (billion) Forecast, by Application 2020 & 2033
- Table 10: China Pine Chemicals Market Volume (K Tons) Forecast, by Application 2020 & 2033
- Table 11: India Pine Chemicals Market Revenue (billion) Forecast, by Application 2020 & 2033
- Table 12: India Pine Chemicals Market Volume (K Tons) Forecast, by Application 2020 & 2033
- Table 13: Japan Pine Chemicals Market Revenue (billion) Forecast, by Application 2020 & 2033
- Table 14: Japan Pine Chemicals Market Volume (K Tons) Forecast, by Application 2020 & 2033
- Table 15: South Korea Pine Chemicals Market Revenue (billion) Forecast, by Application 2020 & 2033
- Table 16: South Korea Pine Chemicals Market Volume (K Tons) Forecast, by Application 2020 & 2033
- Table 17: ASEAN Countries Pine Chemicals Market Revenue (billion) Forecast, by Application 2020 & 2033
- Table 18: ASEAN Countries Pine Chemicals Market Volume (K Tons) Forecast, by Application 2020 & 2033
- Table 19: Rest of Asia Pacific Pine Chemicals Market Revenue (billion) Forecast, by Application 2020 & 2033
- Table 20: Rest of Asia Pacific Pine Chemicals Market Volume (K Tons) Forecast, by Application 2020 & 2033
- Table 21: Global Pine Chemicals Market Revenue billion Forecast, by Product Type 2020 & 2033
- Table 22: Global Pine Chemicals Market Volume K Tons Forecast, by Product Type 2020 & 2033
- Table 23: Global Pine Chemicals Market Revenue billion Forecast, by Country 2020 & 2033
- Table 24: Global Pine Chemicals Market Volume K Tons Forecast, by Country 2020 & 2033
- Table 25: United States Pine Chemicals Market Revenue (billion) Forecast, by Application 2020 & 2033
- Table 26: United States Pine Chemicals Market Volume (K Tons) Forecast, by Application 2020 & 2033
- Table 27: Canada Pine Chemicals Market Revenue (billion) Forecast, by Application 2020 & 2033
- Table 28: Canada Pine Chemicals Market Volume (K Tons) Forecast, by Application 2020 & 2033
- Table 29: Mexico Pine Chemicals Market Revenue (billion) Forecast, by Application 2020 & 2033
- Table 30: Mexico Pine Chemicals Market Volume (K Tons) Forecast, by Application 2020 & 2033
- Table 31: Global Pine Chemicals Market Revenue billion Forecast, by Product Type 2020 & 2033
- Table 32: Global Pine Chemicals Market Volume K Tons Forecast, by Product Type 2020 & 2033
- Table 33: Global Pine Chemicals Market Revenue billion Forecast, by Country 2020 & 2033
- Table 34: Global Pine Chemicals Market Volume K Tons Forecast, by Country 2020 & 2033
- Table 35: Germany Pine Chemicals Market Revenue (billion) Forecast, by Application 2020 & 2033
- Table 36: Germany Pine Chemicals Market Volume (K Tons) Forecast, by Application 2020 & 2033
- Table 37: United Kingdom Pine Chemicals Market Revenue (billion) Forecast, by Application 2020 & 2033
- Table 38: United Kingdom Pine Chemicals Market Volume (K Tons) Forecast, by Application 2020 & 2033
- Table 39: Italy Pine Chemicals Market Revenue (billion) Forecast, by Application 2020 & 2033
- Table 40: Italy Pine Chemicals Market Volume (K Tons) Forecast, by Application 2020 & 2033
- Table 41: France Pine Chemicals Market Revenue (billion) Forecast, by Application 2020 & 2033
- Table 42: France Pine Chemicals Market Volume (K Tons) Forecast, by Application 2020 & 2033
- Table 43: Rest of Europe Pine Chemicals Market Revenue (billion) Forecast, by Application 2020 & 2033
- Table 44: Rest of Europe Pine Chemicals Market Volume (K Tons) Forecast, by Application 2020 & 2033
- Table 45: Global Pine Chemicals Market Revenue billion Forecast, by Product Type 2020 & 2033
- Table 46: Global Pine Chemicals Market Volume K Tons Forecast, by Product Type 2020 & 2033
- Table 47: Global Pine Chemicals Market Revenue billion Forecast, by Country 2020 & 2033
- Table 48: Global Pine Chemicals Market Volume K Tons Forecast, by Country 2020 & 2033
- Table 49: Brazil Pine Chemicals Market Revenue (billion) Forecast, by Application 2020 & 2033
- Table 50: Brazil Pine Chemicals Market Volume (K Tons) Forecast, by Application 2020 & 2033
- Table 51: Argentina Pine Chemicals Market Revenue (billion) Forecast, by Application 2020 & 2033
- Table 52: Argentina Pine Chemicals Market Volume (K Tons) Forecast, by Application 2020 & 2033
- Table 53: Rest of South America Pine Chemicals Market Revenue (billion) Forecast, by Application 2020 & 2033
- Table 54: Rest of South America Pine Chemicals Market Volume (K Tons) Forecast, by Application 2020 & 2033
- Table 55: Global Pine Chemicals Market Revenue billion Forecast, by Product Type 2020 & 2033
- Table 56: Global Pine Chemicals Market Volume K Tons Forecast, by Product Type 2020 & 2033
- Table 57: Global Pine Chemicals Market Revenue billion Forecast, by Country 2020 & 2033
- Table 58: Global Pine Chemicals Market Volume K Tons Forecast, by Country 2020 & 2033
- Table 59: Saudi Arabia Pine Chemicals Market Revenue (billion) Forecast, by Application 2020 & 2033
- Table 60: Saudi Arabia Pine Chemicals Market Volume (K Tons) Forecast, by Application 2020 & 2033
- Table 61: South Africa Pine Chemicals Market Revenue (billion) Forecast, by Application 2020 & 2033
- Table 62: South Africa Pine Chemicals Market Volume (K Tons) Forecast, by Application 2020 & 2033
- Table 63: Rest of Middle East and Africa Pine Chemicals Market Revenue (billion) Forecast, by Application 2020 & 2033
- Table 64: Rest of Middle East and Africa Pine Chemicals Market Volume (K Tons) Forecast, by Application 2020 & 2033
Frequently Asked Questions
1. What is the projected Compound Annual Growth Rate (CAGR) of the Pine Chemicals Market?
The projected CAGR is approximately 5%.
2. Which companies are prominent players in the Pine Chemicals Market?
Key companies in the market include Sunpine AB, Kraton Corporation, Pine Chemical Group, Respol Resinas SA, Mercer International, Harima Chemicals Group Inc, OOO Torgoviy Dom Lesokhimik, Ingevity Corporation, Forchem Oyj, Synthomer Plc, Arakawa Chemical Industries Ltd, DRT (Dérivés Résiniques et Terpéniques).
3. What are the main segments of the Pine Chemicals Market?
The market segments include Product Type.
4. Can you provide details about the market size?
The market size is estimated to be USD 17.3 billion as of 2022.
5. What are some drivers contributing to market growth?
Increasing Demand for Pine Chemicals in Mining and Flotation Chemicals and Lubricants; Increasing Demand from the Flavors and Fragrances Industry.
6. What are the notable trends driving market growth?
The Adhesives and Sealants Segment is expected to Dominate the Market.
7. Are there any restraints impacting market growth?
Diversion of CTO to Biofuels due to Government Incentives; Increase in the Availability of Cheaper Substitutes.
8. Can you provide examples of recent developments in the market?
March 2024: Brazilian pine chemicals group agrees to take over Pinopine, Portugal, gum rosin derivatives manufacturer. Grupo Resinas brasil (RB), one of the largest Brazilian pine chemicals producers, takes the majority share in derivatives producer Pinopine, located in Portugal.
9. What pricing options are available for accessing the report?
Pricing options include single-user, multi-user, and enterprise licenses priced at USD 4750, USD 5250, and USD 8750 respectively.
10. Is the market size provided in terms of value or volume?
The market size is provided in terms of value, measured in billion and volume, measured in K Tons.
11. Are there any specific market keywords associated with the report?
Yes, the market keyword associated with the report is "Pine Chemicals Market," which aids in identifying and referencing the specific market segment covered.
12. How do I determine which pricing option suits my needs best?
The pricing options vary based on user requirements and access needs. Individual users may opt for single-user licenses, while businesses requiring broader access may choose multi-user or enterprise licenses for cost-effective access to the report.
13. Are there any additional resources or data provided in the Pine Chemicals Market report?
While the report offers comprehensive insights, it's advisable to review the specific contents or supplementary materials provided to ascertain if additional resources or data are available.
14. How can I stay updated on further developments or reports in the Pine Chemicals Market?
To stay informed about further developments, trends, and reports in the Pine Chemicals Market, consider subscribing to industry newsletters, following relevant companies and organizations, or regularly checking reputable industry news sources and publications.
Methodology
Step 1 - Identification of Relevant Samples Size from Population Database


Step 2 - Approaches for Defining Global Market Size (Value, Volume* & Price*)

Note*: In applicable scenarios
Step 3 - Data Sources
Primary Research
- Web Analytics
- Survey Reports
- Research Institute
- Latest Research Reports
- Opinion Leaders
Secondary Research
- Annual Reports
- White Paper
- Latest Press Release
- Industry Association
- Paid Database
- Investor Presentations

Step 4 - Data Triangulation
Involves using different sources of information in order to increase the validity of a study
These sources are likely to be stakeholders in a program - participants, other researchers, program staff, other community members, and so on.
Then we put all data in single framework & apply various statistical tools to find out the dynamic on the market.
During the analysis stage, feedback from the stakeholder groups would be compared to determine areas of agreement as well as areas of divergence