

Key Insights
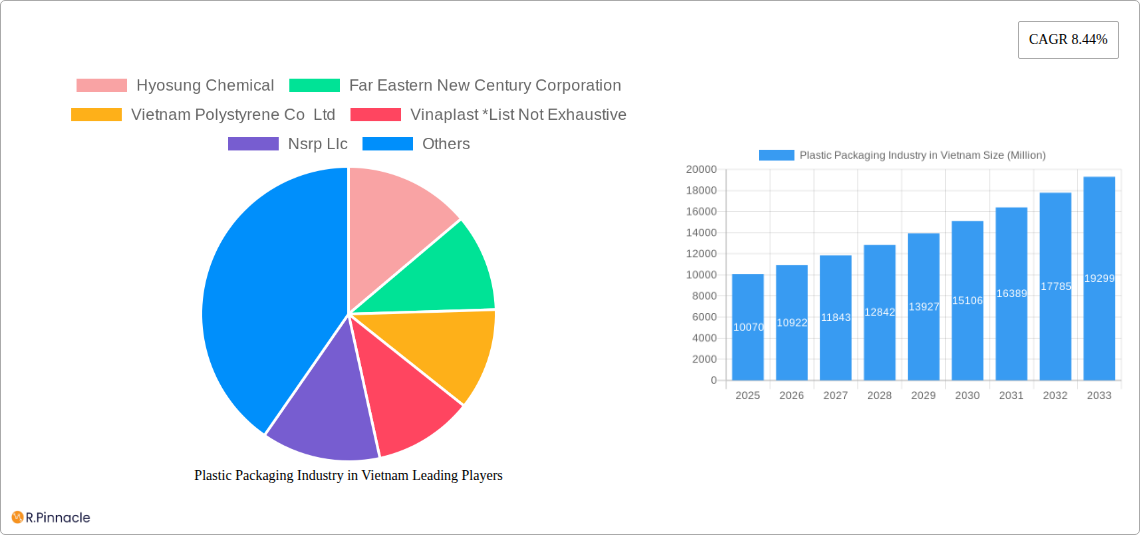
The Vietnamese plastic packaging market, valued at approximately $14.4 billion in 2025, is projected for significant expansion at a compound annual growth rate (CAGR) of 8.21% from 2025 to 2033. This growth is propelled by Vietnam's expanding consumer goods sector, particularly food and beverage, personal care, and electronics, alongside the burgeoning e-commerce industry's demand for protective packaging. While environmental concerns are fostering interest in sustainable alternatives like bioplastics, traditional plastics continue to lead due to cost-effectiveness and convenience. However, government initiatives and rising consumer preference for eco-friendly options are expected to drive a gradual market shift towards bioplastics and recycled content. The injection molding segment is anticipated to dominate due to its versatility across numerous packaging applications. Key market players, including Hyosung Chemical and Far Eastern New Century Corporation, are investing in capacity and technological enhancements to meet escalating demand.
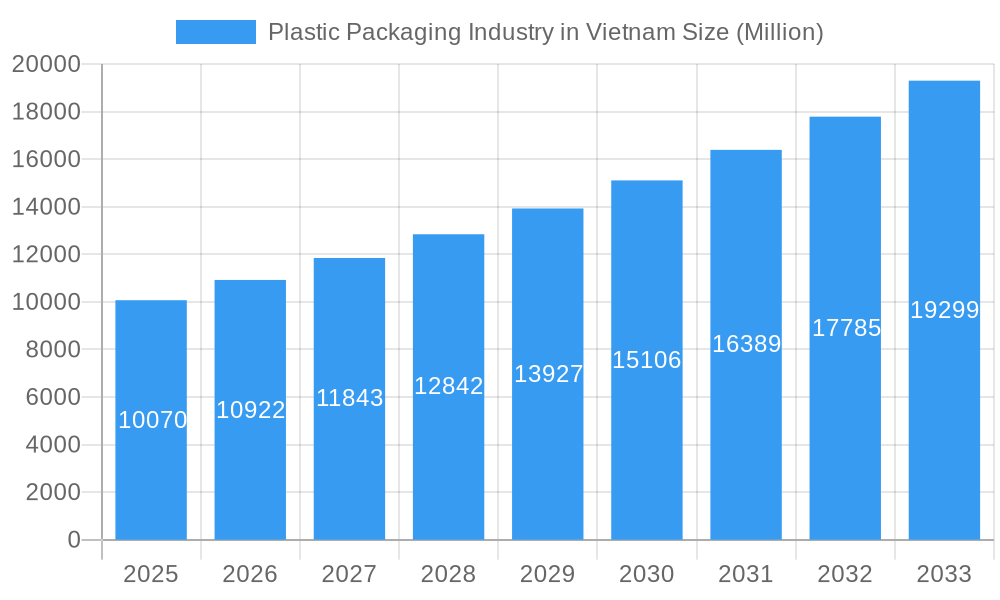
Plastic Packaging Industry in Vietnam Market Size (In Billion)
Market segmentation highlights the dominance of traditional plastics such as polyethylene and polypropylene. The engineering plastics segment, encompassing PVC and others, is experiencing steady growth for specialized, high-durability applications. Bioplastics, though currently a smaller segment, present a substantial growth opportunity, driven by environmental awareness and sustainability initiatives. Packaging applications represent the largest segment, followed by electrical and electronics. Automotive and transportation sectors show promising growth, linked to vehicle manufacturing and exports. The building and construction sector, a significant plastic consumer, is projected for slower growth compared to other segments. While regional variations may exist within Vietnam, detailed regional data is unavailable. The overall outlook for Vietnam's plastic packaging market is highly positive, offering ample scope for growth and innovation.
Plastic Packaging Industry in Vietnam Company Market Share
This comprehensive report analyzes Vietnam's plastic packaging industry, providing critical insights for professionals, investors, and decision-makers. With a study period from 2019-2033, a base year of 2025, and a forecast period of 2025-2033, the report utilizes extensive data analysis to deliver actionable intelligence. Coverage includes market size, segmentation, key players, growth drivers, challenges, and future opportunities, offering a 360-degree view of this dynamic sector. All values are expressed in millions.
Plastic Packaging Industry in Vietnam Market Structure & Innovation Trends
This section analyzes the competitive landscape, innovation drivers, and regulatory environment of Vietnam's plastic packaging industry. The market is characterized by a mix of large multinational corporations and smaller domestic players. Market concentration is moderate, with the top 5 players holding an estimated xx% market share in 2025. Innovation is driven by increasing demand for sustainable packaging solutions, technological advancements in manufacturing processes, and government regulations promoting circular economy initiatives.
- Key Players & Market Share (2025 Estimate): Hyosung Chemical (xx%), Far Eastern New Century Corporation (xx%), Vietnam Polystyrene Co Ltd (xx%), Vinaplast (xx%), Others (xx%).
- M&A Activity: The industry has witnessed several mergers and acquisitions in recent years, with deal values totaling approximately xx Million USD in the period 2019-2024. These activities indicate a trend towards consolidation and expansion within the market.
- Regulatory Framework: The Vietnamese government is actively implementing regulations to address environmental concerns related to plastic waste, influencing innovation toward biodegradable and recyclable packaging options.
- Product Substitutes: Growing consumer awareness of environmental issues is driving demand for eco-friendly alternatives like paper, cardboard, and bioplastics, creating competitive pressure within the market.
Plastic Packaging Industry in Vietnam Market Dynamics & Trends
The Vietnamese plastic packaging market exhibits robust growth, driven by a burgeoning consumer goods sector, increasing disposable incomes, and rising demand for packaged food and beverages. The market is expected to witness a Compound Annual Growth Rate (CAGR) of xx% during the forecast period (2025-2033). This growth is further fueled by advancements in packaging technologies, evolving consumer preferences, and the expanding e-commerce sector. However, competitive pressures and environmental regulations present ongoing challenges. Market penetration of sustainable packaging options is increasing, albeit from a low base, with an estimated xx% market share in 2025.
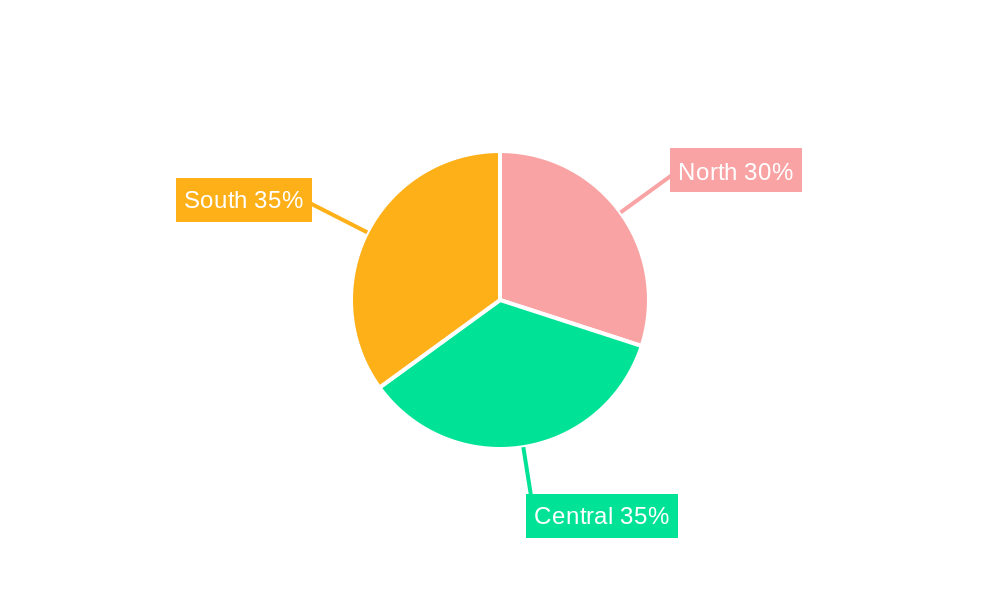
Dominant Regions & Segments in Plastic Packaging Industry in Vietnam
The Southern region of Vietnam dominates the plastic packaging market, driven by its advanced industrial infrastructure, proximity to key export markets, and concentration of manufacturing facilities.
Dominant Segments:
- By Type: Traditional plastics (e.g., polyethylene, polypropylene) continue to hold the largest market share, but bioplastics are experiencing rapid growth, driven by environmental concerns.
- By Technology: Injection molding and extrusion are the most widely used technologies, accounting for the majority of production volume. Blow molding also holds a significant share, especially for beverage packaging.
- By Application: Packaging for food and beverages constitutes the largest application segment, followed by the consumer goods and industrial sectors.
Key Drivers for Dominant Segments:
- Economic Growth: Rapid economic expansion in Vietnam fuels demand for consumer goods, bolstering the packaging industry.
- Infrastructure Development: Investments in industrial parks and logistics networks support manufacturing and distribution within the packaging sector.
- Government Policies: Favorable government policies and incentives encourage foreign investment and technological advancements.
Plastic Packaging Industry in Vietnam Product Innovations
Recent innovations focus on enhancing material properties for improved barrier protection, lighter weight, and recyclability. This includes the introduction of advanced bioplastics with enhanced performance characteristics, and the development of innovative packaging designs that minimize material usage and improve sustainability. Technological trends towards automation and precision manufacturing are also driving product innovation.
Report Scope & Segmentation Analysis
This report comprehensively segments the Vietnamese plastic packaging market by type (Traditional Plastics, Polyvinyl Chloride, Engineering Plastics, Other Engineering Plastics, Bioplastics), technology (Blow Molding, Extrusion, Injection Molding, Other Technologies), and application (Packaging, Electrical and Electronics, Building and Construction, Automotive and Transportation, Housewares, Furniture and Bedding, Other Applications). Each segment’s growth projection, market size (2025), and competitive dynamics are analyzed within the report. For example, the Packaging application segment is projected to reach xx Million USD in 2025, showcasing strong growth potential.
Key Drivers of Plastic Packaging Industry in Vietnam Growth
Several factors contribute to the growth of Vietnam's plastic packaging industry:
- Rising Consumption: Increased disposable incomes and a growing middle class fuel demand for packaged goods.
- Foreign Investment: Significant foreign direct investment in the manufacturing sector spurs industry expansion.
- Government Support: Supportive government policies, including industrial park development and tax incentives, boost growth.
Challenges in the Plastic Packaging Industry in Vietnam Sector
Challenges include:
- Environmental Regulations: Stringent environmental regulations related to plastic waste management present compliance costs and operational challenges.
- Fluctuating Raw Material Prices: Reliance on imported raw materials makes the industry vulnerable to price volatility.
- Intense Competition: A competitive market landscape requires ongoing innovation and efficiency improvements to maintain market share.
Emerging Opportunities in Plastic Packaging Industry in Vietnam
Opportunities include:
- Bioplastics Market: Growing demand for sustainable packaging solutions creates opportunities for bioplastic manufacturers.
- E-commerce Boom: The rapid expansion of e-commerce increases demand for protective and convenient packaging solutions.
- Specialized Packaging: Demand for specialized packaging for specific industries (e.g., pharmaceuticals, healthcare) offers niche market opportunities.
Leading Players in the Plastic Packaging Industry in Vietnam Market
- Hyosung Chemical
- Far Eastern New Century Corporation
- Vietnam Polystyrene Co Ltd
- Vinaplast
- Nsrp Llc
- Toray Industries Inc
- Nan Ya Plastics Corporation
- AGC Inc
- Vietnam Oil And Gas Group
- SCG Chemicals Public Company Limited
- LyondellBasell Industries Holdings B.V.
- Billion Industrial Holdings Limited
Key Developments in Plastic Packaging Industry in Vietnam Industry
- September 2022: Billion Industrial Holdings Limited announced the expansion of its polyester bottle chip manufacturing facilities in Vietnam, with a planned production capacity of 300,000 tons of polyethylene terephthalate resin.
- August 2022: SCG Chemicals Co. Ltd invested USD 22.7 Million in the AJ Plast project to produce biaxially oriented polyethylene terephthalate (BOPET) in Vietnam, enhancing its product portfolio.
Future Outlook for Plastic Packaging Industry in Vietnam Market
The Vietnamese plastic packaging market is poised for continued growth, driven by increasing consumer spending, industrial expansion, and technological advancements. Strategic opportunities lie in embracing sustainable practices, investing in advanced manufacturing technologies, and catering to evolving consumer preferences for convenience and eco-friendly packaging options. The market’s future hinges on navigating environmental regulations effectively and capitalizing on emerging trends in e-commerce and specialized packaging solutions.
Plastic Packaging Industry in Vietnam Segmentation
-
1. Type
-
1.1. Traditional Plastics
- 1.1.1. Polyethylene
- 1.1.2. Polypropylene
- 1.1.3. Polystyrene
- 1.1.4. Polyvinyl Chloride
-
1.2. Engineering Plastics
- 1.2.1. Polyurethanes
- 1.2.2. Fluoropolymers
- 1.2.3. Polyamides
- 1.2.4. Polycarbonates
- 1.2.5. Styrene Copolymers (ABS and SAN)
- 1.2.6. Thermoplastic Polyesters
- 1.2.7. Other Engineering Plastics
- 1.3. Bioplastics
-
1.1. Traditional Plastics
-
2. Technology
- 2.1. Blow Molding
- 2.2. Extrusion
- 2.3. Injection Molding
- 2.4. Other Technologies
-
3. Application
- 3.1. Packaging
- 3.2. Electrical and Electronics
- 3.3. Building and Construction
- 3.4. Automotive and Transportation
- 3.5. Housewares
- 3.6. Furniture and Bedding
- 3.7. Other Applications
Plastic Packaging Industry in Vietnam Segmentation By Geography
-
1. North America
- 1.1. United States
- 1.2. Canada
- 1.3. Mexico
-
2. South America
- 2.1. Brazil
- 2.2. Argentina
- 2.3. Rest of South America
-
3. Europe
- 3.1. United Kingdom
- 3.2. Germany
- 3.3. France
- 3.4. Italy
- 3.5. Spain
- 3.6. Russia
- 3.7. Benelux
- 3.8. Nordics
- 3.9. Rest of Europe
-
4. Middle East & Africa
- 4.1. Turkey
- 4.2. Israel
- 4.3. GCC
- 4.4. North Africa
- 4.5. South Africa
- 4.6. Rest of Middle East & Africa
-
5. Asia Pacific
- 5.1. China
- 5.2. India
- 5.3. Japan
- 5.4. South Korea
- 5.5. ASEAN
- 5.6. Oceania
- 5.7. Rest of Asia Pacific
Plastic Packaging Industry in Vietnam Regional Market Share
Geographic Coverage of Plastic Packaging Industry in Vietnam
Plastic Packaging Industry in Vietnam REPORT HIGHLIGHTS
| Aspects | Details |
|---|---|
| Study Period | 2020-2034 |
| Base Year | 2025 |
| Estimated Year | 2026 |
| Forecast Period | 2026-2034 |
| Historical Period | 2020-2025 |
| Growth Rate | CAGR of 8.21% from 2020-2034 |
| Segmentation |
|
Table of Contents
- 1. Introduction
- 1.1. Research Scope
- 1.2. Market Segmentation
- 1.3. Research Objective
- 1.4. Definitions and Assumptions
- 2. Executive Summary
- 2.1. Market Snapshot
- 3. Market Dynamics
- 3.1. Market Drivers
- 3.2. Market Restrains
- 3.3. Market Trends
- 3.4. Market Opportunities
- 4. Market Factor Analysis
- 4.1. Porters Five Forces
- 4.1.1. Bargaining Power of Suppliers
- 4.1.2. Bargaining Power of Buyers
- 4.1.3. Threat of New Entrants
- 4.1.4. Threat of Substitutes
- 4.1.5. Competitive Rivalry
- 4.2. PESTEL analysis
- 4.3. BCG Analysis
- 4.3.1. Stars (High Growth, High Market Share)
- 4.3.2. Cash Cows (Low Growth, High Market Share)
- 4.3.3. Question Mark (High Growth, Low Market Share)
- 4.3.4. Dogs (Low Growth, Low Market Share)
- 4.4. Ansoff Matrix Analysis
- 4.5. Supply Chain Analysis
- 4.6. Regulatory Landscape
- 4.7. Current Market Potential and Opportunity Assessment (TAM–SAM–SOM Framework)
- 4.8. PRI Analyst Note
- 4.1. Porters Five Forces
- 5. Market Analysis, Insights and Forecast 2021-2033
- 5.1. Market Analysis, Insights and Forecast - by Type
- 5.1.1. Traditional Plastics
- 5.1.1.1. Polyethylene
- 5.1.1.2. Polypropylene
- 5.1.1.3. Polystyrene
- 5.1.1.4. Polyvinyl Chloride
- 5.1.2. Engineering Plastics
- 5.1.2.1. Polyurethanes
- 5.1.2.2. Fluoropolymers
- 5.1.2.3. Polyamides
- 5.1.2.4. Polycarbonates
- 5.1.2.5. Styrene Copolymers (ABS and SAN)
- 5.1.2.6. Thermoplastic Polyesters
- 5.1.2.7. Other Engineering Plastics
- 5.1.3. Bioplastics
- 5.1.1. Traditional Plastics
- 5.2. Market Analysis, Insights and Forecast - by Technology
- 5.2.1. Blow Molding
- 5.2.2. Extrusion
- 5.2.3. Injection Molding
- 5.2.4. Other Technologies
- 5.3. Market Analysis, Insights and Forecast - by Application
- 5.3.1. Packaging
- 5.3.2. Electrical and Electronics
- 5.3.3. Building and Construction
- 5.3.4. Automotive and Transportation
- 5.3.5. Housewares
- 5.3.6. Furniture and Bedding
- 5.3.7. Other Applications
- 5.4. Market Analysis, Insights and Forecast - by Region
- 5.4.1. North America
- 5.4.2. South America
- 5.4.3. Europe
- 5.4.4. Middle East & Africa
- 5.4.5. Asia Pacific
- 5.1. Market Analysis, Insights and Forecast - by Type
- 6. Global Plastic Packaging Industry in Vietnam Analysis, Insights and Forecast, 2021-2033
- 6.1. Market Analysis, Insights and Forecast - by Type
- 6.1.1. Traditional Plastics
- 6.1.1.1. Polyethylene
- 6.1.1.2. Polypropylene
- 6.1.1.3. Polystyrene
- 6.1.1.4. Polyvinyl Chloride
- 6.1.2. Engineering Plastics
- 6.1.2.1. Polyurethanes
- 6.1.2.2. Fluoropolymers
- 6.1.2.3. Polyamides
- 6.1.2.4. Polycarbonates
- 6.1.2.5. Styrene Copolymers (ABS and SAN)
- 6.1.2.6. Thermoplastic Polyesters
- 6.1.2.7. Other Engineering Plastics
- 6.1.3. Bioplastics
- 6.1.1. Traditional Plastics
- 6.2. Market Analysis, Insights and Forecast - by Technology
- 6.2.1. Blow Molding
- 6.2.2. Extrusion
- 6.2.3. Injection Molding
- 6.2.4. Other Technologies
- 6.3. Market Analysis, Insights and Forecast - by Application
- 6.3.1. Packaging
- 6.3.2. Electrical and Electronics
- 6.3.3. Building and Construction
- 6.3.4. Automotive and Transportation
- 6.3.5. Housewares
- 6.3.6. Furniture and Bedding
- 6.3.7. Other Applications
- 6.1. Market Analysis, Insights and Forecast - by Type
- 7. North America Plastic Packaging Industry in Vietnam Analysis, Insights and Forecast, 2020-2032
- 7.1. Market Analysis, Insights and Forecast - by Type
- 7.1.1. Traditional Plastics
- 7.1.1.1. Polyethylene
- 7.1.1.2. Polypropylene
- 7.1.1.3. Polystyrene
- 7.1.1.4. Polyvinyl Chloride
- 7.1.2. Engineering Plastics
- 7.1.2.1. Polyurethanes
- 7.1.2.2. Fluoropolymers
- 7.1.2.3. Polyamides
- 7.1.2.4. Polycarbonates
- 7.1.2.5. Styrene Copolymers (ABS and SAN)
- 7.1.2.6. Thermoplastic Polyesters
- 7.1.2.7. Other Engineering Plastics
- 7.1.3. Bioplastics
- 7.1.1. Traditional Plastics
- 7.2. Market Analysis, Insights and Forecast - by Technology
- 7.2.1. Blow Molding
- 7.2.2. Extrusion
- 7.2.3. Injection Molding
- 7.2.4. Other Technologies
- 7.3. Market Analysis, Insights and Forecast - by Application
- 7.3.1. Packaging
- 7.3.2. Electrical and Electronics
- 7.3.3. Building and Construction
- 7.3.4. Automotive and Transportation
- 7.3.5. Housewares
- 7.3.6. Furniture and Bedding
- 7.3.7. Other Applications
- 7.1. Market Analysis, Insights and Forecast - by Type
- 8. South America Plastic Packaging Industry in Vietnam Analysis, Insights and Forecast, 2020-2032
- 8.1. Market Analysis, Insights and Forecast - by Type
- 8.1.1. Traditional Plastics
- 8.1.1.1. Polyethylene
- 8.1.1.2. Polypropylene
- 8.1.1.3. Polystyrene
- 8.1.1.4. Polyvinyl Chloride
- 8.1.2. Engineering Plastics
- 8.1.2.1. Polyurethanes
- 8.1.2.2. Fluoropolymers
- 8.1.2.3. Polyamides
- 8.1.2.4. Polycarbonates
- 8.1.2.5. Styrene Copolymers (ABS and SAN)
- 8.1.2.6. Thermoplastic Polyesters
- 8.1.2.7. Other Engineering Plastics
- 8.1.3. Bioplastics
- 8.1.1. Traditional Plastics
- 8.2. Market Analysis, Insights and Forecast - by Technology
- 8.2.1. Blow Molding
- 8.2.2. Extrusion
- 8.2.3. Injection Molding
- 8.2.4. Other Technologies
- 8.3. Market Analysis, Insights and Forecast - by Application
- 8.3.1. Packaging
- 8.3.2. Electrical and Electronics
- 8.3.3. Building and Construction
- 8.3.4. Automotive and Transportation
- 8.3.5. Housewares
- 8.3.6. Furniture and Bedding
- 8.3.7. Other Applications
- 8.1. Market Analysis, Insights and Forecast - by Type
- 9. Europe Plastic Packaging Industry in Vietnam Analysis, Insights and Forecast, 2020-2032
- 9.1. Market Analysis, Insights and Forecast - by Type
- 9.1.1. Traditional Plastics
- 9.1.1.1. Polyethylene
- 9.1.1.2. Polypropylene
- 9.1.1.3. Polystyrene
- 9.1.1.4. Polyvinyl Chloride
- 9.1.2. Engineering Plastics
- 9.1.2.1. Polyurethanes
- 9.1.2.2. Fluoropolymers
- 9.1.2.3. Polyamides
- 9.1.2.4. Polycarbonates
- 9.1.2.5. Styrene Copolymers (ABS and SAN)
- 9.1.2.6. Thermoplastic Polyesters
- 9.1.2.7. Other Engineering Plastics
- 9.1.3. Bioplastics
- 9.1.1. Traditional Plastics
- 9.2. Market Analysis, Insights and Forecast - by Technology
- 9.2.1. Blow Molding
- 9.2.2. Extrusion
- 9.2.3. Injection Molding
- 9.2.4. Other Technologies
- 9.3. Market Analysis, Insights and Forecast - by Application
- 9.3.1. Packaging
- 9.3.2. Electrical and Electronics
- 9.3.3. Building and Construction
- 9.3.4. Automotive and Transportation
- 9.3.5. Housewares
- 9.3.6. Furniture and Bedding
- 9.3.7. Other Applications
- 9.1. Market Analysis, Insights and Forecast - by Type
- 10. Middle East & Africa Plastic Packaging Industry in Vietnam Analysis, Insights and Forecast, 2020-2032
- 10.1. Market Analysis, Insights and Forecast - by Type
- 10.1.1. Traditional Plastics
- 10.1.1.1. Polyethylene
- 10.1.1.2. Polypropylene
- 10.1.1.3. Polystyrene
- 10.1.1.4. Polyvinyl Chloride
- 10.1.2. Engineering Plastics
- 10.1.2.1. Polyurethanes
- 10.1.2.2. Fluoropolymers
- 10.1.2.3. Polyamides
- 10.1.2.4. Polycarbonates
- 10.1.2.5. Styrene Copolymers (ABS and SAN)
- 10.1.2.6. Thermoplastic Polyesters
- 10.1.2.7. Other Engineering Plastics
- 10.1.3. Bioplastics
- 10.1.1. Traditional Plastics
- 10.2. Market Analysis, Insights and Forecast - by Technology
- 10.2.1. Blow Molding
- 10.2.2. Extrusion
- 10.2.3. Injection Molding
- 10.2.4. Other Technologies
- 10.3. Market Analysis, Insights and Forecast - by Application
- 10.3.1. Packaging
- 10.3.2. Electrical and Electronics
- 10.3.3. Building and Construction
- 10.3.4. Automotive and Transportation
- 10.3.5. Housewares
- 10.3.6. Furniture and Bedding
- 10.3.7. Other Applications
- 10.1. Market Analysis, Insights and Forecast - by Type
- 11. Asia Pacific Plastic Packaging Industry in Vietnam Analysis, Insights and Forecast, 2020-2032
- 11.1. Market Analysis, Insights and Forecast - by Type
- 11.1.1. Traditional Plastics
- 11.1.1.1. Polyethylene
- 11.1.1.2. Polypropylene
- 11.1.1.3. Polystyrene
- 11.1.1.4. Polyvinyl Chloride
- 11.1.2. Engineering Plastics
- 11.1.2.1. Polyurethanes
- 11.1.2.2. Fluoropolymers
- 11.1.2.3. Polyamides
- 11.1.2.4. Polycarbonates
- 11.1.2.5. Styrene Copolymers (ABS and SAN)
- 11.1.2.6. Thermoplastic Polyesters
- 11.1.2.7. Other Engineering Plastics
- 11.1.3. Bioplastics
- 11.1.1. Traditional Plastics
- 11.2. Market Analysis, Insights and Forecast - by Technology
- 11.2.1. Blow Molding
- 11.2.2. Extrusion
- 11.2.3. Injection Molding
- 11.2.4. Other Technologies
- 11.3. Market Analysis, Insights and Forecast - by Application
- 11.3.1. Packaging
- 11.3.2. Electrical and Electronics
- 11.3.3. Building and Construction
- 11.3.4. Automotive and Transportation
- 11.3.5. Housewares
- 11.3.6. Furniture and Bedding
- 11.3.7. Other Applications
- 11.1. Market Analysis, Insights and Forecast - by Type
- 12. Competitive Analysis
- 12.1. Company Profiles
- 12.1.1 Hyosung Chemical
- 12.1.1.1. Company Overview
- 12.1.1.2. Products
- 12.1.1.3. Company Financials
- 12.1.1.4. SWOT Analysis
- 12.1.2 Far Eastern New Century Corporation
- 12.1.2.1. Company Overview
- 12.1.2.2. Products
- 12.1.2.3. Company Financials
- 12.1.2.4. SWOT Analysis
- 12.1.3 Vietnam Polystyrene Co Ltd
- 12.1.3.1. Company Overview
- 12.1.3.2. Products
- 12.1.3.3. Company Financials
- 12.1.3.4. SWOT Analysis
- 12.1.4 Vinaplast *List Not Exhaustive
- 12.1.4.1. Company Overview
- 12.1.4.2. Products
- 12.1.4.3. Company Financials
- 12.1.4.4. SWOT Analysis
- 12.1.5 Nsrp Llc
- 12.1.5.1. Company Overview
- 12.1.5.2. Products
- 12.1.5.3. Company Financials
- 12.1.5.4. SWOT Analysis
- 12.1.6 Toray Industries Inc
- 12.1.6.1. Company Overview
- 12.1.6.2. Products
- 12.1.6.3. Company Financials
- 12.1.6.4. SWOT Analysis
- 12.1.7 Nan Ya Plastics Corporation
- 12.1.7.1. Company Overview
- 12.1.7.2. Products
- 12.1.7.3. Company Financials
- 12.1.7.4. SWOT Analysis
- 12.1.8 Agc Inc
- 12.1.8.1. Company Overview
- 12.1.8.2. Products
- 12.1.8.3. Company Financials
- 12.1.8.4. SWOT Analysis
- 12.1.9 Vietnam Oil And Gas Group
- 12.1.9.1. Company Overview
- 12.1.9.2. Products
- 12.1.9.3. Company Financials
- 12.1.9.4. SWOT Analysis
- 12.1.10 Scg Chemicals Public Company Limited
- 12.1.10.1. Company Overview
- 12.1.10.2. Products
- 12.1.10.3. Company Financials
- 12.1.10.4. SWOT Analysis
- 12.1.11 Lyondellbasell Industries Holdings Bv
- 12.1.11.1. Company Overview
- 12.1.11.2. Products
- 12.1.11.3. Company Financials
- 12.1.11.4. SWOT Analysis
- 12.1.12 Billion Industrial Holdings Limited
- 12.1.12.1. Company Overview
- 12.1.12.2. Products
- 12.1.12.3. Company Financials
- 12.1.12.4. SWOT Analysis
- 12.1.1 Hyosung Chemical
- 12.2. Market Entropy
- 12.2.1 Company's Key Areas Served
- 12.2.2 Recent Developments
- 12.3. Company Market Share Analysis 2025
- 12.3.1 Top 5 Companies Market Share Analysis
- 12.3.2 Top 3 Companies Market Share Analysis
- 12.4. List of Potential Customers
- 13. Research Methodology
List of Figures
- Figure 1: Global Plastic Packaging Industry in Vietnam Revenue Breakdown (billion, %) by Region 2025 & 2033
- Figure 2: Global Plastic Packaging Industry in Vietnam Volume Breakdown (Million, %) by Region 2025 & 2033
- Figure 3: North America Plastic Packaging Industry in Vietnam Revenue (billion), by Type 2025 & 2033
- Figure 4: North America Plastic Packaging Industry in Vietnam Volume (Million), by Type 2025 & 2033
- Figure 5: North America Plastic Packaging Industry in Vietnam Revenue Share (%), by Type 2025 & 2033
- Figure 6: North America Plastic Packaging Industry in Vietnam Volume Share (%), by Type 2025 & 2033
- Figure 7: North America Plastic Packaging Industry in Vietnam Revenue (billion), by Technology 2025 & 2033
- Figure 8: North America Plastic Packaging Industry in Vietnam Volume (Million), by Technology 2025 & 2033
- Figure 9: North America Plastic Packaging Industry in Vietnam Revenue Share (%), by Technology 2025 & 2033
- Figure 10: North America Plastic Packaging Industry in Vietnam Volume Share (%), by Technology 2025 & 2033
- Figure 11: North America Plastic Packaging Industry in Vietnam Revenue (billion), by Application 2025 & 2033
- Figure 12: North America Plastic Packaging Industry in Vietnam Volume (Million), by Application 2025 & 2033
- Figure 13: North America Plastic Packaging Industry in Vietnam Revenue Share (%), by Application 2025 & 2033
- Figure 14: North America Plastic Packaging Industry in Vietnam Volume Share (%), by Application 2025 & 2033
- Figure 15: North America Plastic Packaging Industry in Vietnam Revenue (billion), by Country 2025 & 2033
- Figure 16: North America Plastic Packaging Industry in Vietnam Volume (Million), by Country 2025 & 2033
- Figure 17: North America Plastic Packaging Industry in Vietnam Revenue Share (%), by Country 2025 & 2033
- Figure 18: North America Plastic Packaging Industry in Vietnam Volume Share (%), by Country 2025 & 2033
- Figure 19: South America Plastic Packaging Industry in Vietnam Revenue (billion), by Type 2025 & 2033
- Figure 20: South America Plastic Packaging Industry in Vietnam Volume (Million), by Type 2025 & 2033
- Figure 21: South America Plastic Packaging Industry in Vietnam Revenue Share (%), by Type 2025 & 2033
- Figure 22: South America Plastic Packaging Industry in Vietnam Volume Share (%), by Type 2025 & 2033
- Figure 23: South America Plastic Packaging Industry in Vietnam Revenue (billion), by Technology 2025 & 2033
- Figure 24: South America Plastic Packaging Industry in Vietnam Volume (Million), by Technology 2025 & 2033
- Figure 25: South America Plastic Packaging Industry in Vietnam Revenue Share (%), by Technology 2025 & 2033
- Figure 26: South America Plastic Packaging Industry in Vietnam Volume Share (%), by Technology 2025 & 2033
- Figure 27: South America Plastic Packaging Industry in Vietnam Revenue (billion), by Application 2025 & 2033
- Figure 28: South America Plastic Packaging Industry in Vietnam Volume (Million), by Application 2025 & 2033
- Figure 29: South America Plastic Packaging Industry in Vietnam Revenue Share (%), by Application 2025 & 2033
- Figure 30: South America Plastic Packaging Industry in Vietnam Volume Share (%), by Application 2025 & 2033
- Figure 31: South America Plastic Packaging Industry in Vietnam Revenue (billion), by Country 2025 & 2033
- Figure 32: South America Plastic Packaging Industry in Vietnam Volume (Million), by Country 2025 & 2033
- Figure 33: South America Plastic Packaging Industry in Vietnam Revenue Share (%), by Country 2025 & 2033
- Figure 34: South America Plastic Packaging Industry in Vietnam Volume Share (%), by Country 2025 & 2033
- Figure 35: Europe Plastic Packaging Industry in Vietnam Revenue (billion), by Type 2025 & 2033
- Figure 36: Europe Plastic Packaging Industry in Vietnam Volume (Million), by Type 2025 & 2033
- Figure 37: Europe Plastic Packaging Industry in Vietnam Revenue Share (%), by Type 2025 & 2033
- Figure 38: Europe Plastic Packaging Industry in Vietnam Volume Share (%), by Type 2025 & 2033
- Figure 39: Europe Plastic Packaging Industry in Vietnam Revenue (billion), by Technology 2025 & 2033
- Figure 40: Europe Plastic Packaging Industry in Vietnam Volume (Million), by Technology 2025 & 2033
- Figure 41: Europe Plastic Packaging Industry in Vietnam Revenue Share (%), by Technology 2025 & 2033
- Figure 42: Europe Plastic Packaging Industry in Vietnam Volume Share (%), by Technology 2025 & 2033
- Figure 43: Europe Plastic Packaging Industry in Vietnam Revenue (billion), by Application 2025 & 2033
- Figure 44: Europe Plastic Packaging Industry in Vietnam Volume (Million), by Application 2025 & 2033
- Figure 45: Europe Plastic Packaging Industry in Vietnam Revenue Share (%), by Application 2025 & 2033
- Figure 46: Europe Plastic Packaging Industry in Vietnam Volume Share (%), by Application 2025 & 2033
- Figure 47: Europe Plastic Packaging Industry in Vietnam Revenue (billion), by Country 2025 & 2033
- Figure 48: Europe Plastic Packaging Industry in Vietnam Volume (Million), by Country 2025 & 2033
- Figure 49: Europe Plastic Packaging Industry in Vietnam Revenue Share (%), by Country 2025 & 2033
- Figure 50: Europe Plastic Packaging Industry in Vietnam Volume Share (%), by Country 2025 & 2033
- Figure 51: Middle East & Africa Plastic Packaging Industry in Vietnam Revenue (billion), by Type 2025 & 2033
- Figure 52: Middle East & Africa Plastic Packaging Industry in Vietnam Volume (Million), by Type 2025 & 2033
- Figure 53: Middle East & Africa Plastic Packaging Industry in Vietnam Revenue Share (%), by Type 2025 & 2033
- Figure 54: Middle East & Africa Plastic Packaging Industry in Vietnam Volume Share (%), by Type 2025 & 2033
- Figure 55: Middle East & Africa Plastic Packaging Industry in Vietnam Revenue (billion), by Technology 2025 & 2033
- Figure 56: Middle East & Africa Plastic Packaging Industry in Vietnam Volume (Million), by Technology 2025 & 2033
- Figure 57: Middle East & Africa Plastic Packaging Industry in Vietnam Revenue Share (%), by Technology 2025 & 2033
- Figure 58: Middle East & Africa Plastic Packaging Industry in Vietnam Volume Share (%), by Technology 2025 & 2033
- Figure 59: Middle East & Africa Plastic Packaging Industry in Vietnam Revenue (billion), by Application 2025 & 2033
- Figure 60: Middle East & Africa Plastic Packaging Industry in Vietnam Volume (Million), by Application 2025 & 2033
- Figure 61: Middle East & Africa Plastic Packaging Industry in Vietnam Revenue Share (%), by Application 2025 & 2033
- Figure 62: Middle East & Africa Plastic Packaging Industry in Vietnam Volume Share (%), by Application 2025 & 2033
- Figure 63: Middle East & Africa Plastic Packaging Industry in Vietnam Revenue (billion), by Country 2025 & 2033
- Figure 64: Middle East & Africa Plastic Packaging Industry in Vietnam Volume (Million), by Country 2025 & 2033
- Figure 65: Middle East & Africa Plastic Packaging Industry in Vietnam Revenue Share (%), by Country 2025 & 2033
- Figure 66: Middle East & Africa Plastic Packaging Industry in Vietnam Volume Share (%), by Country 2025 & 2033
- Figure 67: Asia Pacific Plastic Packaging Industry in Vietnam Revenue (billion), by Type 2025 & 2033
- Figure 68: Asia Pacific Plastic Packaging Industry in Vietnam Volume (Million), by Type 2025 & 2033
- Figure 69: Asia Pacific Plastic Packaging Industry in Vietnam Revenue Share (%), by Type 2025 & 2033
- Figure 70: Asia Pacific Plastic Packaging Industry in Vietnam Volume Share (%), by Type 2025 & 2033
- Figure 71: Asia Pacific Plastic Packaging Industry in Vietnam Revenue (billion), by Technology 2025 & 2033
- Figure 72: Asia Pacific Plastic Packaging Industry in Vietnam Volume (Million), by Technology 2025 & 2033
- Figure 73: Asia Pacific Plastic Packaging Industry in Vietnam Revenue Share (%), by Technology 2025 & 2033
- Figure 74: Asia Pacific Plastic Packaging Industry in Vietnam Volume Share (%), by Technology 2025 & 2033
- Figure 75: Asia Pacific Plastic Packaging Industry in Vietnam Revenue (billion), by Application 2025 & 2033
- Figure 76: Asia Pacific Plastic Packaging Industry in Vietnam Volume (Million), by Application 2025 & 2033
- Figure 77: Asia Pacific Plastic Packaging Industry in Vietnam Revenue Share (%), by Application 2025 & 2033
- Figure 78: Asia Pacific Plastic Packaging Industry in Vietnam Volume Share (%), by Application 2025 & 2033
- Figure 79: Asia Pacific Plastic Packaging Industry in Vietnam Revenue (billion), by Country 2025 & 2033
- Figure 80: Asia Pacific Plastic Packaging Industry in Vietnam Volume (Million), by Country 2025 & 2033
- Figure 81: Asia Pacific Plastic Packaging Industry in Vietnam Revenue Share (%), by Country 2025 & 2033
- Figure 82: Asia Pacific Plastic Packaging Industry in Vietnam Volume Share (%), by Country 2025 & 2033
List of Tables
- Table 1: Global Plastic Packaging Industry in Vietnam Revenue billion Forecast, by Type 2020 & 2033
- Table 2: Global Plastic Packaging Industry in Vietnam Volume Million Forecast, by Type 2020 & 2033
- Table 3: Global Plastic Packaging Industry in Vietnam Revenue billion Forecast, by Technology 2020 & 2033
- Table 4: Global Plastic Packaging Industry in Vietnam Volume Million Forecast, by Technology 2020 & 2033
- Table 5: Global Plastic Packaging Industry in Vietnam Revenue billion Forecast, by Application 2020 & 2033
- Table 6: Global Plastic Packaging Industry in Vietnam Volume Million Forecast, by Application 2020 & 2033
- Table 7: Global Plastic Packaging Industry in Vietnam Revenue billion Forecast, by Region 2020 & 2033
- Table 8: Global Plastic Packaging Industry in Vietnam Volume Million Forecast, by Region 2020 & 2033
- Table 9: Global Plastic Packaging Industry in Vietnam Revenue billion Forecast, by Type 2020 & 2033
- Table 10: Global Plastic Packaging Industry in Vietnam Volume Million Forecast, by Type 2020 & 2033
- Table 11: Global Plastic Packaging Industry in Vietnam Revenue billion Forecast, by Technology 2020 & 2033
- Table 12: Global Plastic Packaging Industry in Vietnam Volume Million Forecast, by Technology 2020 & 2033
- Table 13: Global Plastic Packaging Industry in Vietnam Revenue billion Forecast, by Application 2020 & 2033
- Table 14: Global Plastic Packaging Industry in Vietnam Volume Million Forecast, by Application 2020 & 2033
- Table 15: Global Plastic Packaging Industry in Vietnam Revenue billion Forecast, by Country 2020 & 2033
- Table 16: Global Plastic Packaging Industry in Vietnam Volume Million Forecast, by Country 2020 & 2033
- Table 17: United States Plastic Packaging Industry in Vietnam Revenue (billion) Forecast, by Application 2020 & 2033
- Table 18: United States Plastic Packaging Industry in Vietnam Volume (Million) Forecast, by Application 2020 & 2033
- Table 19: Canada Plastic Packaging Industry in Vietnam Revenue (billion) Forecast, by Application 2020 & 2033
- Table 20: Canada Plastic Packaging Industry in Vietnam Volume (Million) Forecast, by Application 2020 & 2033
- Table 21: Mexico Plastic Packaging Industry in Vietnam Revenue (billion) Forecast, by Application 2020 & 2033
- Table 22: Mexico Plastic Packaging Industry in Vietnam Volume (Million) Forecast, by Application 2020 & 2033
- Table 23: Global Plastic Packaging Industry in Vietnam Revenue billion Forecast, by Type 2020 & 2033
- Table 24: Global Plastic Packaging Industry in Vietnam Volume Million Forecast, by Type 2020 & 2033
- Table 25: Global Plastic Packaging Industry in Vietnam Revenue billion Forecast, by Technology 2020 & 2033
- Table 26: Global Plastic Packaging Industry in Vietnam Volume Million Forecast, by Technology 2020 & 2033
- Table 27: Global Plastic Packaging Industry in Vietnam Revenue billion Forecast, by Application 2020 & 2033
- Table 28: Global Plastic Packaging Industry in Vietnam Volume Million Forecast, by Application 2020 & 2033
- Table 29: Global Plastic Packaging Industry in Vietnam Revenue billion Forecast, by Country 2020 & 2033
- Table 30: Global Plastic Packaging Industry in Vietnam Volume Million Forecast, by Country 2020 & 2033
- Table 31: Brazil Plastic Packaging Industry in Vietnam Revenue (billion) Forecast, by Application 2020 & 2033
- Table 32: Brazil Plastic Packaging Industry in Vietnam Volume (Million) Forecast, by Application 2020 & 2033
- Table 33: Argentina Plastic Packaging Industry in Vietnam Revenue (billion) Forecast, by Application 2020 & 2033
- Table 34: Argentina Plastic Packaging Industry in Vietnam Volume (Million) Forecast, by Application 2020 & 2033
- Table 35: Rest of South America Plastic Packaging Industry in Vietnam Revenue (billion) Forecast, by Application 2020 & 2033
- Table 36: Rest of South America Plastic Packaging Industry in Vietnam Volume (Million) Forecast, by Application 2020 & 2033
- Table 37: Global Plastic Packaging Industry in Vietnam Revenue billion Forecast, by Type 2020 & 2033
- Table 38: Global Plastic Packaging Industry in Vietnam Volume Million Forecast, by Type 2020 & 2033
- Table 39: Global Plastic Packaging Industry in Vietnam Revenue billion Forecast, by Technology 2020 & 2033
- Table 40: Global Plastic Packaging Industry in Vietnam Volume Million Forecast, by Technology 2020 & 2033
- Table 41: Global Plastic Packaging Industry in Vietnam Revenue billion Forecast, by Application 2020 & 2033
- Table 42: Global Plastic Packaging Industry in Vietnam Volume Million Forecast, by Application 2020 & 2033
- Table 43: Global Plastic Packaging Industry in Vietnam Revenue billion Forecast, by Country 2020 & 2033
- Table 44: Global Plastic Packaging Industry in Vietnam Volume Million Forecast, by Country 2020 & 2033
- Table 45: United Kingdom Plastic Packaging Industry in Vietnam Revenue (billion) Forecast, by Application 2020 & 2033
- Table 46: United Kingdom Plastic Packaging Industry in Vietnam Volume (Million) Forecast, by Application 2020 & 2033
- Table 47: Germany Plastic Packaging Industry in Vietnam Revenue (billion) Forecast, by Application 2020 & 2033
- Table 48: Germany Plastic Packaging Industry in Vietnam Volume (Million) Forecast, by Application 2020 & 2033
- Table 49: France Plastic Packaging Industry in Vietnam Revenue (billion) Forecast, by Application 2020 & 2033
- Table 50: France Plastic Packaging Industry in Vietnam Volume (Million) Forecast, by Application 2020 & 2033
- Table 51: Italy Plastic Packaging Industry in Vietnam Revenue (billion) Forecast, by Application 2020 & 2033
- Table 52: Italy Plastic Packaging Industry in Vietnam Volume (Million) Forecast, by Application 2020 & 2033
- Table 53: Spain Plastic Packaging Industry in Vietnam Revenue (billion) Forecast, by Application 2020 & 2033
- Table 54: Spain Plastic Packaging Industry in Vietnam Volume (Million) Forecast, by Application 2020 & 2033
- Table 55: Russia Plastic Packaging Industry in Vietnam Revenue (billion) Forecast, by Application 2020 & 2033
- Table 56: Russia Plastic Packaging Industry in Vietnam Volume (Million) Forecast, by Application 2020 & 2033
- Table 57: Benelux Plastic Packaging Industry in Vietnam Revenue (billion) Forecast, by Application 2020 & 2033
- Table 58: Benelux Plastic Packaging Industry in Vietnam Volume (Million) Forecast, by Application 2020 & 2033
- Table 59: Nordics Plastic Packaging Industry in Vietnam Revenue (billion) Forecast, by Application 2020 & 2033
- Table 60: Nordics Plastic Packaging Industry in Vietnam Volume (Million) Forecast, by Application 2020 & 2033
- Table 61: Rest of Europe Plastic Packaging Industry in Vietnam Revenue (billion) Forecast, by Application 2020 & 2033
- Table 62: Rest of Europe Plastic Packaging Industry in Vietnam Volume (Million) Forecast, by Application 2020 & 2033
- Table 63: Global Plastic Packaging Industry in Vietnam Revenue billion Forecast, by Type 2020 & 2033
- Table 64: Global Plastic Packaging Industry in Vietnam Volume Million Forecast, by Type 2020 & 2033
- Table 65: Global Plastic Packaging Industry in Vietnam Revenue billion Forecast, by Technology 2020 & 2033
- Table 66: Global Plastic Packaging Industry in Vietnam Volume Million Forecast, by Technology 2020 & 2033
- Table 67: Global Plastic Packaging Industry in Vietnam Revenue billion Forecast, by Application 2020 & 2033
- Table 68: Global Plastic Packaging Industry in Vietnam Volume Million Forecast, by Application 2020 & 2033
- Table 69: Global Plastic Packaging Industry in Vietnam Revenue billion Forecast, by Country 2020 & 2033
- Table 70: Global Plastic Packaging Industry in Vietnam Volume Million Forecast, by Country 2020 & 2033
- Table 71: Turkey Plastic Packaging Industry in Vietnam Revenue (billion) Forecast, by Application 2020 & 2033
- Table 72: Turkey Plastic Packaging Industry in Vietnam Volume (Million) Forecast, by Application 2020 & 2033
- Table 73: Israel Plastic Packaging Industry in Vietnam Revenue (billion) Forecast, by Application 2020 & 2033
- Table 74: Israel Plastic Packaging Industry in Vietnam Volume (Million) Forecast, by Application 2020 & 2033
- Table 75: GCC Plastic Packaging Industry in Vietnam Revenue (billion) Forecast, by Application 2020 & 2033
- Table 76: GCC Plastic Packaging Industry in Vietnam Volume (Million) Forecast, by Application 2020 & 2033
- Table 77: North Africa Plastic Packaging Industry in Vietnam Revenue (billion) Forecast, by Application 2020 & 2033
- Table 78: North Africa Plastic Packaging Industry in Vietnam Volume (Million) Forecast, by Application 2020 & 2033
- Table 79: South Africa Plastic Packaging Industry in Vietnam Revenue (billion) Forecast, by Application 2020 & 2033
- Table 80: South Africa Plastic Packaging Industry in Vietnam Volume (Million) Forecast, by Application 2020 & 2033
- Table 81: Rest of Middle East & Africa Plastic Packaging Industry in Vietnam Revenue (billion) Forecast, by Application 2020 & 2033
- Table 82: Rest of Middle East & Africa Plastic Packaging Industry in Vietnam Volume (Million) Forecast, by Application 2020 & 2033
- Table 83: Global Plastic Packaging Industry in Vietnam Revenue billion Forecast, by Type 2020 & 2033
- Table 84: Global Plastic Packaging Industry in Vietnam Volume Million Forecast, by Type 2020 & 2033
- Table 85: Global Plastic Packaging Industry in Vietnam Revenue billion Forecast, by Technology 2020 & 2033
- Table 86: Global Plastic Packaging Industry in Vietnam Volume Million Forecast, by Technology 2020 & 2033
- Table 87: Global Plastic Packaging Industry in Vietnam Revenue billion Forecast, by Application 2020 & 2033
- Table 88: Global Plastic Packaging Industry in Vietnam Volume Million Forecast, by Application 2020 & 2033
- Table 89: Global Plastic Packaging Industry in Vietnam Revenue billion Forecast, by Country 2020 & 2033
- Table 90: Global Plastic Packaging Industry in Vietnam Volume Million Forecast, by Country 2020 & 2033
- Table 91: China Plastic Packaging Industry in Vietnam Revenue (billion) Forecast, by Application 2020 & 2033
- Table 92: China Plastic Packaging Industry in Vietnam Volume (Million) Forecast, by Application 2020 & 2033
- Table 93: India Plastic Packaging Industry in Vietnam Revenue (billion) Forecast, by Application 2020 & 2033
- Table 94: India Plastic Packaging Industry in Vietnam Volume (Million) Forecast, by Application 2020 & 2033
- Table 95: Japan Plastic Packaging Industry in Vietnam Revenue (billion) Forecast, by Application 2020 & 2033
- Table 96: Japan Plastic Packaging Industry in Vietnam Volume (Million) Forecast, by Application 2020 & 2033
- Table 97: South Korea Plastic Packaging Industry in Vietnam Revenue (billion) Forecast, by Application 2020 & 2033
- Table 98: South Korea Plastic Packaging Industry in Vietnam Volume (Million) Forecast, by Application 2020 & 2033
- Table 99: ASEAN Plastic Packaging Industry in Vietnam Revenue (billion) Forecast, by Application 2020 & 2033
- Table 100: ASEAN Plastic Packaging Industry in Vietnam Volume (Million) Forecast, by Application 2020 & 2033
- Table 101: Oceania Plastic Packaging Industry in Vietnam Revenue (billion) Forecast, by Application 2020 & 2033
- Table 102: Oceania Plastic Packaging Industry in Vietnam Volume (Million) Forecast, by Application 2020 & 2033
- Table 103: Rest of Asia Pacific Plastic Packaging Industry in Vietnam Revenue (billion) Forecast, by Application 2020 & 2033
- Table 104: Rest of Asia Pacific Plastic Packaging Industry in Vietnam Volume (Million) Forecast, by Application 2020 & 2033
Frequently Asked Questions
1. What is the projected Compound Annual Growth Rate (CAGR) of the Plastic Packaging Industry in Vietnam?
The projected CAGR is approximately 8.21%.
2. Which companies are prominent players in the Plastic Packaging Industry in Vietnam?
Key companies in the market include Hyosung Chemical, Far Eastern New Century Corporation, Vietnam Polystyrene Co Ltd, Vinaplast *List Not Exhaustive, Nsrp Llc, Toray Industries Inc, Nan Ya Plastics Corporation, Agc Inc, Vietnam Oil And Gas Group, Scg Chemicals Public Company Limited, Lyondellbasell Industries Holdings Bv, Billion Industrial Holdings Limited.
3. What are the main segments of the Plastic Packaging Industry in Vietnam?
The market segments include Type, Technology, Application.
4. Can you provide details about the market size?
The market size is estimated to be USD 14.4 billion as of 2022.
5. What are some drivers contributing to market growth?
Growing Demand from the Construction Sector; Other Drivers.
6. What are the notable trends driving market growth?
Extrusion Technology to Dominate the Market.
7. Are there any restraints impacting market growth?
Over-reliance on Imports of Raw Materials and Finished Plastics; Environmental Concerns of Plastics and the Availability of New Substitutes.
8. Can you provide examples of recent developments in the market?
In September 2022, Billion Industrial Holdings Limited announced the expansion of the manufacturing facilities for polyester bottle chips in Vietnam. This manufacturing facility will have a production capacity of 300,000 tons of polyethylene terephthalate resin.
9. What pricing options are available for accessing the report?
Pricing options include single-user, multi-user, and enterprise licenses priced at USD 3800, USD 4500, and USD 5800 respectively.
10. Is the market size provided in terms of value or volume?
The market size is provided in terms of value, measured in billion and volume, measured in Million.
11. Are there any specific market keywords associated with the report?
Yes, the market keyword associated with the report is "Plastic Packaging Industry in Vietnam," which aids in identifying and referencing the specific market segment covered.
12. How do I determine which pricing option suits my needs best?
The pricing options vary based on user requirements and access needs. Individual users may opt for single-user licenses, while businesses requiring broader access may choose multi-user or enterprise licenses for cost-effective access to the report.
13. Are there any additional resources or data provided in the Plastic Packaging Industry in Vietnam report?
While the report offers comprehensive insights, it's advisable to review the specific contents or supplementary materials provided to ascertain if additional resources or data are available.
14. How can I stay updated on further developments or reports in the Plastic Packaging Industry in Vietnam?
To stay informed about further developments, trends, and reports in the Plastic Packaging Industry in Vietnam, consider subscribing to industry newsletters, following relevant companies and organizations, or regularly checking reputable industry news sources and publications.
Methodology
Step 1 - Identification of Relevant Samples Size from Population Database


Step 2 - Approaches for Defining Global Market Size (Value, Volume* & Price*)

Note*: In applicable scenarios
Step 3 - Data Sources
Primary Research
- Web Analytics
- Survey Reports
- Research Institute
- Latest Research Reports
- Opinion Leaders
Secondary Research
- Annual Reports
- White Paper
- Latest Press Release
- Industry Association
- Paid Database
- Investor Presentations

Step 4 - Data Triangulation
Involves using different sources of information in order to increase the validity of a study
These sources are likely to be stakeholders in a program - participants, other researchers, program staff, other community members, and so on.
Then we put all data in single framework & apply various statistical tools to find out the dynamic on the market.
During the analysis stage, feedback from the stakeholder groups would be compared to determine areas of agreement as well as areas of divergence