Key Insights
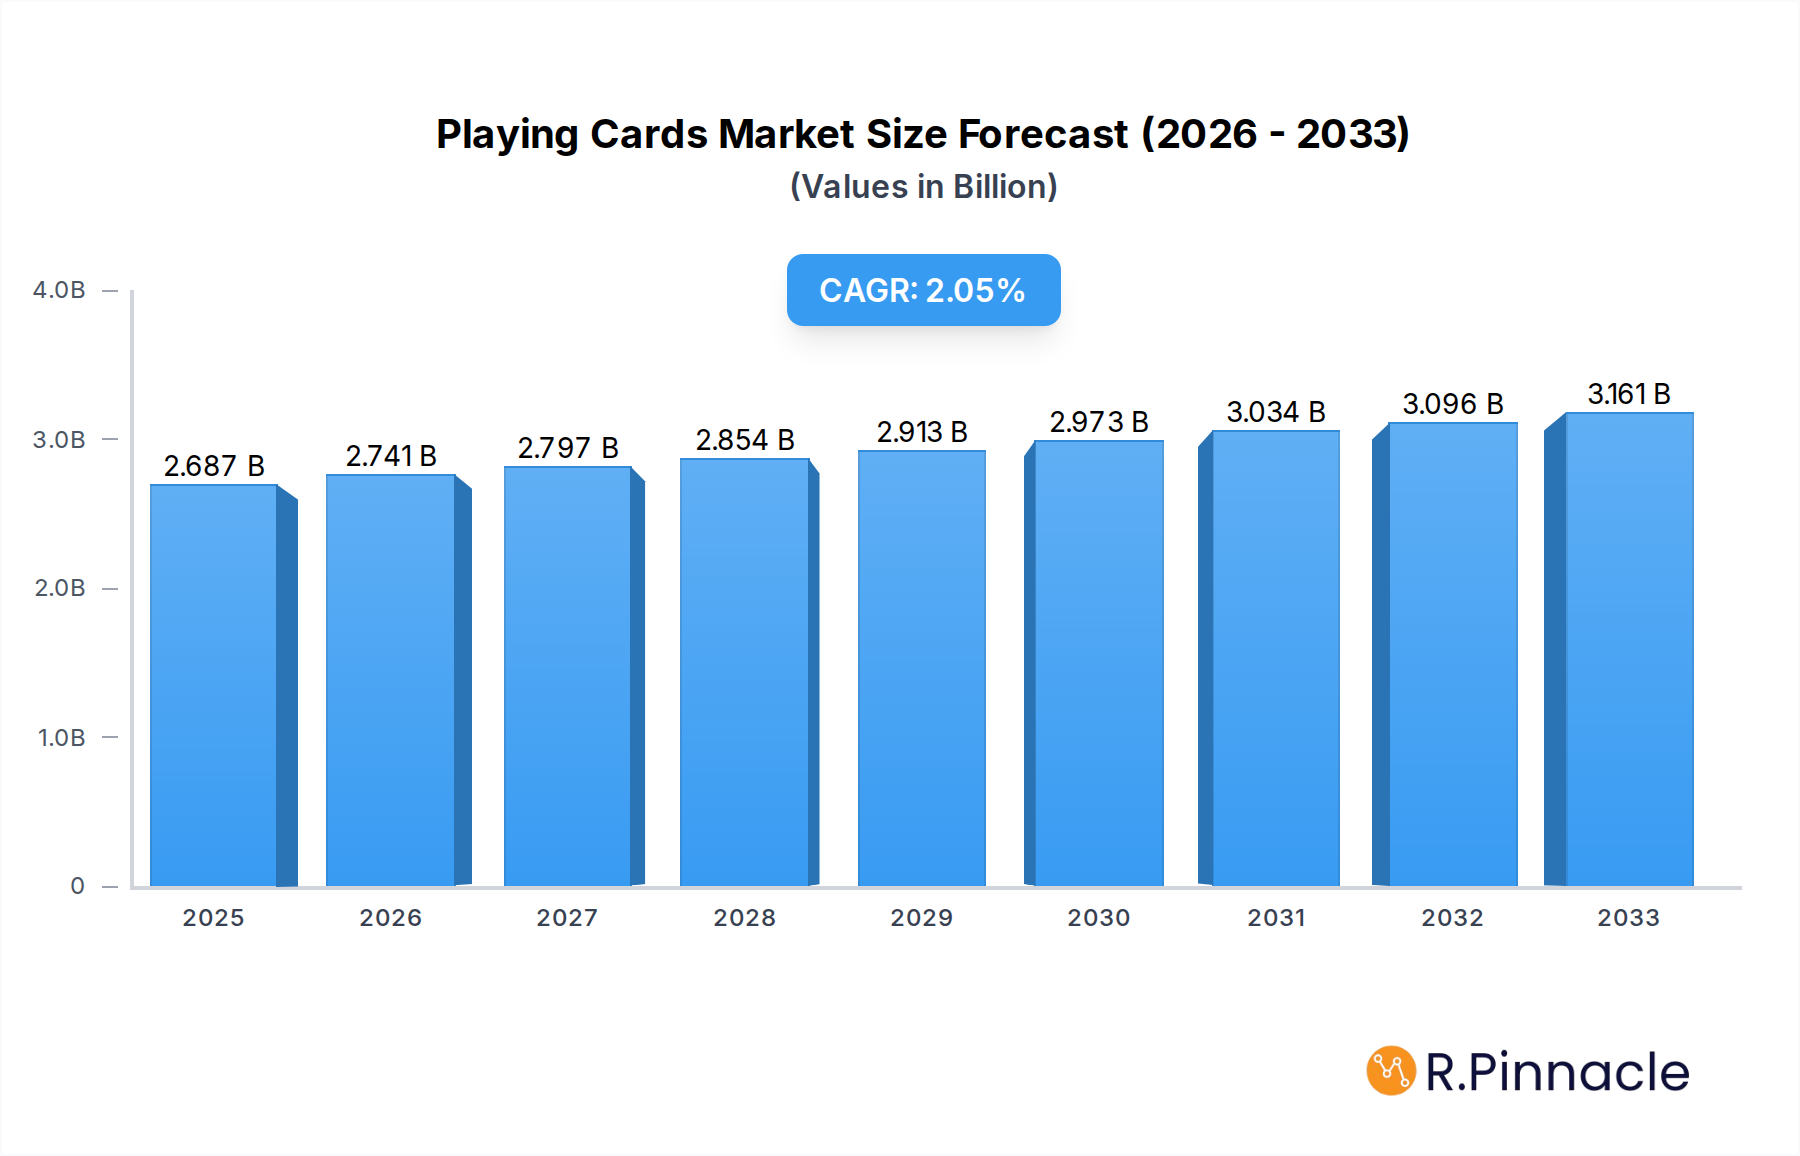
The global playing cards market is poised for steady, albeit modest, expansion, projected to reach $2,686.7 million by 2025. This growth is driven by a confluence of factors, including the enduring appeal of traditional card games for personal entertainment and a resurgence in their use for commercial and educational purposes. While the market size is substantial, the CAGR of 2.1% over the forecast period (2025-2033) suggests a mature and stable market rather than one experiencing explosive growth. The versatility of playing cards, ranging from universally designed decks for casual play to highly customized options for specific events or branding, caters to a broad spectrum of consumer needs. Key application segments include personal entertainment, which remains the dominant force, and commercial entertainment, encompassing casinos, magic shows, and promotional activities. The market's stability can be attributed to the inherent appeal of card games as an accessible and engaging form of recreation and social interaction.

Playing Cards Market Size (In Billion)
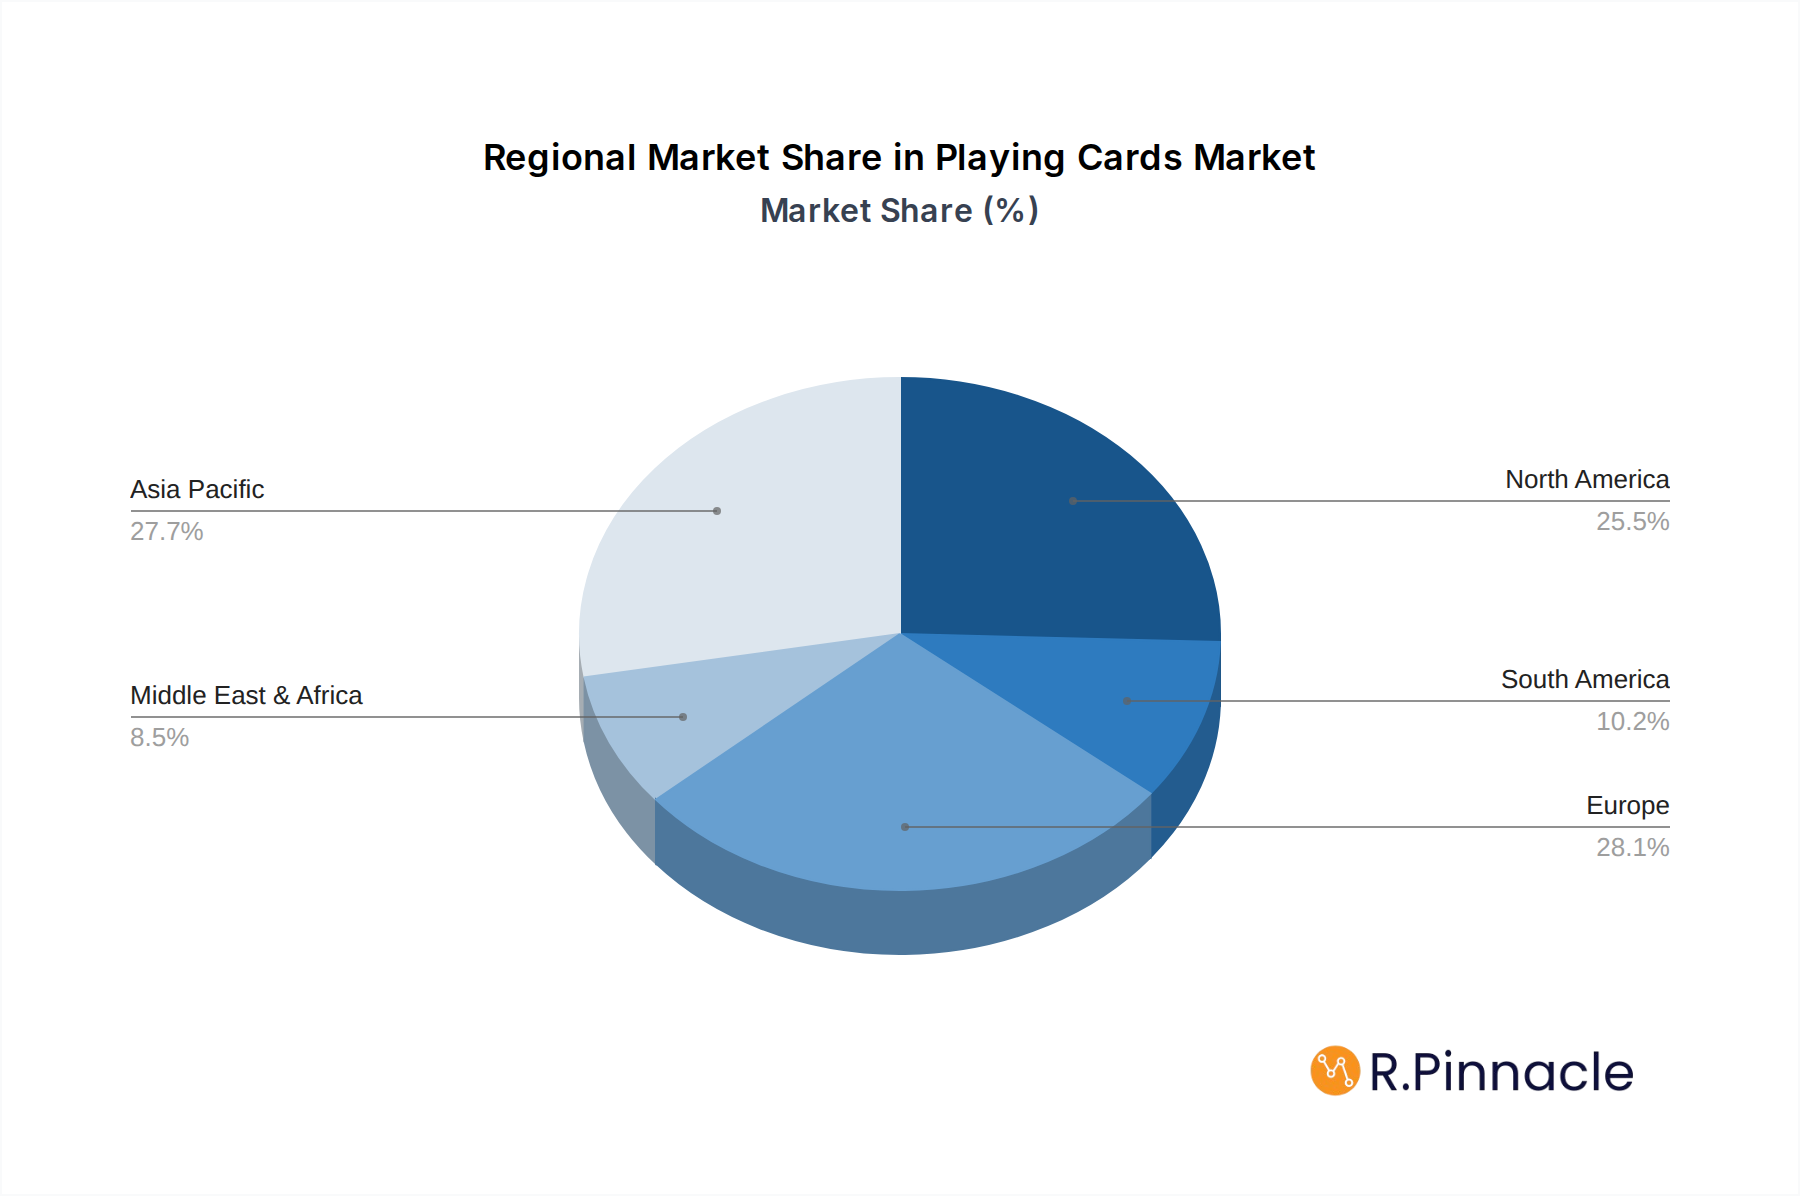
Despite the steady growth trajectory, several factors will shape the playing cards market. The increasing demand for unique and personalized playing card designs, particularly for events and corporate branding, represents a significant opportunity. Furthermore, advancements in printing technology and material innovation are enabling the creation of more durable, aesthetically pleasing, and eco-friendly playing cards. However, the market also faces certain restraints. The growing prevalence of digital entertainment and online gaming platforms may pose a challenge to traditional playing card sales, particularly among younger demographics. Additionally, fluctuating raw material costs, such as paper and ink, can impact profit margins for manufacturers. Geographically, the Asia Pacific region, particularly China and India, is expected to be a key growth engine due to its large population and increasing disposable income, while North America and Europe will continue to represent significant mature markets.
Playing Cards Company Market Share
Dive deep into the evolving landscape of the playing cards industry with this comprehensive report. Uncover critical insights into market dynamics, innovation trends, regional dominance, and future growth projections. Designed for industry professionals, investors, and strategic decision-makers, this report provides actionable intelligence to navigate the competitive playing cards sector.
Playing Cards Market Structure & Innovation Trends
The global playing cards market exhibits a moderate to high concentration, driven by established players and strategic acquisitions. Innovation in this sector is primarily fueled by advancements in printing technology, material science, and the integration of digital elements, aiming to enhance durability, aesthetic appeal, and user experience. Regulatory frameworks, while generally stable, focus on product safety and fair play, with evolving standards for specialized decks. Substitute products, such as digital gaming platforms and board games, present a constant challenge, necessitating continuous adaptation and differentiation by playing card manufacturers. End-user demographics are diverse, spanning casual players, professional gamers, collectors, and businesses seeking branded promotional items. Mergers and acquisitions (M&A) play a crucial role in market consolidation and expansion, with deal values in the past year estimated to be in the hundreds of millions. Key players are actively investing in R&D to develop novel designs, eco-friendly materials, and interactive features to capture a larger market share. The market share of top five companies is estimated to be over 50%.
- Market Concentration: Moderate to High, with key players dominating significant portions of the market.
- Innovation Drivers: Enhanced material durability, unique artistic designs, eco-friendly production, and interactive digital integration.
- Regulatory Frameworks: Focus on product safety, material compliance, and intellectual property protection.
- Product Substitutes: Digital gaming, board games, and other leisure activities.
- End-User Demographics: Broad appeal across casual consumers, professional gamers, collectors, educational institutions, and corporate clients for promotional purposes.
- M&A Activities: Strategic acquisitions and partnerships to gain market share, expand product portfolios, and access new technologies. M&A deal values have reached millions of dollars annually.
Playing Cards Market Dynamics & Trends
The playing cards market is experiencing steady growth, projected to achieve a Compound Annual Growth Rate (CAGR) of approximately 4.5% over the forecast period of 2025–2033. This growth is propelled by several dynamic factors. The enduring popularity of traditional card games, coupled with the rising trend of collecting unique and artistic playing card decks, are significant market growth drivers. The resurgence of board game cafes and a growing interest in social, screen-free entertainment further bolster demand, particularly within the personal entertainment segment. Technological disruptions, though less pronounced than in other industries, are evident in advancements in printing techniques, allowing for intricate designs, holographic effects, and augmented reality integration for some premium decks. Consumer preferences are increasingly leaning towards higher quality materials, innovative aesthetics, and personalized or themed decks. The competitive dynamics are characterized by a blend of large-scale manufacturers catering to mass markets and niche players focusing on specialized, limited-edition, or custom-designed cards. Market penetration is high globally, but opportunities for further growth exist in emerging economies and through the expansion of online retail channels. The increasing digitalization of entertainment has led to a counter-trend of renewed appreciation for tangible, tactile experiences, which playing cards effectively fulfill. The global playing cards market size is projected to reach tens of billions of dollars by 2033.
Dominant Regions & Segments in Playing Cards
North America currently holds a dominant position in the global playing cards market, driven by a strong culture of card gaming, a significant collector base, and high disposable incomes. Within North America, the United States leads, supported by robust distribution networks and a high penetration of both personal and commercial entertainment applications. The Personal Entertainment segment is the largest driver of demand, encompassing casual home use, social gatherings, and hobbyist collecting. The Universal Type of playing cards constitutes the bulk of sales due to their broad applicability across various games. However, the Customized Type segment is experiencing robust growth, fueled by increasing demand for personalized gifts, corporate branding, and unique artistic expressions in card design.
- Leading Region: North America, with the United States as the leading country.
- Dominant Segment (Application): Personal Entertainment.
- Key Drivers: Enduring popularity of traditional games, rise of social gaming, and a strong collector culture.
- Detailed Dominance: Consumers seek high-quality, aesthetically pleasing decks for leisure activities and social interaction. The accessibility and low barrier to entry for personal entertainment make this segment consistently strong.
- Dominant Segment (Type): Universal Type.
- Key Drivers: Versatility across a wide range of card games, affordability, and widespread availability.
- Detailed Dominance: Standard decks are essential for most popular card games, ensuring consistent demand from a broad consumer base. Their widespread adoption makes them the default choice for many.
- Growing Segment (Type): Customized Type.
- Key Drivers: Desire for personalization, unique branding opportunities, and artistic expression.
- Detailed Dominance: This segment caters to a growing niche seeking bespoke playing cards for special occasions, promotional events, or as unique collectibles. The demand for personalized products is a significant trend.
- Emerging Region: Asia-Pacific, particularly China and India, is showing significant growth potential due to a burgeoning middle class and increasing interest in leisure activities.
Playing Cards Product Innovations
Product innovations in the playing cards sector are focused on enhancing user experience and expanding applications. Advancements in material science have led to the development of more durable, waterproof, and aesthetically pleasing card stocks. Unique finishes, such as linen textures and metallic foils, are becoming increasingly popular, offering a premium feel. Furthermore, the integration of augmented reality (AR) features in certain decks allows for interactive gameplay and digital enhancements, creating novel entertainment experiences. These innovations not only differentiate products in a competitive market but also cater to the evolving preferences of collectors and gamers seeking unique and high-quality playing cards. The competitive advantage lies in offering superior tactile qualities, distinctive visual appeal, and engaging interactive elements that set them apart.
Report Scope & Segmentation Analysis
This report meticulously segments the global playing cards market by Application and Type.
- Application: Personal Entertainment: This segment encompasses playing cards used for individual leisure, family gatherings, and social events. It is projected to maintain its dominance, with an estimated market size of millions of dollars and a steady growth trajectory. Competitive dynamics within this segment are driven by brand recognition, design variety, and affordability.
- Application: Commercial Entertainment: This segment includes playing cards used in casinos, gaming establishments, and for professional poker tournaments. While smaller than personal entertainment, it offers stable demand and higher average selling prices. Growth in this segment is influenced by the performance of the global gambling industry and the demand for specialized, durable decks.
- Type: Universal Type: This category includes standard playing card decks used for a wide array of games. It represents the largest market share, with significant volume and a projected market size of millions of dollars. Its growth is tied to the overall popularity of card games.
- Type: Customized Type: This segment focuses on bespoke playing cards tailored to specific client needs, including custom designs, branding, and unique finishes. It is the fastest-growing segment, with a projected market size of millions of dollars, driven by increasing demand for personalized products and promotional items. Competitive dynamics here revolve around design capabilities, customization options, and turnaround times.
Key Drivers of Playing Cards Growth
The playing cards market is propelled by several key drivers. The enduring cultural significance of card games provides a stable foundation for demand. A resurgence in interest in tangible, social, and screen-free entertainment activities directly benefits the playing cards sector. Technological advancements in printing and material science enable the creation of more visually appealing and durable decks, attracting new consumers and collectors. Furthermore, the growing market for customized and collectible playing cards, driven by artistic expression and branding opportunities, is a significant growth accelerator. Economic stability in key regions also contributes to increased discretionary spending on leisure items.
Challenges in the Playing Cards Sector
Despite its growth, the playing cards sector faces several challenges. The increasing popularity of digital gaming and other digital entertainment alternatives poses a significant competitive threat, diverting consumer attention and spending. Fluctuations in raw material costs, such as paper pulp and ink, can impact manufacturing expenses and profit margins. Supply chain disruptions, exacerbated by global events, can affect production timelines and product availability. Intense competition among manufacturers, particularly in the mass-market segment, can lead to price wars and reduced profitability. Additionally, evolving consumer preferences for sustainable products necessitate investments in eco-friendly materials and manufacturing processes, which can incur additional costs.
Emerging Opportunities in Playing Cards
The playing cards industry is ripe with emerging opportunities. The growing demand for personalized and custom-designed decks presents a significant avenue for niche manufacturers and online customization platforms. The integration of augmented reality (AR) and other digital technologies into physical playing cards opens up new interactive entertainment possibilities and appeals to tech-savvy consumers. The expansion of e-commerce and direct-to-consumer (DTC) sales channels allows for broader market reach and direct engagement with customers. Furthermore, the increasing popularity of themed decks, catering to various fandoms, hobbies, and historical periods, offers a vast untapped market. The growth of the collectible card game (CCG) market also indirectly supports the broader playing cards industry by fostering a culture of card appreciation.
Leading Players in the Playing Cards Market
- Cartamundi Group
- Shanghai Yaoji Playing Card Co.,Ltd.
- Jiangsu Santu Economic&Trade Development Group Co.,Ltd.
- Ningbo Three A Group Co.,Ltd.
- Zhejiang Binwang Playing Cards Co.,Ltd.
- DiaoYu
- Zhejiang Brother
- Guangdong Quanmei Poker Co.,Ld.
Key Developments in Playing Cards Industry
- 2023 Q4: Cartamundi Group launches a new line of eco-friendly playing cards made from recycled materials, aligning with increasing consumer demand for sustainability.
- 2023 Q3: Shanghai Yaoji Playing Card Co.,Ltd. announces expansion into the European market, focusing on customized poker decks for casinos and corporate events.
- 2023 Q2: Zhejiang Binwang Playing Cards Co.,Ltd. invests heavily in new printing technology to enhance the durability and visual fidelity of their card designs.
- 2023 Q1: Ningbo Three A Group Co.,Ltd. reports significant growth in its customized playing card segment, driven by increasing demand from the promotional products industry.
- 2022 Q4: Jiangsu Santu Economic&Trade Development Group Co.,Ltd. introduces an innovative AR-enabled playing card deck, allowing for interactive gameplay through a dedicated mobile app.
- 2022 Q3: Guangdong Quanmei Poker Co.,Ld. expands its product portfolio to include specialized decks for collectible card games and themed enthusiast markets.
- 2022 Q2: DiaoYu and Zhejiang Brother form a strategic partnership to collaborate on developing innovative playing card designs and manufacturing processes.
Future Outlook for Playing Cards Market
The future outlook for the playing cards market remains positive, driven by a combination of enduring traditional appeal and burgeoning innovation. The sustained popularity of card games, coupled with a growing appreciation for tactile and collectible items, will continue to fuel demand. Emerging markets present significant opportunities for expansion. The ongoing development of advanced printing techniques, novel materials, and the integration of digital technologies, such as AR, will create new avenues for product differentiation and enhanced consumer engagement. Strategic investments in sustainable manufacturing practices and a focus on personalized and niche market segments will be crucial for long-term growth and competitive advantage. The market is poised for continued evolution, offering exciting prospects for stakeholders across the value chain.
Playing Cards Segmentation
-
1. Application
- 1.1. Personal Entertainment
- 1.2. Commerical Entertainment
-
2. Types
- 2.1. Universal Type
- 2.2. Customized Type
Playing Cards Segmentation By Geography
-
1. North America
- 1.1. United States
- 1.2. Canada
- 1.3. Mexico
-
2. South America
- 2.1. Brazil
- 2.2. Argentina
- 2.3. Rest of South America
-
3. Europe
- 3.1. United Kingdom
- 3.2. Germany
- 3.3. France
- 3.4. Italy
- 3.5. Spain
- 3.6. Russia
- 3.7. Benelux
- 3.8. Nordics
- 3.9. Rest of Europe
-
4. Middle East & Africa
- 4.1. Turkey
- 4.2. Israel
- 4.3. GCC
- 4.4. North Africa
- 4.5. South Africa
- 4.6. Rest of Middle East & Africa
-
5. Asia Pacific
- 5.1. China
- 5.2. India
- 5.3. Japan
- 5.4. South Korea
- 5.5. ASEAN
- 5.6. Oceania
- 5.7. Rest of Asia Pacific
Playing Cards Regional Market Share
Geographic Coverage of Playing Cards
Playing Cards REPORT HIGHLIGHTS
| Aspects | Details |
|---|---|
| Study Period | 2020-2034 |
| Base Year | 2025 |
| Estimated Year | 2026 |
| Forecast Period | 2026-2034 |
| Historical Period | 2020-2025 |
| Growth Rate | CAGR of 2.1% from 2020-2034 |
| Segmentation |
|
Table of Contents
- 1. Introduction
- 1.1. Research Scope
- 1.2. Market Segmentation
- 1.3. Research Methodology
- 1.4. Definitions and Assumptions
- 2. Executive Summary
- 2.1. Introduction
- 3. Market Dynamics
- 3.1. Introduction
- 3.2. Market Drivers
- 3.3. Market Restrains
- 3.4. Market Trends
- 4. Market Factor Analysis
- 4.1. Porters Five Forces
- 4.2. Supply/Value Chain
- 4.3. PESTEL analysis
- 4.4. Market Entropy
- 4.5. Patent/Trademark Analysis
- 5. Global Playing Cards Analysis, Insights and Forecast, 2020-2032
- 5.1. Market Analysis, Insights and Forecast - by Application
- 5.1.1. Personal Entertainment
- 5.1.2. Commerical Entertainment
- 5.2. Market Analysis, Insights and Forecast - by Types
- 5.2.1. Universal Type
- 5.2.2. Customized Type
- 5.3. Market Analysis, Insights and Forecast - by Region
- 5.3.1. North America
- 5.3.2. South America
- 5.3.3. Europe
- 5.3.4. Middle East & Africa
- 5.3.5. Asia Pacific
- 5.1. Market Analysis, Insights and Forecast - by Application
- 6. North America Playing Cards Analysis, Insights and Forecast, 2020-2032
- 6.1. Market Analysis, Insights and Forecast - by Application
- 6.1.1. Personal Entertainment
- 6.1.2. Commerical Entertainment
- 6.2. Market Analysis, Insights and Forecast - by Types
- 6.2.1. Universal Type
- 6.2.2. Customized Type
- 6.1. Market Analysis, Insights and Forecast - by Application
- 7. South America Playing Cards Analysis, Insights and Forecast, 2020-2032
- 7.1. Market Analysis, Insights and Forecast - by Application
- 7.1.1. Personal Entertainment
- 7.1.2. Commerical Entertainment
- 7.2. Market Analysis, Insights and Forecast - by Types
- 7.2.1. Universal Type
- 7.2.2. Customized Type
- 7.1. Market Analysis, Insights and Forecast - by Application
- 8. Europe Playing Cards Analysis, Insights and Forecast, 2020-2032
- 8.1. Market Analysis, Insights and Forecast - by Application
- 8.1.1. Personal Entertainment
- 8.1.2. Commerical Entertainment
- 8.2. Market Analysis, Insights and Forecast - by Types
- 8.2.1. Universal Type
- 8.2.2. Customized Type
- 8.1. Market Analysis, Insights and Forecast - by Application
- 9. Middle East & Africa Playing Cards Analysis, Insights and Forecast, 2020-2032
- 9.1. Market Analysis, Insights and Forecast - by Application
- 9.1.1. Personal Entertainment
- 9.1.2. Commerical Entertainment
- 9.2. Market Analysis, Insights and Forecast - by Types
- 9.2.1. Universal Type
- 9.2.2. Customized Type
- 9.1. Market Analysis, Insights and Forecast - by Application
- 10. Asia Pacific Playing Cards Analysis, Insights and Forecast, 2020-2032
- 10.1. Market Analysis, Insights and Forecast - by Application
- 10.1.1. Personal Entertainment
- 10.1.2. Commerical Entertainment
- 10.2. Market Analysis, Insights and Forecast - by Types
- 10.2.1. Universal Type
- 10.2.2. Customized Type
- 10.1. Market Analysis, Insights and Forecast - by Application
- 11. Competitive Analysis
- 11.1. Global Market Share Analysis 2025
- 11.2. Company Profiles
- 11.2.1 Cartamundi Group
- 11.2.1.1. Overview
- 11.2.1.2. Products
- 11.2.1.3. SWOT Analysis
- 11.2.1.4. Recent Developments
- 11.2.1.5. Financials (Based on Availability)
- 11.2.2 Shanghai Yaoji Playing Card Co.
- 11.2.2.1. Overview
- 11.2.2.2. Products
- 11.2.2.3. SWOT Analysis
- 11.2.2.4. Recent Developments
- 11.2.2.5. Financials (Based on Availability)
- 11.2.3 Ltd.
- 11.2.3.1. Overview
- 11.2.3.2. Products
- 11.2.3.3. SWOT Analysis
- 11.2.3.4. Recent Developments
- 11.2.3.5. Financials (Based on Availability)
- 11.2.4 Jiangsu Santu Economic&Trade Development Group Co.
- 11.2.4.1. Overview
- 11.2.4.2. Products
- 11.2.4.3. SWOT Analysis
- 11.2.4.4. Recent Developments
- 11.2.4.5. Financials (Based on Availability)
- 11.2.5 Ltd.
- 11.2.5.1. Overview
- 11.2.5.2. Products
- 11.2.5.3. SWOT Analysis
- 11.2.5.4. Recent Developments
- 11.2.5.5. Financials (Based on Availability)
- 11.2.6 Ningbo Three A Group Co.
- 11.2.6.1. Overview
- 11.2.6.2. Products
- 11.2.6.3. SWOT Analysis
- 11.2.6.4. Recent Developments
- 11.2.6.5. Financials (Based on Availability)
- 11.2.7 Ltd.
- 11.2.7.1. Overview
- 11.2.7.2. Products
- 11.2.7.3. SWOT Analysis
- 11.2.7.4. Recent Developments
- 11.2.7.5. Financials (Based on Availability)
- 11.2.8 Zhejiang Binwang Playing Cards Co.
- 11.2.8.1. Overview
- 11.2.8.2. Products
- 11.2.8.3. SWOT Analysis
- 11.2.8.4. Recent Developments
- 11.2.8.5. Financials (Based on Availability)
- 11.2.9 Ltd.
- 11.2.9.1. Overview
- 11.2.9.2. Products
- 11.2.9.3. SWOT Analysis
- 11.2.9.4. Recent Developments
- 11.2.9.5. Financials (Based on Availability)
- 11.2.10 DiaoYu
- 11.2.10.1. Overview
- 11.2.10.2. Products
- 11.2.10.3. SWOT Analysis
- 11.2.10.4. Recent Developments
- 11.2.10.5. Financials (Based on Availability)
- 11.2.11 Zhejiang Brother
- 11.2.11.1. Overview
- 11.2.11.2. Products
- 11.2.11.3. SWOT Analysis
- 11.2.11.4. Recent Developments
- 11.2.11.5. Financials (Based on Availability)
- 11.2.12 Guangdong Quanmei Poker Co.
- 11.2.12.1. Overview
- 11.2.12.2. Products
- 11.2.12.3. SWOT Analysis
- 11.2.12.4. Recent Developments
- 11.2.12.5. Financials (Based on Availability)
- 11.2.13 Ld.
- 11.2.13.1. Overview
- 11.2.13.2. Products
- 11.2.13.3. SWOT Analysis
- 11.2.13.4. Recent Developments
- 11.2.13.5. Financials (Based on Availability)
- 11.2.1 Cartamundi Group
List of Figures
- Figure 1: Global Playing Cards Revenue Breakdown (million, %) by Region 2025 & 2033
- Figure 2: North America Playing Cards Revenue (million), by Application 2025 & 2033
- Figure 3: North America Playing Cards Revenue Share (%), by Application 2025 & 2033
- Figure 4: North America Playing Cards Revenue (million), by Types 2025 & 2033
- Figure 5: North America Playing Cards Revenue Share (%), by Types 2025 & 2033
- Figure 6: North America Playing Cards Revenue (million), by Country 2025 & 2033
- Figure 7: North America Playing Cards Revenue Share (%), by Country 2025 & 2033
- Figure 8: South America Playing Cards Revenue (million), by Application 2025 & 2033
- Figure 9: South America Playing Cards Revenue Share (%), by Application 2025 & 2033
- Figure 10: South America Playing Cards Revenue (million), by Types 2025 & 2033
- Figure 11: South America Playing Cards Revenue Share (%), by Types 2025 & 2033
- Figure 12: South America Playing Cards Revenue (million), by Country 2025 & 2033
- Figure 13: South America Playing Cards Revenue Share (%), by Country 2025 & 2033
- Figure 14: Europe Playing Cards Revenue (million), by Application 2025 & 2033
- Figure 15: Europe Playing Cards Revenue Share (%), by Application 2025 & 2033
- Figure 16: Europe Playing Cards Revenue (million), by Types 2025 & 2033
- Figure 17: Europe Playing Cards Revenue Share (%), by Types 2025 & 2033
- Figure 18: Europe Playing Cards Revenue (million), by Country 2025 & 2033
- Figure 19: Europe Playing Cards Revenue Share (%), by Country 2025 & 2033
- Figure 20: Middle East & Africa Playing Cards Revenue (million), by Application 2025 & 2033
- Figure 21: Middle East & Africa Playing Cards Revenue Share (%), by Application 2025 & 2033
- Figure 22: Middle East & Africa Playing Cards Revenue (million), by Types 2025 & 2033
- Figure 23: Middle East & Africa Playing Cards Revenue Share (%), by Types 2025 & 2033
- Figure 24: Middle East & Africa Playing Cards Revenue (million), by Country 2025 & 2033
- Figure 25: Middle East & Africa Playing Cards Revenue Share (%), by Country 2025 & 2033
- Figure 26: Asia Pacific Playing Cards Revenue (million), by Application 2025 & 2033
- Figure 27: Asia Pacific Playing Cards Revenue Share (%), by Application 2025 & 2033
- Figure 28: Asia Pacific Playing Cards Revenue (million), by Types 2025 & 2033
- Figure 29: Asia Pacific Playing Cards Revenue Share (%), by Types 2025 & 2033
- Figure 30: Asia Pacific Playing Cards Revenue (million), by Country 2025 & 2033
- Figure 31: Asia Pacific Playing Cards Revenue Share (%), by Country 2025 & 2033
List of Tables
- Table 1: Global Playing Cards Revenue million Forecast, by Application 2020 & 2033
- Table 2: Global Playing Cards Revenue million Forecast, by Types 2020 & 2033
- Table 3: Global Playing Cards Revenue million Forecast, by Region 2020 & 2033
- Table 4: Global Playing Cards Revenue million Forecast, by Application 2020 & 2033
- Table 5: Global Playing Cards Revenue million Forecast, by Types 2020 & 2033
- Table 6: Global Playing Cards Revenue million Forecast, by Country 2020 & 2033
- Table 7: United States Playing Cards Revenue (million) Forecast, by Application 2020 & 2033
- Table 8: Canada Playing Cards Revenue (million) Forecast, by Application 2020 & 2033
- Table 9: Mexico Playing Cards Revenue (million) Forecast, by Application 2020 & 2033
- Table 10: Global Playing Cards Revenue million Forecast, by Application 2020 & 2033
- Table 11: Global Playing Cards Revenue million Forecast, by Types 2020 & 2033
- Table 12: Global Playing Cards Revenue million Forecast, by Country 2020 & 2033
- Table 13: Brazil Playing Cards Revenue (million) Forecast, by Application 2020 & 2033
- Table 14: Argentina Playing Cards Revenue (million) Forecast, by Application 2020 & 2033
- Table 15: Rest of South America Playing Cards Revenue (million) Forecast, by Application 2020 & 2033
- Table 16: Global Playing Cards Revenue million Forecast, by Application 2020 & 2033
- Table 17: Global Playing Cards Revenue million Forecast, by Types 2020 & 2033
- Table 18: Global Playing Cards Revenue million Forecast, by Country 2020 & 2033
- Table 19: United Kingdom Playing Cards Revenue (million) Forecast, by Application 2020 & 2033
- Table 20: Germany Playing Cards Revenue (million) Forecast, by Application 2020 & 2033
- Table 21: France Playing Cards Revenue (million) Forecast, by Application 2020 & 2033
- Table 22: Italy Playing Cards Revenue (million) Forecast, by Application 2020 & 2033
- Table 23: Spain Playing Cards Revenue (million) Forecast, by Application 2020 & 2033
- Table 24: Russia Playing Cards Revenue (million) Forecast, by Application 2020 & 2033
- Table 25: Benelux Playing Cards Revenue (million) Forecast, by Application 2020 & 2033
- Table 26: Nordics Playing Cards Revenue (million) Forecast, by Application 2020 & 2033
- Table 27: Rest of Europe Playing Cards Revenue (million) Forecast, by Application 2020 & 2033
- Table 28: Global Playing Cards Revenue million Forecast, by Application 2020 & 2033
- Table 29: Global Playing Cards Revenue million Forecast, by Types 2020 & 2033
- Table 30: Global Playing Cards Revenue million Forecast, by Country 2020 & 2033
- Table 31: Turkey Playing Cards Revenue (million) Forecast, by Application 2020 & 2033
- Table 32: Israel Playing Cards Revenue (million) Forecast, by Application 2020 & 2033
- Table 33: GCC Playing Cards Revenue (million) Forecast, by Application 2020 & 2033
- Table 34: North Africa Playing Cards Revenue (million) Forecast, by Application 2020 & 2033
- Table 35: South Africa Playing Cards Revenue (million) Forecast, by Application 2020 & 2033
- Table 36: Rest of Middle East & Africa Playing Cards Revenue (million) Forecast, by Application 2020 & 2033
- Table 37: Global Playing Cards Revenue million Forecast, by Application 2020 & 2033
- Table 38: Global Playing Cards Revenue million Forecast, by Types 2020 & 2033
- Table 39: Global Playing Cards Revenue million Forecast, by Country 2020 & 2033
- Table 40: China Playing Cards Revenue (million) Forecast, by Application 2020 & 2033
- Table 41: India Playing Cards Revenue (million) Forecast, by Application 2020 & 2033
- Table 42: Japan Playing Cards Revenue (million) Forecast, by Application 2020 & 2033
- Table 43: South Korea Playing Cards Revenue (million) Forecast, by Application 2020 & 2033
- Table 44: ASEAN Playing Cards Revenue (million) Forecast, by Application 2020 & 2033
- Table 45: Oceania Playing Cards Revenue (million) Forecast, by Application 2020 & 2033
- Table 46: Rest of Asia Pacific Playing Cards Revenue (million) Forecast, by Application 2020 & 2033
Frequently Asked Questions
1. What is the projected Compound Annual Growth Rate (CAGR) of the Playing Cards?
The projected CAGR is approximately 2.1%.
2. Which companies are prominent players in the Playing Cards?
Key companies in the market include Cartamundi Group, Shanghai Yaoji Playing Card Co., Ltd., Jiangsu Santu Economic&Trade Development Group Co., Ltd., Ningbo Three A Group Co., Ltd., Zhejiang Binwang Playing Cards Co., Ltd., DiaoYu, Zhejiang Brother, Guangdong Quanmei Poker Co., Ld..
3. What are the main segments of the Playing Cards?
The market segments include Application, Types.
4. Can you provide details about the market size?
The market size is estimated to be USD 2686.7 million as of 2022.
5. What are some drivers contributing to market growth?
N/A
6. What are the notable trends driving market growth?
N/A
7. Are there any restraints impacting market growth?
N/A
8. Can you provide examples of recent developments in the market?
N/A
9. What pricing options are available for accessing the report?
Pricing options include single-user, multi-user, and enterprise licenses priced at USD 5900.00, USD 8850.00, and USD 11800.00 respectively.
10. Is the market size provided in terms of value or volume?
The market size is provided in terms of value, measured in million.
11. Are there any specific market keywords associated with the report?
Yes, the market keyword associated with the report is "Playing Cards," which aids in identifying and referencing the specific market segment covered.
12. How do I determine which pricing option suits my needs best?
The pricing options vary based on user requirements and access needs. Individual users may opt for single-user licenses, while businesses requiring broader access may choose multi-user or enterprise licenses for cost-effective access to the report.
13. Are there any additional resources or data provided in the Playing Cards report?
While the report offers comprehensive insights, it's advisable to review the specific contents or supplementary materials provided to ascertain if additional resources or data are available.
14. How can I stay updated on further developments or reports in the Playing Cards?
To stay informed about further developments, trends, and reports in the Playing Cards, consider subscribing to industry newsletters, following relevant companies and organizations, or regularly checking reputable industry news sources and publications.
Methodology
Step 1 - Identification of Relevant Samples Size from Population Database


Step 2 - Approaches for Defining Global Market Size (Value, Volume* & Price*)

Note*: In applicable scenarios
Step 3 - Data Sources
Primary Research
- Web Analytics
- Survey Reports
- Research Institute
- Latest Research Reports
- Opinion Leaders
Secondary Research
- Annual Reports
- White Paper
- Latest Press Release
- Industry Association
- Paid Database
- Investor Presentations

Step 4 - Data Triangulation
Involves using different sources of information in order to increase the validity of a study
These sources are likely to be stakeholders in a program - participants, other researchers, program staff, other community members, and so on.
Then we put all data in single framework & apply various statistical tools to find out the dynamic on the market.
During the analysis stage, feedback from the stakeholder groups would be compared to determine areas of agreement as well as areas of divergence

