

Key Insights
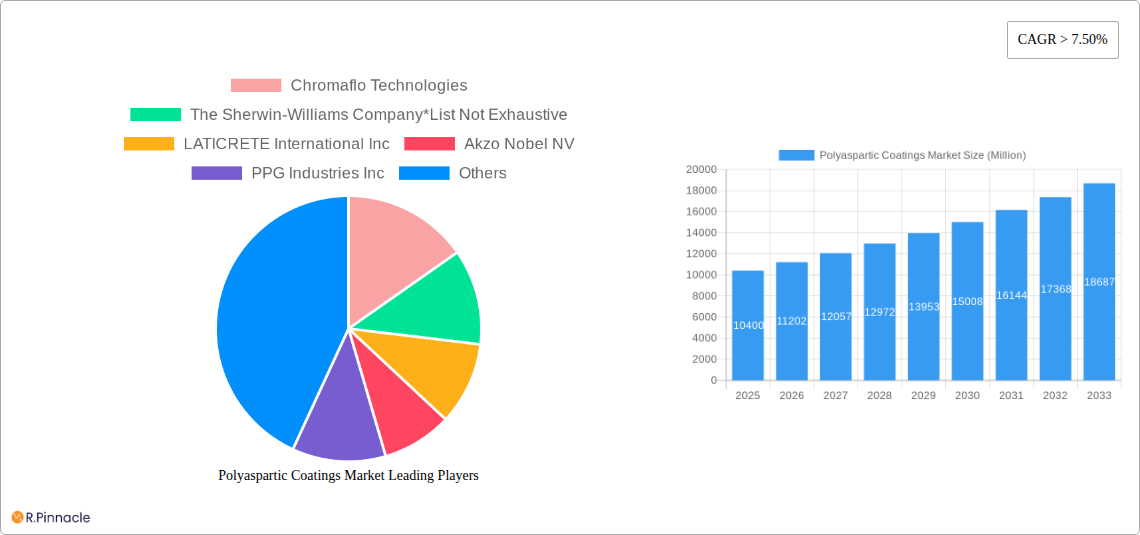
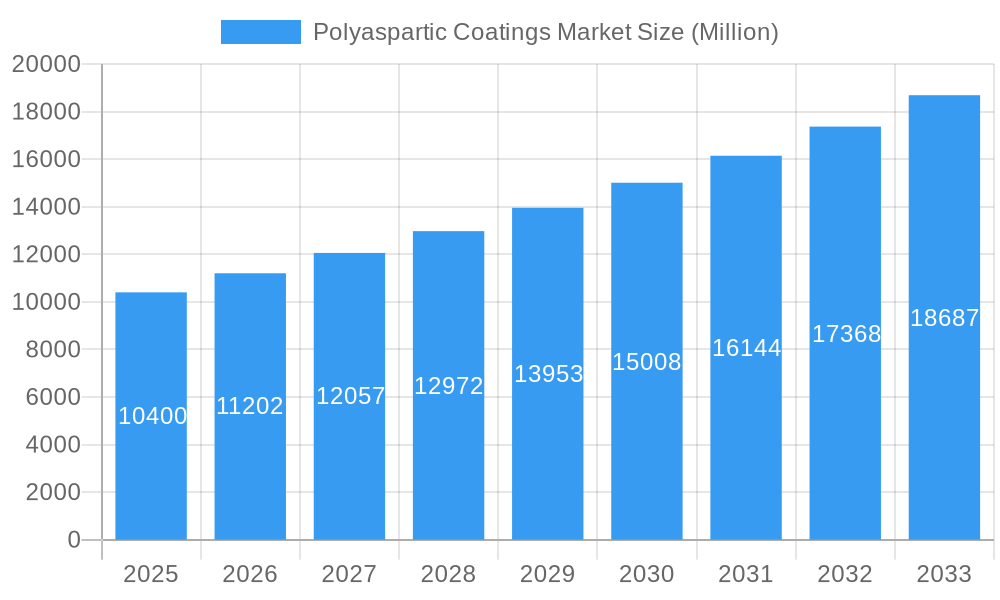
The polyaspartic coatings market is experiencing robust growth, projected to reach a market size exceeding $10.4 billion by 2025, with a Compound Annual Growth Rate (CAGR) exceeding 7.5% from 2025 to 2033. This expansion is fueled by several key drivers. The increasing demand for high-performance, durable coatings in diverse sectors like building and construction, marine applications, and infrastructure projects is a primary catalyst. Polyaspartic coatings offer superior properties compared to traditional alternatives, including rapid cure times, excellent chemical resistance, and exceptional abrasion and UV resistance. This leads to reduced project timelines, lower maintenance costs, and enhanced longevity of coated surfaces, making them particularly attractive in demanding environments. The growing awareness of sustainable building practices further bolsters market growth, as polyaspartic coatings often contain lower VOCs (volatile organic compounds) than solvent-based alternatives. Technological advancements, such as the development of innovative hybrid formulations combining the benefits of polyaspartic and other coating technologies, are also contributing to market expansion. Strong growth is anticipated across all major regions, with Asia Pacific and North America expected to lead due to significant infrastructure development and rising construction activities.
Polyaspartic Coatings Market Market Size (In Billion)
Competitive intensity within the polyaspartic coatings market is high, with established players like Sherwin-Williams, Akzo Nobel, and BASF competing alongside specialized manufacturers like Polyval Coatings and Flexmar Polyaspartics. The market is characterized by continuous innovation in product formulations and application techniques, driving ongoing competition. The presence of a diverse range of end-user industries ensures broad market penetration and reduces reliance on any single sector. However, potential restraints include the relatively higher initial cost compared to some traditional coating systems and the need for specialized application equipment, which could limit widespread adoption in certain segments. Nonetheless, the long-term benefits of enhanced durability and reduced maintenance costs are expected to outweigh these initial investment considerations, ensuring continued strong growth for the polyaspartic coatings market throughout the forecast period.
Polyaspartic Coatings Market Company Market Share
Polyaspartic Coatings Market: A Comprehensive Report (2019-2033)
This in-depth report provides a comprehensive analysis of the Polyaspartic Coatings market, offering actionable insights for industry professionals and strategic decision-makers. With a study period spanning 2019-2033, a base year of 2025, and a forecast period of 2025-2033, this report delivers a granular view of market dynamics, segmentation, and future growth potential. The report is meticulously structured to provide clear and concise information, backed by robust data and analysis.
Polyaspartic Coatings Market Structure & Innovation Trends
This section analyzes the competitive landscape, innovation drivers, and regulatory factors shaping the polyaspartic coatings market. The market exhibits a moderately concentrated structure, with key players such as The Sherwin-Williams Company, Akzo Nobel NV, BASF SE, PPG Industries Inc, and Sika AG holding significant market share. However, the presence of several smaller, specialized players fosters competition and innovation. The combined market share of the top five players is estimated at xx%.
- Market Concentration: Moderately concentrated with a xx% market share held by the top 5 players.
- Innovation Drivers: Demand for high-performance, durable coatings, coupled with stringent environmental regulations, drives innovation in water-borne and sustainable formulations.
- Regulatory Frameworks: Regulations concerning VOC emissions and sustainability are influencing product development and market growth.
- Product Substitutes: Epoxy and polyurethane coatings pose competition, yet polyaspartics offer superior performance in specific applications.
- End-User Demographics: The market is driven by diverse end-user industries, including building & construction, infrastructure, and marine, each with unique coating needs.
- M&A Activities: The past five years have witnessed xx M&A deals valued at approximately $xx Million, reflecting industry consolidation and expansion strategies. Examples include [insert specific examples if available, otherwise remove this sentence].
Polyaspartic Coatings Market Dynamics & Trends
The global polyaspartic coatings market is experiencing robust growth, driven by several key factors. The market is projected to reach $xx Million by 2033, exhibiting a CAGR of xx% during the forecast period (2025-2033). This growth is fueled by the increasing demand for high-performance coatings in diverse applications, coupled with technological advancements in formulation and application techniques. Consumer preference for durable, aesthetically pleasing, and environmentally friendly coatings is also driving market expansion. The market penetration rate of polyaspartic coatings is currently at xx% and is projected to reach xx% by 2033. Competitive dynamics are intense, with established players focusing on innovation and expansion into new markets while new entrants target niche applications.
Dominant Regions & Segments in Polyaspartic Coatings Market
The North American region currently holds the largest market share, primarily driven by strong construction activity and infrastructure development. However, the Asia-Pacific region is poised for rapid growth due to increasing industrialization and infrastructure projects.
Key Drivers by Segment:
- Technology:
- Water-borne: Growing preference for eco-friendly options.
- Solvent-borne: High performance characteristics in demanding applications.
- Powder Coatings: Increasing adoption due to sustainability benefits.
- Type:
- Pure Polyaspartic Coatings: Superior performance characteristics command a premium price.
- Hybrid Polyaspartic Coatings: Cost-effectiveness and balanced properties drive adoption.
- End-user Industry:
- Building and Construction: Largest segment due to high demand for durable floor and protective coatings.
- Marine: Stringent requirements for corrosion protection fuel segment growth.
- Infrastructure: Long-lasting, high-performance coatings for bridges, roads, and other structures.
- Power Generation: Resistance to extreme conditions crucial in power plants.
Polyaspartic Coatings Market Product Innovations
Recent innovations in polyaspartic coatings focus on improving durability, enhancing aesthetics, and reducing environmental impact. Developments include self-leveling formulations, UV-resistant coatings, and the incorporation of antimicrobial agents. These advancements cater to the growing demand for high-performance coatings across various end-user industries, offering competitive advantages in terms of performance, sustainability, and cost-effectiveness. Increased use of water-based formulations represents a significant trend.
Report Scope & Segmentation Analysis
This report provides a detailed segmentation analysis of the polyaspartic coatings market across technology (water-borne, solvent-borne, powder coatings, other technologies), type (pure polyaspartic coatings, hybrid polyaspartic coatings), and end-user industry (building and construction, marine, infrastructure, power generation, other end-user industries). The report provides market size estimations, growth projections, and competitive landscape analysis for each segment. Specific market sizes for each segment are detailed in the full report.
Key Drivers of Polyaspartic Coatings Market Growth
The polyaspartic coatings market is fueled by several key drivers, including:
- Increasing demand for high-performance coatings: The need for durable, long-lasting coatings in demanding environments.
- Stringent environmental regulations: The drive towards eco-friendly, low-VOC coatings.
- Advancements in formulation and application technologies: Improved efficiency and performance of coatings.
- Growth in end-user industries: Expansion in construction, infrastructure, and industrial sectors.
Challenges in the Polyaspartic Coatings Market Sector
The market faces challenges such as:
- High initial investment costs: The cost of specialized equipment and trained personnel can be prohibitive for some users.
- Supply chain disruptions: Fluctuations in raw material prices and availability.
- Intense competition: Competition from established and emerging players.
- Regulatory compliance: Adherence to stringent environmental and safety regulations.
Emerging Opportunities in Polyaspartic Coatings Market
Emerging opportunities lie in:
- Expansion into new markets: Growing demand in developing economies presents lucrative opportunities.
- Development of specialized coatings: Tailored coatings for specific applications (e.g., anti-graffiti, anti-fouling).
- Adoption of sustainable practices: The use of bio-based raw materials and recycled content.
- Innovation in application technologies: Improved efficiency and reduced labor costs.
Leading Players in the Polyaspartic Coatings Market Market
- Chromaflo Technologies
- The Sherwin-Williams Company
- LATICRETE International Inc
- Akzo Nobel NV
- PPG Industries Inc
- Enviro Epoxy Products Inc
- BASF SE
- Iron Man Coatings
- Carboline Inc
- Polyval Coatings Inc
- Flexmar Polyaspartics
- NEOGARD
- Sika AG
- Covestro AG
- Duraamen Engineered Products Inc
- RPM International
- Florock
Key Developments in Polyaspartic Coatings Market Industry
- [Insert specific developments with year/month and brief description of impact on market dynamics. Example: January 2024 - Sherwin-Williams launched a new water-based polyaspartic coating, increasing competition in the eco-friendly segment.]
Future Outlook for Polyaspartic Coatings Market Market
The polyaspartic coatings market is poised for continued growth, driven by increasing demand across diverse applications and ongoing technological advancements. The market will benefit from sustained infrastructure development, growing awareness of sustainable coatings, and innovation in application technologies. Strategic partnerships, product diversification, and expansion into emerging markets will be crucial for success in this dynamic market. The focus on sustainability and high-performance will continue to shape the future of this industry.
Polyaspartic Coatings Market Segmentation
-
1. Technology
- 1.1. Water-borne
- 1.2. Solvent-borne
- 1.3. Powder Coatings
- 1.4. Other Technologies
-
2. Type
- 2.1. Pure Polyaspartic Coatings
- 2.2. Hybrid Polyaspartic Coatings
-
3. End-user Industry
- 3.1. Building and Construction
- 3.2. Marine
- 3.3. Infrastructure
- 3.4. Power Generation
- 3.5. Other End-user Industries
Polyaspartic Coatings Market Segmentation By Geography
-
1. Asia Pacific
- 1.1. China
- 1.2. India
- 1.3. Japan
- 1.4. South Korea
- 1.5. Rest of Asia Pacific
-
2. North America
- 2.1. United States
- 2.2. Canada
- 2.3. Mexico
-
3. Europe
- 3.1. Germany
- 3.2. United Kingdom
- 3.3. Italy
- 3.4. France
- 3.5. Rest of Europe
-
4. South America
- 4.1. Brazil
- 4.2. Argentina
- 4.3. Rest of South America
- 5. Middle East
-
6. Saudi Arabia
- 6.1. South Africa
- 6.2. Rest of Middle East
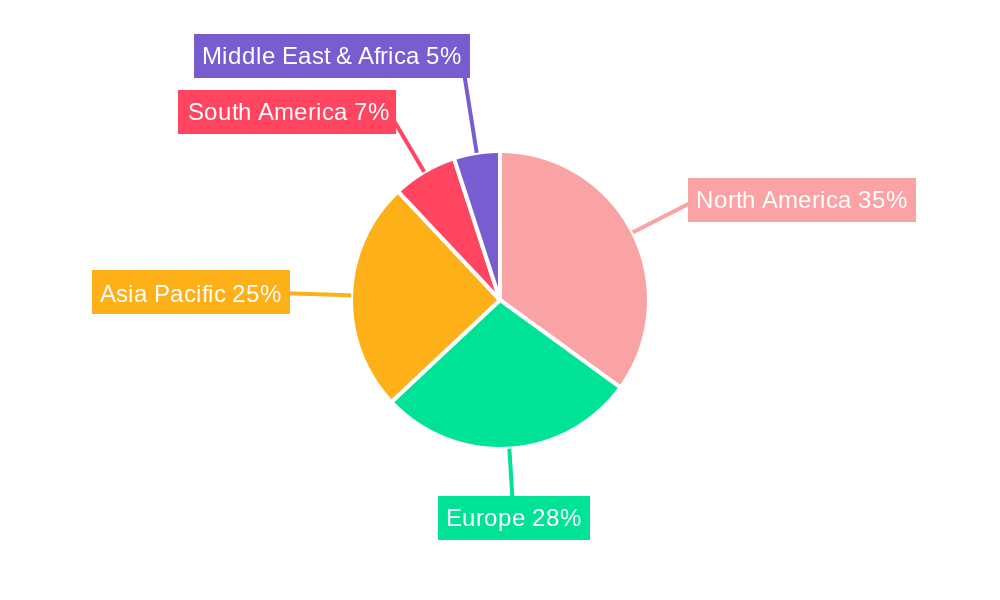
Polyaspartic Coatings Market Regional Market Share
Geographic Coverage of Polyaspartic Coatings Market
Polyaspartic Coatings Market REPORT HIGHLIGHTS
| Aspects | Details |
|---|---|
| Study Period | 2020-2034 |
| Base Year | 2025 |
| Estimated Year | 2026 |
| Forecast Period | 2026-2034 |
| Historical Period | 2020-2025 |
| Growth Rate | CAGR of > 7.50% from 2020-2034 |
| Segmentation |
|
Table of Contents
- 1. Introduction
- 1.1. Research Scope
- 1.2. Market Segmentation
- 1.3. Research Objective
- 1.4. Definitions and Assumptions
- 2. Executive Summary
- 2.1. Market Snapshot
- 3. Market Dynamics
- 3.1. Market Drivers
- 3.2. Market Restrains
- 3.3. Market Trends
- 3.4. Market Opportunities
- 4. Market Factor Analysis
- 4.1. Porters Five Forces
- 4.1.1. Bargaining Power of Suppliers
- 4.1.2. Bargaining Power of Buyers
- 4.1.3. Threat of New Entrants
- 4.1.4. Threat of Substitutes
- 4.1.5. Competitive Rivalry
- 4.2. PESTEL analysis
- 4.3. BCG Analysis
- 4.3.1. Stars (High Growth, High Market Share)
- 4.3.2. Cash Cows (Low Growth, High Market Share)
- 4.3.3. Question Mark (High Growth, Low Market Share)
- 4.3.4. Dogs (Low Growth, Low Market Share)
- 4.4. Ansoff Matrix Analysis
- 4.5. Supply Chain Analysis
- 4.6. Regulatory Landscape
- 4.7. Current Market Potential and Opportunity Assessment (TAM–SAM–SOM Framework)
- 4.8. PRI Analyst Note
- 4.1. Porters Five Forces
- 5. Market Analysis, Insights and Forecast 2021-2033
- 5.1. Market Analysis, Insights and Forecast - by Technology
- 5.1.1. Water-borne
- 5.1.2. Solvent-borne
- 5.1.3. Powder Coatings
- 5.1.4. Other Technologies
- 5.2. Market Analysis, Insights and Forecast - by Type
- 5.2.1. Pure Polyaspartic Coatings
- 5.2.2. Hybrid Polyaspartic Coatings
- 5.3. Market Analysis, Insights and Forecast - by End-user Industry
- 5.3.1. Building and Construction
- 5.3.2. Marine
- 5.3.3. Infrastructure
- 5.3.4. Power Generation
- 5.3.5. Other End-user Industries
- 5.4. Market Analysis, Insights and Forecast - by Region
- 5.4.1. Asia Pacific
- 5.4.2. North America
- 5.4.3. Europe
- 5.4.4. South America
- 5.4.5. Middle East
- 5.4.6. Saudi Arabia
- 5.1. Market Analysis, Insights and Forecast - by Technology
- 6. Global Polyaspartic Coatings Market Analysis, Insights and Forecast, 2021-2033
- 6.1. Market Analysis, Insights and Forecast - by Technology
- 6.1.1. Water-borne
- 6.1.2. Solvent-borne
- 6.1.3. Powder Coatings
- 6.1.4. Other Technologies
- 6.2. Market Analysis, Insights and Forecast - by Type
- 6.2.1. Pure Polyaspartic Coatings
- 6.2.2. Hybrid Polyaspartic Coatings
- 6.3. Market Analysis, Insights and Forecast - by End-user Industry
- 6.3.1. Building and Construction
- 6.3.2. Marine
- 6.3.3. Infrastructure
- 6.3.4. Power Generation
- 6.3.5. Other End-user Industries
- 6.1. Market Analysis, Insights and Forecast - by Technology
- 7. Asia Pacific Polyaspartic Coatings Market Analysis, Insights and Forecast, 2020-2032
- 7.1. Market Analysis, Insights and Forecast - by Technology
- 7.1.1. Water-borne
- 7.1.2. Solvent-borne
- 7.1.3. Powder Coatings
- 7.1.4. Other Technologies
- 7.2. Market Analysis, Insights and Forecast - by Type
- 7.2.1. Pure Polyaspartic Coatings
- 7.2.2. Hybrid Polyaspartic Coatings
- 7.3. Market Analysis, Insights and Forecast - by End-user Industry
- 7.3.1. Building and Construction
- 7.3.2. Marine
- 7.3.3. Infrastructure
- 7.3.4. Power Generation
- 7.3.5. Other End-user Industries
- 7.1. Market Analysis, Insights and Forecast - by Technology
- 8. North America Polyaspartic Coatings Market Analysis, Insights and Forecast, 2020-2032
- 8.1. Market Analysis, Insights and Forecast - by Technology
- 8.1.1. Water-borne
- 8.1.2. Solvent-borne
- 8.1.3. Powder Coatings
- 8.1.4. Other Technologies
- 8.2. Market Analysis, Insights and Forecast - by Type
- 8.2.1. Pure Polyaspartic Coatings
- 8.2.2. Hybrid Polyaspartic Coatings
- 8.3. Market Analysis, Insights and Forecast - by End-user Industry
- 8.3.1. Building and Construction
- 8.3.2. Marine
- 8.3.3. Infrastructure
- 8.3.4. Power Generation
- 8.3.5. Other End-user Industries
- 8.1. Market Analysis, Insights and Forecast - by Technology
- 9. Europe Polyaspartic Coatings Market Analysis, Insights and Forecast, 2020-2032
- 9.1. Market Analysis, Insights and Forecast - by Technology
- 9.1.1. Water-borne
- 9.1.2. Solvent-borne
- 9.1.3. Powder Coatings
- 9.1.4. Other Technologies
- 9.2. Market Analysis, Insights and Forecast - by Type
- 9.2.1. Pure Polyaspartic Coatings
- 9.2.2. Hybrid Polyaspartic Coatings
- 9.3. Market Analysis, Insights and Forecast - by End-user Industry
- 9.3.1. Building and Construction
- 9.3.2. Marine
- 9.3.3. Infrastructure
- 9.3.4. Power Generation
- 9.3.5. Other End-user Industries
- 9.1. Market Analysis, Insights and Forecast - by Technology
- 10. South America Polyaspartic Coatings Market Analysis, Insights and Forecast, 2020-2032
- 10.1. Market Analysis, Insights and Forecast - by Technology
- 10.1.1. Water-borne
- 10.1.2. Solvent-borne
- 10.1.3. Powder Coatings
- 10.1.4. Other Technologies
- 10.2. Market Analysis, Insights and Forecast - by Type
- 10.2.1. Pure Polyaspartic Coatings
- 10.2.2. Hybrid Polyaspartic Coatings
- 10.3. Market Analysis, Insights and Forecast - by End-user Industry
- 10.3.1. Building and Construction
- 10.3.2. Marine
- 10.3.3. Infrastructure
- 10.3.4. Power Generation
- 10.3.5. Other End-user Industries
- 10.1. Market Analysis, Insights and Forecast - by Technology
- 11. Middle East Polyaspartic Coatings Market Analysis, Insights and Forecast, 2020-2032
- 11.1. Market Analysis, Insights and Forecast - by Technology
- 11.1.1. Water-borne
- 11.1.2. Solvent-borne
- 11.1.3. Powder Coatings
- 11.1.4. Other Technologies
- 11.2. Market Analysis, Insights and Forecast - by Type
- 11.2.1. Pure Polyaspartic Coatings
- 11.2.2. Hybrid Polyaspartic Coatings
- 11.3. Market Analysis, Insights and Forecast - by End-user Industry
- 11.3.1. Building and Construction
- 11.3.2. Marine
- 11.3.3. Infrastructure
- 11.3.4. Power Generation
- 11.3.5. Other End-user Industries
- 11.1. Market Analysis, Insights and Forecast - by Technology
- 12. Saudi Arabia Polyaspartic Coatings Market Analysis, Insights and Forecast, 2020-2032
- 12.1. Market Analysis, Insights and Forecast - by Technology
- 12.1.1. Water-borne
- 12.1.2. Solvent-borne
- 12.1.3. Powder Coatings
- 12.1.4. Other Technologies
- 12.2. Market Analysis, Insights and Forecast - by Type
- 12.2.1. Pure Polyaspartic Coatings
- 12.2.2. Hybrid Polyaspartic Coatings
- 12.3. Market Analysis, Insights and Forecast - by End-user Industry
- 12.3.1. Building and Construction
- 12.3.2. Marine
- 12.3.3. Infrastructure
- 12.3.4. Power Generation
- 12.3.5. Other End-user Industries
- 12.1. Market Analysis, Insights and Forecast - by Technology
- 13. Competitive Analysis
- 13.1. Company Profiles
- 13.1.1 Chromaflo Technologies
- 13.1.1.1. Company Overview
- 13.1.1.2. Products
- 13.1.1.3. Company Financials
- 13.1.1.4. SWOT Analysis
- 13.1.2 The Sherwin-Williams Company*List Not Exhaustive
- 13.1.2.1. Company Overview
- 13.1.2.2. Products
- 13.1.2.3. Company Financials
- 13.1.2.4. SWOT Analysis
- 13.1.3 LATICRETE International Inc
- 13.1.3.1. Company Overview
- 13.1.3.2. Products
- 13.1.3.3. Company Financials
- 13.1.3.4. SWOT Analysis
- 13.1.4 Akzo Nobel NV
- 13.1.4.1. Company Overview
- 13.1.4.2. Products
- 13.1.4.3. Company Financials
- 13.1.4.4. SWOT Analysis
- 13.1.5 PPG Industries Inc
- 13.1.5.1. Company Overview
- 13.1.5.2. Products
- 13.1.5.3. Company Financials
- 13.1.5.4. SWOT Analysis
- 13.1.6 Enviro Epoxy Products Inc
- 13.1.6.1. Company Overview
- 13.1.6.2. Products
- 13.1.6.3. Company Financials
- 13.1.6.4. SWOT Analysis
- 13.1.7 BASF SE
- 13.1.7.1. Company Overview
- 13.1.7.2. Products
- 13.1.7.3. Company Financials
- 13.1.7.4. SWOT Analysis
- 13.1.8 Iron Man Coatings
- 13.1.8.1. Company Overview
- 13.1.8.2. Products
- 13.1.8.3. Company Financials
- 13.1.8.4. SWOT Analysis
- 13.1.9 Carboline Inc
- 13.1.9.1. Company Overview
- 13.1.9.2. Products
- 13.1.9.3. Company Financials
- 13.1.9.4. SWOT Analysis
- 13.1.10 Polyval Coatings Inc
- 13.1.10.1. Company Overview
- 13.1.10.2. Products
- 13.1.10.3. Company Financials
- 13.1.10.4. SWOT Analysis
- 13.1.11 Flexmar Polyaspartics
- 13.1.11.1. Company Overview
- 13.1.11.2. Products
- 13.1.11.3. Company Financials
- 13.1.11.4. SWOT Analysis
- 13.1.12 NEOGARD
- 13.1.12.1. Company Overview
- 13.1.12.2. Products
- 13.1.12.3. Company Financials
- 13.1.12.4. SWOT Analysis
- 13.1.13 Sika AG
- 13.1.13.1. Company Overview
- 13.1.13.2. Products
- 13.1.13.3. Company Financials
- 13.1.13.4. SWOT Analysis
- 13.1.14 Covestro AG
- 13.1.14.1. Company Overview
- 13.1.14.2. Products
- 13.1.14.3. Company Financials
- 13.1.14.4. SWOT Analysis
- 13.1.15 Duraamen Engineered Products Inc
- 13.1.15.1. Company Overview
- 13.1.15.2. Products
- 13.1.15.3. Company Financials
- 13.1.15.4. SWOT Analysis
- 13.1.16 RPM International
- 13.1.16.1. Company Overview
- 13.1.16.2. Products
- 13.1.16.3. Company Financials
- 13.1.16.4. SWOT Analysis
- 13.1.17 Florock
- 13.1.17.1. Company Overview
- 13.1.17.2. Products
- 13.1.17.3. Company Financials
- 13.1.17.4. SWOT Analysis
- 13.1.1 Chromaflo Technologies
- 13.2. Market Entropy
- 13.2.1 Company's Key Areas Served
- 13.2.2 Recent Developments
- 13.3. Company Market Share Analysis 2025
- 13.3.1 Top 5 Companies Market Share Analysis
- 13.3.2 Top 3 Companies Market Share Analysis
- 13.4. List of Potential Customers
- 14. Research Methodology
List of Figures
- Figure 1: Global Polyaspartic Coatings Market Revenue Breakdown (Million, %) by Region 2025 & 2033
- Figure 2: Global Polyaspartic Coatings Market Volume Breakdown (liter , %) by Region 2025 & 2033
- Figure 3: Asia Pacific Polyaspartic Coatings Market Revenue (Million), by Technology 2025 & 2033
- Figure 4: Asia Pacific Polyaspartic Coatings Market Volume (liter ), by Technology 2025 & 2033
- Figure 5: Asia Pacific Polyaspartic Coatings Market Revenue Share (%), by Technology 2025 & 2033
- Figure 6: Asia Pacific Polyaspartic Coatings Market Volume Share (%), by Technology 2025 & 2033
- Figure 7: Asia Pacific Polyaspartic Coatings Market Revenue (Million), by Type 2025 & 2033
- Figure 8: Asia Pacific Polyaspartic Coatings Market Volume (liter ), by Type 2025 & 2033
- Figure 9: Asia Pacific Polyaspartic Coatings Market Revenue Share (%), by Type 2025 & 2033
- Figure 10: Asia Pacific Polyaspartic Coatings Market Volume Share (%), by Type 2025 & 2033
- Figure 11: Asia Pacific Polyaspartic Coatings Market Revenue (Million), by End-user Industry 2025 & 2033
- Figure 12: Asia Pacific Polyaspartic Coatings Market Volume (liter ), by End-user Industry 2025 & 2033
- Figure 13: Asia Pacific Polyaspartic Coatings Market Revenue Share (%), by End-user Industry 2025 & 2033
- Figure 14: Asia Pacific Polyaspartic Coatings Market Volume Share (%), by End-user Industry 2025 & 2033
- Figure 15: Asia Pacific Polyaspartic Coatings Market Revenue (Million), by Country 2025 & 2033
- Figure 16: Asia Pacific Polyaspartic Coatings Market Volume (liter ), by Country 2025 & 2033
- Figure 17: Asia Pacific Polyaspartic Coatings Market Revenue Share (%), by Country 2025 & 2033
- Figure 18: Asia Pacific Polyaspartic Coatings Market Volume Share (%), by Country 2025 & 2033
- Figure 19: North America Polyaspartic Coatings Market Revenue (Million), by Technology 2025 & 2033
- Figure 20: North America Polyaspartic Coatings Market Volume (liter ), by Technology 2025 & 2033
- Figure 21: North America Polyaspartic Coatings Market Revenue Share (%), by Technology 2025 & 2033
- Figure 22: North America Polyaspartic Coatings Market Volume Share (%), by Technology 2025 & 2033
- Figure 23: North America Polyaspartic Coatings Market Revenue (Million), by Type 2025 & 2033
- Figure 24: North America Polyaspartic Coatings Market Volume (liter ), by Type 2025 & 2033
- Figure 25: North America Polyaspartic Coatings Market Revenue Share (%), by Type 2025 & 2033
- Figure 26: North America Polyaspartic Coatings Market Volume Share (%), by Type 2025 & 2033
- Figure 27: North America Polyaspartic Coatings Market Revenue (Million), by End-user Industry 2025 & 2033
- Figure 28: North America Polyaspartic Coatings Market Volume (liter ), by End-user Industry 2025 & 2033
- Figure 29: North America Polyaspartic Coatings Market Revenue Share (%), by End-user Industry 2025 & 2033
- Figure 30: North America Polyaspartic Coatings Market Volume Share (%), by End-user Industry 2025 & 2033
- Figure 31: North America Polyaspartic Coatings Market Revenue (Million), by Country 2025 & 2033
- Figure 32: North America Polyaspartic Coatings Market Volume (liter ), by Country 2025 & 2033
- Figure 33: North America Polyaspartic Coatings Market Revenue Share (%), by Country 2025 & 2033
- Figure 34: North America Polyaspartic Coatings Market Volume Share (%), by Country 2025 & 2033
- Figure 35: Europe Polyaspartic Coatings Market Revenue (Million), by Technology 2025 & 2033
- Figure 36: Europe Polyaspartic Coatings Market Volume (liter ), by Technology 2025 & 2033
- Figure 37: Europe Polyaspartic Coatings Market Revenue Share (%), by Technology 2025 & 2033
- Figure 38: Europe Polyaspartic Coatings Market Volume Share (%), by Technology 2025 & 2033
- Figure 39: Europe Polyaspartic Coatings Market Revenue (Million), by Type 2025 & 2033
- Figure 40: Europe Polyaspartic Coatings Market Volume (liter ), by Type 2025 & 2033
- Figure 41: Europe Polyaspartic Coatings Market Revenue Share (%), by Type 2025 & 2033
- Figure 42: Europe Polyaspartic Coatings Market Volume Share (%), by Type 2025 & 2033
- Figure 43: Europe Polyaspartic Coatings Market Revenue (Million), by End-user Industry 2025 & 2033
- Figure 44: Europe Polyaspartic Coatings Market Volume (liter ), by End-user Industry 2025 & 2033
- Figure 45: Europe Polyaspartic Coatings Market Revenue Share (%), by End-user Industry 2025 & 2033
- Figure 46: Europe Polyaspartic Coatings Market Volume Share (%), by End-user Industry 2025 & 2033
- Figure 47: Europe Polyaspartic Coatings Market Revenue (Million), by Country 2025 & 2033
- Figure 48: Europe Polyaspartic Coatings Market Volume (liter ), by Country 2025 & 2033
- Figure 49: Europe Polyaspartic Coatings Market Revenue Share (%), by Country 2025 & 2033
- Figure 50: Europe Polyaspartic Coatings Market Volume Share (%), by Country 2025 & 2033
- Figure 51: South America Polyaspartic Coatings Market Revenue (Million), by Technology 2025 & 2033
- Figure 52: South America Polyaspartic Coatings Market Volume (liter ), by Technology 2025 & 2033
- Figure 53: South America Polyaspartic Coatings Market Revenue Share (%), by Technology 2025 & 2033
- Figure 54: South America Polyaspartic Coatings Market Volume Share (%), by Technology 2025 & 2033
- Figure 55: South America Polyaspartic Coatings Market Revenue (Million), by Type 2025 & 2033
- Figure 56: South America Polyaspartic Coatings Market Volume (liter ), by Type 2025 & 2033
- Figure 57: South America Polyaspartic Coatings Market Revenue Share (%), by Type 2025 & 2033
- Figure 58: South America Polyaspartic Coatings Market Volume Share (%), by Type 2025 & 2033
- Figure 59: South America Polyaspartic Coatings Market Revenue (Million), by End-user Industry 2025 & 2033
- Figure 60: South America Polyaspartic Coatings Market Volume (liter ), by End-user Industry 2025 & 2033
- Figure 61: South America Polyaspartic Coatings Market Revenue Share (%), by End-user Industry 2025 & 2033
- Figure 62: South America Polyaspartic Coatings Market Volume Share (%), by End-user Industry 2025 & 2033
- Figure 63: South America Polyaspartic Coatings Market Revenue (Million), by Country 2025 & 2033
- Figure 64: South America Polyaspartic Coatings Market Volume (liter ), by Country 2025 & 2033
- Figure 65: South America Polyaspartic Coatings Market Revenue Share (%), by Country 2025 & 2033
- Figure 66: South America Polyaspartic Coatings Market Volume Share (%), by Country 2025 & 2033
- Figure 67: Middle East Polyaspartic Coatings Market Revenue (Million), by Technology 2025 & 2033
- Figure 68: Middle East Polyaspartic Coatings Market Volume (liter ), by Technology 2025 & 2033
- Figure 69: Middle East Polyaspartic Coatings Market Revenue Share (%), by Technology 2025 & 2033
- Figure 70: Middle East Polyaspartic Coatings Market Volume Share (%), by Technology 2025 & 2033
- Figure 71: Middle East Polyaspartic Coatings Market Revenue (Million), by Type 2025 & 2033
- Figure 72: Middle East Polyaspartic Coatings Market Volume (liter ), by Type 2025 & 2033
- Figure 73: Middle East Polyaspartic Coatings Market Revenue Share (%), by Type 2025 & 2033
- Figure 74: Middle East Polyaspartic Coatings Market Volume Share (%), by Type 2025 & 2033
- Figure 75: Middle East Polyaspartic Coatings Market Revenue (Million), by End-user Industry 2025 & 2033
- Figure 76: Middle East Polyaspartic Coatings Market Volume (liter ), by End-user Industry 2025 & 2033
- Figure 77: Middle East Polyaspartic Coatings Market Revenue Share (%), by End-user Industry 2025 & 2033
- Figure 78: Middle East Polyaspartic Coatings Market Volume Share (%), by End-user Industry 2025 & 2033
- Figure 79: Middle East Polyaspartic Coatings Market Revenue (Million), by Country 2025 & 2033
- Figure 80: Middle East Polyaspartic Coatings Market Volume (liter ), by Country 2025 & 2033
- Figure 81: Middle East Polyaspartic Coatings Market Revenue Share (%), by Country 2025 & 2033
- Figure 82: Middle East Polyaspartic Coatings Market Volume Share (%), by Country 2025 & 2033
- Figure 83: Saudi Arabia Polyaspartic Coatings Market Revenue (Million), by Technology 2025 & 2033
- Figure 84: Saudi Arabia Polyaspartic Coatings Market Volume (liter ), by Technology 2025 & 2033
- Figure 85: Saudi Arabia Polyaspartic Coatings Market Revenue Share (%), by Technology 2025 & 2033
- Figure 86: Saudi Arabia Polyaspartic Coatings Market Volume Share (%), by Technology 2025 & 2033
- Figure 87: Saudi Arabia Polyaspartic Coatings Market Revenue (Million), by Type 2025 & 2033
- Figure 88: Saudi Arabia Polyaspartic Coatings Market Volume (liter ), by Type 2025 & 2033
- Figure 89: Saudi Arabia Polyaspartic Coatings Market Revenue Share (%), by Type 2025 & 2033
- Figure 90: Saudi Arabia Polyaspartic Coatings Market Volume Share (%), by Type 2025 & 2033
- Figure 91: Saudi Arabia Polyaspartic Coatings Market Revenue (Million), by End-user Industry 2025 & 2033
- Figure 92: Saudi Arabia Polyaspartic Coatings Market Volume (liter ), by End-user Industry 2025 & 2033
- Figure 93: Saudi Arabia Polyaspartic Coatings Market Revenue Share (%), by End-user Industry 2025 & 2033
- Figure 94: Saudi Arabia Polyaspartic Coatings Market Volume Share (%), by End-user Industry 2025 & 2033
- Figure 95: Saudi Arabia Polyaspartic Coatings Market Revenue (Million), by Country 2025 & 2033
- Figure 96: Saudi Arabia Polyaspartic Coatings Market Volume (liter ), by Country 2025 & 2033
- Figure 97: Saudi Arabia Polyaspartic Coatings Market Revenue Share (%), by Country 2025 & 2033
- Figure 98: Saudi Arabia Polyaspartic Coatings Market Volume Share (%), by Country 2025 & 2033
List of Tables
- Table 1: Global Polyaspartic Coatings Market Revenue Million Forecast, by Technology 2020 & 2033
- Table 2: Global Polyaspartic Coatings Market Volume liter Forecast, by Technology 2020 & 2033
- Table 3: Global Polyaspartic Coatings Market Revenue Million Forecast, by Type 2020 & 2033
- Table 4: Global Polyaspartic Coatings Market Volume liter Forecast, by Type 2020 & 2033
- Table 5: Global Polyaspartic Coatings Market Revenue Million Forecast, by End-user Industry 2020 & 2033
- Table 6: Global Polyaspartic Coatings Market Volume liter Forecast, by End-user Industry 2020 & 2033
- Table 7: Global Polyaspartic Coatings Market Revenue Million Forecast, by Region 2020 & 2033
- Table 8: Global Polyaspartic Coatings Market Volume liter Forecast, by Region 2020 & 2033
- Table 9: Global Polyaspartic Coatings Market Revenue Million Forecast, by Technology 2020 & 2033
- Table 10: Global Polyaspartic Coatings Market Volume liter Forecast, by Technology 2020 & 2033
- Table 11: Global Polyaspartic Coatings Market Revenue Million Forecast, by Type 2020 & 2033
- Table 12: Global Polyaspartic Coatings Market Volume liter Forecast, by Type 2020 & 2033
- Table 13: Global Polyaspartic Coatings Market Revenue Million Forecast, by End-user Industry 2020 & 2033
- Table 14: Global Polyaspartic Coatings Market Volume liter Forecast, by End-user Industry 2020 & 2033
- Table 15: Global Polyaspartic Coatings Market Revenue Million Forecast, by Country 2020 & 2033
- Table 16: Global Polyaspartic Coatings Market Volume liter Forecast, by Country 2020 & 2033
- Table 17: China Polyaspartic Coatings Market Revenue (Million) Forecast, by Application 2020 & 2033
- Table 18: China Polyaspartic Coatings Market Volume (liter ) Forecast, by Application 2020 & 2033
- Table 19: India Polyaspartic Coatings Market Revenue (Million) Forecast, by Application 2020 & 2033
- Table 20: India Polyaspartic Coatings Market Volume (liter ) Forecast, by Application 2020 & 2033
- Table 21: Japan Polyaspartic Coatings Market Revenue (Million) Forecast, by Application 2020 & 2033
- Table 22: Japan Polyaspartic Coatings Market Volume (liter ) Forecast, by Application 2020 & 2033
- Table 23: South Korea Polyaspartic Coatings Market Revenue (Million) Forecast, by Application 2020 & 2033
- Table 24: South Korea Polyaspartic Coatings Market Volume (liter ) Forecast, by Application 2020 & 2033
- Table 25: Rest of Asia Pacific Polyaspartic Coatings Market Revenue (Million) Forecast, by Application 2020 & 2033
- Table 26: Rest of Asia Pacific Polyaspartic Coatings Market Volume (liter ) Forecast, by Application 2020 & 2033
- Table 27: Global Polyaspartic Coatings Market Revenue Million Forecast, by Technology 2020 & 2033
- Table 28: Global Polyaspartic Coatings Market Volume liter Forecast, by Technology 2020 & 2033
- Table 29: Global Polyaspartic Coatings Market Revenue Million Forecast, by Type 2020 & 2033
- Table 30: Global Polyaspartic Coatings Market Volume liter Forecast, by Type 2020 & 2033
- Table 31: Global Polyaspartic Coatings Market Revenue Million Forecast, by End-user Industry 2020 & 2033
- Table 32: Global Polyaspartic Coatings Market Volume liter Forecast, by End-user Industry 2020 & 2033
- Table 33: Global Polyaspartic Coatings Market Revenue Million Forecast, by Country 2020 & 2033
- Table 34: Global Polyaspartic Coatings Market Volume liter Forecast, by Country 2020 & 2033
- Table 35: United States Polyaspartic Coatings Market Revenue (Million) Forecast, by Application 2020 & 2033
- Table 36: United States Polyaspartic Coatings Market Volume (liter ) Forecast, by Application 2020 & 2033
- Table 37: Canada Polyaspartic Coatings Market Revenue (Million) Forecast, by Application 2020 & 2033
- Table 38: Canada Polyaspartic Coatings Market Volume (liter ) Forecast, by Application 2020 & 2033
- Table 39: Mexico Polyaspartic Coatings Market Revenue (Million) Forecast, by Application 2020 & 2033
- Table 40: Mexico Polyaspartic Coatings Market Volume (liter ) Forecast, by Application 2020 & 2033
- Table 41: Global Polyaspartic Coatings Market Revenue Million Forecast, by Technology 2020 & 2033
- Table 42: Global Polyaspartic Coatings Market Volume liter Forecast, by Technology 2020 & 2033
- Table 43: Global Polyaspartic Coatings Market Revenue Million Forecast, by Type 2020 & 2033
- Table 44: Global Polyaspartic Coatings Market Volume liter Forecast, by Type 2020 & 2033
- Table 45: Global Polyaspartic Coatings Market Revenue Million Forecast, by End-user Industry 2020 & 2033
- Table 46: Global Polyaspartic Coatings Market Volume liter Forecast, by End-user Industry 2020 & 2033
- Table 47: Global Polyaspartic Coatings Market Revenue Million Forecast, by Country 2020 & 2033
- Table 48: Global Polyaspartic Coatings Market Volume liter Forecast, by Country 2020 & 2033
- Table 49: Germany Polyaspartic Coatings Market Revenue (Million) Forecast, by Application 2020 & 2033
- Table 50: Germany Polyaspartic Coatings Market Volume (liter ) Forecast, by Application 2020 & 2033
- Table 51: United Kingdom Polyaspartic Coatings Market Revenue (Million) Forecast, by Application 2020 & 2033
- Table 52: United Kingdom Polyaspartic Coatings Market Volume (liter ) Forecast, by Application 2020 & 2033
- Table 53: Italy Polyaspartic Coatings Market Revenue (Million) Forecast, by Application 2020 & 2033
- Table 54: Italy Polyaspartic Coatings Market Volume (liter ) Forecast, by Application 2020 & 2033
- Table 55: France Polyaspartic Coatings Market Revenue (Million) Forecast, by Application 2020 & 2033
- Table 56: France Polyaspartic Coatings Market Volume (liter ) Forecast, by Application 2020 & 2033
- Table 57: Rest of Europe Polyaspartic Coatings Market Revenue (Million) Forecast, by Application 2020 & 2033
- Table 58: Rest of Europe Polyaspartic Coatings Market Volume (liter ) Forecast, by Application 2020 & 2033
- Table 59: Global Polyaspartic Coatings Market Revenue Million Forecast, by Technology 2020 & 2033
- Table 60: Global Polyaspartic Coatings Market Volume liter Forecast, by Technology 2020 & 2033
- Table 61: Global Polyaspartic Coatings Market Revenue Million Forecast, by Type 2020 & 2033
- Table 62: Global Polyaspartic Coatings Market Volume liter Forecast, by Type 2020 & 2033
- Table 63: Global Polyaspartic Coatings Market Revenue Million Forecast, by End-user Industry 2020 & 2033
- Table 64: Global Polyaspartic Coatings Market Volume liter Forecast, by End-user Industry 2020 & 2033
- Table 65: Global Polyaspartic Coatings Market Revenue Million Forecast, by Country 2020 & 2033
- Table 66: Global Polyaspartic Coatings Market Volume liter Forecast, by Country 2020 & 2033
- Table 67: Brazil Polyaspartic Coatings Market Revenue (Million) Forecast, by Application 2020 & 2033
- Table 68: Brazil Polyaspartic Coatings Market Volume (liter ) Forecast, by Application 2020 & 2033
- Table 69: Argentina Polyaspartic Coatings Market Revenue (Million) Forecast, by Application 2020 & 2033
- Table 70: Argentina Polyaspartic Coatings Market Volume (liter ) Forecast, by Application 2020 & 2033
- Table 71: Rest of South America Polyaspartic Coatings Market Revenue (Million) Forecast, by Application 2020 & 2033
- Table 72: Rest of South America Polyaspartic Coatings Market Volume (liter ) Forecast, by Application 2020 & 2033
- Table 73: Global Polyaspartic Coatings Market Revenue Million Forecast, by Technology 2020 & 2033
- Table 74: Global Polyaspartic Coatings Market Volume liter Forecast, by Technology 2020 & 2033
- Table 75: Global Polyaspartic Coatings Market Revenue Million Forecast, by Type 2020 & 2033
- Table 76: Global Polyaspartic Coatings Market Volume liter Forecast, by Type 2020 & 2033
- Table 77: Global Polyaspartic Coatings Market Revenue Million Forecast, by End-user Industry 2020 & 2033
- Table 78: Global Polyaspartic Coatings Market Volume liter Forecast, by End-user Industry 2020 & 2033
- Table 79: Global Polyaspartic Coatings Market Revenue Million Forecast, by Country 2020 & 2033
- Table 80: Global Polyaspartic Coatings Market Volume liter Forecast, by Country 2020 & 2033
- Table 81: Global Polyaspartic Coatings Market Revenue Million Forecast, by Technology 2020 & 2033
- Table 82: Global Polyaspartic Coatings Market Volume liter Forecast, by Technology 2020 & 2033
- Table 83: Global Polyaspartic Coatings Market Revenue Million Forecast, by Type 2020 & 2033
- Table 84: Global Polyaspartic Coatings Market Volume liter Forecast, by Type 2020 & 2033
- Table 85: Global Polyaspartic Coatings Market Revenue Million Forecast, by End-user Industry 2020 & 2033
- Table 86: Global Polyaspartic Coatings Market Volume liter Forecast, by End-user Industry 2020 & 2033
- Table 87: Global Polyaspartic Coatings Market Revenue Million Forecast, by Country 2020 & 2033
- Table 88: Global Polyaspartic Coatings Market Volume liter Forecast, by Country 2020 & 2033
- Table 89: South Africa Polyaspartic Coatings Market Revenue (Million) Forecast, by Application 2020 & 2033
- Table 90: South Africa Polyaspartic Coatings Market Volume (liter ) Forecast, by Application 2020 & 2033
- Table 91: Rest of Middle East Polyaspartic Coatings Market Revenue (Million) Forecast, by Application 2020 & 2033
- Table 92: Rest of Middle East Polyaspartic Coatings Market Volume (liter ) Forecast, by Application 2020 & 2033
Frequently Asked Questions
1. What is the projected Compound Annual Growth Rate (CAGR) of the Polyaspartic Coatings Market?
The projected CAGR is approximately > 7.50%.
2. Which companies are prominent players in the Polyaspartic Coatings Market?
Key companies in the market include Chromaflo Technologies, The Sherwin-Williams Company*List Not Exhaustive, LATICRETE International Inc, Akzo Nobel NV, PPG Industries Inc, Enviro Epoxy Products Inc, BASF SE, Iron Man Coatings, Carboline Inc, Polyval Coatings Inc, Flexmar Polyaspartics, NEOGARD, Sika AG, Covestro AG, Duraamen Engineered Products Inc, RPM International, Florock.
3. What are the main segments of the Polyaspartic Coatings Market?
The market segments include Technology, Type, End-user Industry.
4. Can you provide details about the market size?
The market size is estimated to be USD 10400 Million as of 2022.
5. What are some drivers contributing to market growth?
; Rapidly Increasing Demand from the Building and Construction Industry; Other Drivers.
6. What are the notable trends driving market growth?
Marine Segment to Dominate the Market.
7. Are there any restraints impacting market growth?
; Stringent Environmental Regulations Regarding VOC Emissions.
8. Can you provide examples of recent developments in the market?
N/A
9. What pricing options are available for accessing the report?
Pricing options include single-user, multi-user, and enterprise licenses priced at USD 4750, USD 5250, and USD 8750 respectively.
10. Is the market size provided in terms of value or volume?
The market size is provided in terms of value, measured in Million and volume, measured in liter .
11. Are there any specific market keywords associated with the report?
Yes, the market keyword associated with the report is "Polyaspartic Coatings Market," which aids in identifying and referencing the specific market segment covered.
12. How do I determine which pricing option suits my needs best?
The pricing options vary based on user requirements and access needs. Individual users may opt for single-user licenses, while businesses requiring broader access may choose multi-user or enterprise licenses for cost-effective access to the report.
13. Are there any additional resources or data provided in the Polyaspartic Coatings Market report?
While the report offers comprehensive insights, it's advisable to review the specific contents or supplementary materials provided to ascertain if additional resources or data are available.
14. How can I stay updated on further developments or reports in the Polyaspartic Coatings Market?
To stay informed about further developments, trends, and reports in the Polyaspartic Coatings Market, consider subscribing to industry newsletters, following relevant companies and organizations, or regularly checking reputable industry news sources and publications.
Methodology
Step 1 - Identification of Relevant Samples Size from Population Database


Step 2 - Approaches for Defining Global Market Size (Value, Volume* & Price*)

Note*: In applicable scenarios
Step 3 - Data Sources
Primary Research
- Web Analytics
- Survey Reports
- Research Institute
- Latest Research Reports
- Opinion Leaders
Secondary Research
- Annual Reports
- White Paper
- Latest Press Release
- Industry Association
- Paid Database
- Investor Presentations

Step 4 - Data Triangulation
Involves using different sources of information in order to increase the validity of a study
These sources are likely to be stakeholders in a program - participants, other researchers, program staff, other community members, and so on.
Then we put all data in single framework & apply various statistical tools to find out the dynamic on the market.
During the analysis stage, feedback from the stakeholder groups would be compared to determine areas of agreement as well as areas of divergence