

Key Insights
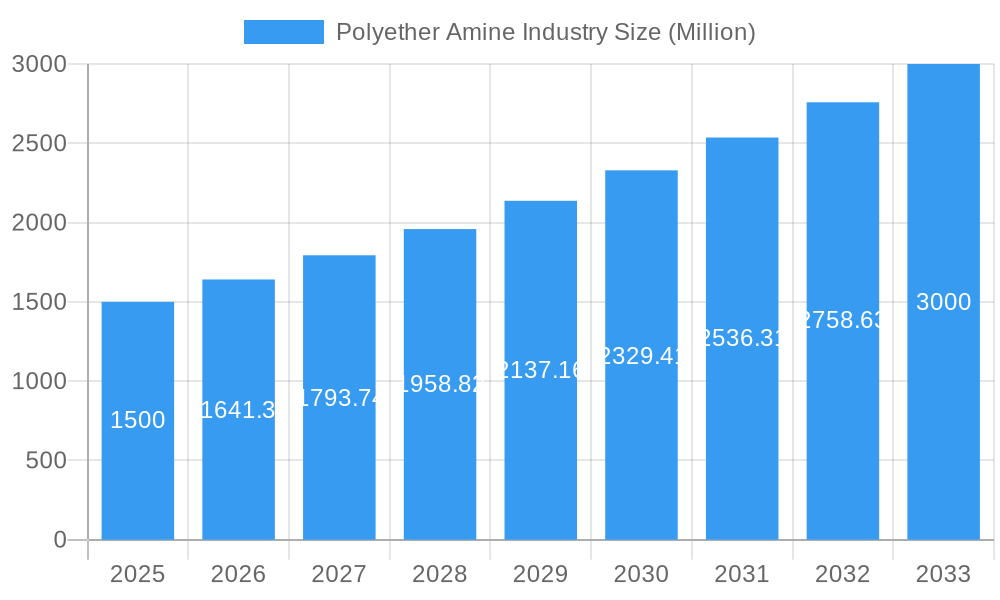
The global polyether amine market, valued at $9.05 billion in the base year 2025, is projected for substantial growth, with an anticipated compound annual growth rate (CAGR) of 13.56% from 2025 to 2033. This significant market expansion is primarily driven by escalating demand for high-performance coatings across key industries such as automotive, construction, and aerospace. The increasing adoption of advanced polyurea coatings, recognized for their exceptional durability and rapid curing capabilities, is a major contributor to this growth trajectory. Additionally, the expanding utilization of polyether amines as fuel additives to optimize combustion efficiency and reduce emissions directly supports global environmental regulations and sustainability objectives. The burgeoning composites industry, which leverages the superior bonding characteristics of polyether amines, further accelerates market development. While raw material price volatility presents a challenge, ongoing technological innovations in synthesis efficiency and product formulation are effectively mitigating these constraints. The market is segmented by type (monoamine, diamine, triamine) and application (polyurea, fuel additives, composites, epoxy coatings, adhesives and sealants, and other applications). Polyurea and fuel additives currently represent the dominant market segments. Geographic expansion, particularly within rapidly industrializing economies in the Asia Pacific region, including China and India, is also a significant driver of overall market growth.
Polyether Amine Industry Market Size (In Billion)
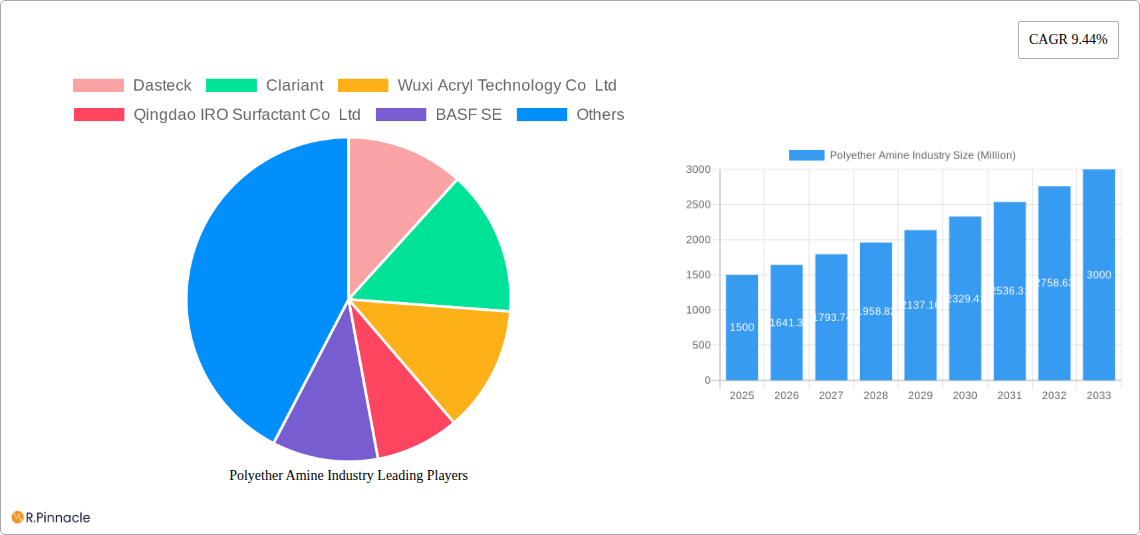
The competitive arena features prominent multinational chemical corporations, including BASF SE and Huntsman International LLC, alongside specialized regional manufacturers like Dasteck and Qingdao IRO Surfactant Co Ltd. These entities are actively investing in research and development, prioritizing innovative product advancements and strategic collaborations to solidify their market positions. The market's future outlook indicates a sustained upward trend, fueled by continuous technological progress, increasing demand from critical application sectors, and strategic expansion into emerging global markets. The chemical industry's growing emphasis on sustainable and environmentally conscious solutions is also positively impacting the market's prospects. Market participants are increasingly directing investments towards greener manufacturing processes and the development of bio-based polyether amine alternatives, aligning with worldwide sustainability imperatives and enhancing the market's future potential.
Polyether Amine Industry Company Market Share
Polyether Amine Industry Market Report: 2019-2033
This comprehensive report provides an in-depth analysis of the global polyether amine industry, covering market size, segmentation, growth drivers, challenges, and future outlook. The study period spans from 2019 to 2033, with 2025 as the base and estimated year. This report is crucial for industry professionals, investors, and strategists seeking actionable insights into this dynamic market.
Polyether Amine Industry Market Structure & Innovation Trends
The global polyether amine market exhibits a moderately concentrated structure, characterized by the significant influence of key industry leaders such as BASF SE, Huntsman International LLC, and Clariant, who collectively held an estimated xx% of the market share in 2025. Innovation within this sector is primarily propelled by the escalating demand for materials with superior performance characteristics across a wide spectrum of applications. Notable advancements are evident in the formulation of next-generation polyurea coatings and highly effective fuel additives. In parallel, increasingly stringent environmental regulations are acting as a catalyst for product development, fostering the creation of more sustainable and eco-friendly polyether amine solutions. Competitive pressures stem from the availability of product substitutes, including alternative amine chemistries and various crosslinking agents. The end-user landscape is notably diverse, with substantial demand originating from the automotive, construction, and energy sectors. The past five years have witnessed a moderate level of M&A activity, with aggregate deal values estimated at approximately xx Million. While specific details of individual acquisitions are still under detailed investigation, the trend indicates strategic consolidation and investment within the industry.
- Market Concentration: Moderately concentrated, with top-tier players collectively dominating an estimated xx% market share in 2025.
- Key Innovation Drivers: The relentless pursuit of high-performance materials, coupled with the imperative to comply with evolving environmental regulations.
- Regulatory Landscape: A dynamic and increasingly rigorous regulatory framework is significantly influencing both product development strategies and manufacturing processes.
- Competitive Substitutes: The market faces competition from a range of alternative crosslinking agents and other amine types.
- Diverse End-User Base: Key sectors include automotive, construction, energy, and a broad array of other industrial applications.
- Mergers & Acquisitions (M&A): Moderate M&A activity over the last five years, with an estimated total transaction value of xx Million. Further research is ongoing to detail specific notable acquisitions.
Polyether Amine Industry Market Dynamics & Trends
The global polyether amine market is currently experiencing a phase of robust and sustained growth. This expansion is underpinned by the consistently rising demand from a multitude of end-use industries. Projections indicate a Compound Annual Growth Rate (CAGR) of approximately xx% during the forecast period of 2025-2033. Several pivotal factors are contributing to this upward trajectory. The global surge in construction activity, a growing requirement for advanced, high-performance coatings across various industrial verticals, and the increasing adoption of durable and versatile polyurea-based coatings are significant drivers. Technological advancements, particularly the development of more efficient synthesis methodologies and the introduction of novel, specialized polyether amine formulations, are further accelerating market expansion. Furthermore, shifting consumer preferences towards products that offer enhanced durability and a strong emphasis on sustainability are also positively influencing the demand for polyether amines. The competitive landscape is characterized by intense rivalry among well-established global players, alongside the emergence of agile new entrants making their mark in specific regional markets. The market penetration of polyether amines into niche applications, such as high-value fuel additives, is anticipated to witness substantial growth throughout the forecast period.
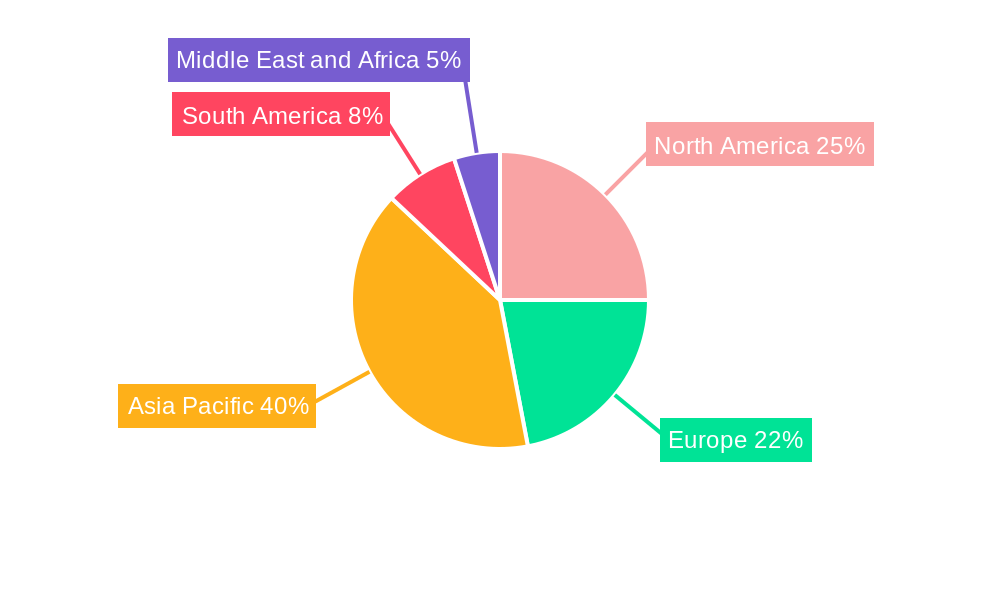
Dominant Regions & Segments in Polyether Amine Industry
North America is currently the leading region for polyether amine consumption, driven by robust demand from the automotive and construction sectors, strong infrastructure development, and favorable economic policies. However, Asia-Pacific is projected to witness the fastest growth during the forecast period due to rapid industrialization and rising infrastructure investments.
- Leading Region: North America (2025)
- Fastest-Growing Region: Asia-Pacific (2025-2033)
Key Drivers:
- North America: Robust automotive and construction sectors, favorable economic policies.
- Asia-Pacific: Rapid industrialization, infrastructure development, and increasing demand from various end-use sectors.
Segment Dominance:
- Type: Diamine currently holds the largest market share due to its versatile applications. However, Triamine is projected to experience significant growth due to its superior performance characteristics in specific applications.
- Application: Polyurea coatings dominate the application segment, followed by epoxy coatings and adhesives & sealants. Fuel additives are a growing niche market.
Polyether Amine Industry Product Innovations
Recent and ongoing innovations in the polyether amine industry are largely centered on the development of advanced, high-performance polyether amines. These new formulations boast significantly improved properties, including enhanced reactivity for faster curing, superior thermal stability for demanding environments, and increased UV resistance for extended product lifespan. Key innovation areas include the creation of specialized formulations precisely tailored to meet the unique requirements of specific applications. Examples include the development of water-borne polyether amines designed for the formulation of environmentally friendly coatings, and modified polyether amines engineered to deliver improved adhesion in advanced composite materials. These innovations are critical in enhancing the market fit of polyether amines by directly addressing evolving customer demands for superior performance and a stronger commitment to sustainability.
Report Scope & Segmentation Analysis
This comprehensive report segments the polyether amine market based on crucial parameters: product type (monoamine, diamine, and triamine) and key application areas (polyurea, fuel additives, composites, epoxy coatings, adhesives and sealants, and other specialized applications). For each identified segment, the report provides detailed analysis of its projected growth trajectory, estimated market size in Million USD, and a thorough examination of its specific competitive dynamics. As an illustration, the diamine segment is projected to exhibit steady and consistent growth owing to its broad spectrum of applications. Conversely, the polyurea application segment is anticipated to demonstrate the highest growth rate, primarily driven by the escalating global demand for high-performance coatings. The full report offers an in-depth and granular analysis of each market segment.
Key Drivers of Polyether Amine Industry Growth
The growth of the polyether amine industry is primarily driven by the expanding construction sector, automotive industry, and the growing demand for high-performance coatings. Technological advancements, such as the development of more efficient synthesis methods and the introduction of novel polyether amine formulations, are also contributing to market growth. Favorable government regulations promoting sustainable materials further support market expansion.
Challenges in the Polyether Amine Industry Sector
The polyether amine industry faces challenges such as fluctuating raw material prices, stringent environmental regulations, and intense competition. Supply chain disruptions can also impact production and delivery timelines. These factors can significantly affect profitability and overall market growth, although the exact quantifiable impact requires further data analysis.
Emerging Opportunities in Polyether Amine Industry
The polyether amine industry is poised to capitalize on several promising emerging opportunities. A significant area of growth lies in the development and commercialization of bio-based polyether amines, directly addressing the escalating global demand for sustainable and renewable materials. Furthermore, significant potential exists in expanding the application of polyether amines into novel sectors, including but not limited to, renewable energy technologies and the development of advanced materials. Strategic expansion into new geographical markets, with a particular focus on rapidly developing economies characterized by burgeoning infrastructure development, presents substantial and lucrative growth prospects for industry players.
Leading Players in the Polyether Amine Industry Market
- Dasteck
- Clariant
- Wuxi Acryl Technology Co Ltd
- Qingdao IRO Surfactant Co Ltd
- BASF SE
- Huntsman International LLC
- Shanghai Chenhua International Trade Co Ltd
- Chia Tai New Materials (Zibo Zhengda Polyurethane Co Ltd )
Key Developments in Polyether Amine Industry Industry
- June 2022: BASF announced the expansion of its polyetheramine production capacity at the Geismar site in North America, aiming to be on-stream by mid-2023. This expansion will focus on key specialty amines and increase the production of Baxxodur-branded polyetheramines. This signifies a commitment to meeting growing market demand.
- March 2022: Brenntag partnered with BASF SE to become the exclusive distributor for BASF's Polyetheramines and Baxxodur portfolio in the United States and Canada. This strategic alliance expands BASF's market reach and distribution capabilities.
Future Outlook for Polyether Amine Industry Market
The future outlook for the polyether amine market is positive, driven by consistent growth across various sectors. Continued innovations in product development and expanding applications into new markets will fuel substantial growth. Strategic partnerships and investments in advanced manufacturing capabilities will further strengthen the industry's position and contribute to its long-term success. The market is poised for significant expansion during the forecast period.
Polyether Amine Industry Segmentation
-
1. Type
- 1.1. Monoamine
- 1.2. Diamine
- 1.3. Triamine
-
2. Application
- 2.1. Polyurea
- 2.2. Fuel Additives
- 2.3. Composites
- 2.4. Epoxy Coatings
- 2.5. Adhesives and Sealants
- 2.6. Other Applications
Polyether Amine Industry Segmentation By Geography
-
1. Asia Pacific
- 1.1. China
- 1.2. India
- 1.3. Japan
- 1.4. South Korea
- 1.5. Rest of Asia Pacific
-
2. North America
- 2.1. United States
- 2.2. Canada
- 2.3. Mexico
-
3. Europe
- 3.1. Germany
- 3.2. United Kingdom
- 3.3. Italy
- 3.4. France
- 3.5. Rest of Europe
-
4. South America
- 4.1. Brazil
- 4.2. Argentina
- 4.3. Rest of South America
-
5. Middle East and Africa
- 5.1. Saudi Arabia
- 5.2. South Africa
- 5.3. Rest of Middle East and Africa
Polyether Amine Industry Regional Market Share
Geographic Coverage of Polyether Amine Industry
Polyether Amine Industry REPORT HIGHLIGHTS
| Aspects | Details |
|---|---|
| Study Period | 2020-2034 |
| Base Year | 2025 |
| Estimated Year | 2026 |
| Forecast Period | 2026-2034 |
| Historical Period | 2020-2025 |
| Growth Rate | CAGR of 13.56% from 2020-2034 |
| Segmentation |
|
Table of Contents
- 1. Introduction
- 1.1. Research Scope
- 1.2. Market Segmentation
- 1.3. Research Objective
- 1.4. Definitions and Assumptions
- 2. Executive Summary
- 2.1. Market Snapshot
- 3. Market Dynamics
- 3.1. Market Drivers
- 3.2. Market Restrains
- 3.3. Market Trends
- 3.4. Market Opportunities
- 4. Market Factor Analysis
- 4.1. Porters Five Forces
- 4.1.1. Bargaining Power of Suppliers
- 4.1.2. Bargaining Power of Buyers
- 4.1.3. Threat of New Entrants
- 4.1.4. Threat of Substitutes
- 4.1.5. Competitive Rivalry
- 4.2. PESTEL analysis
- 4.3. BCG Analysis
- 4.3.1. Stars (High Growth, High Market Share)
- 4.3.2. Cash Cows (Low Growth, High Market Share)
- 4.3.3. Question Mark (High Growth, Low Market Share)
- 4.3.4. Dogs (Low Growth, Low Market Share)
- 4.4. Ansoff Matrix Analysis
- 4.5. Supply Chain Analysis
- 4.6. Regulatory Landscape
- 4.7. Current Market Potential and Opportunity Assessment (TAM–SAM–SOM Framework)
- 4.8. PRI Analyst Note
- 4.1. Porters Five Forces
- 5. Market Analysis, Insights and Forecast 2021-2033
- 5.1. Market Analysis, Insights and Forecast - by Type
- 5.1.1. Monoamine
- 5.1.2. Diamine
- 5.1.3. Triamine
- 5.2. Market Analysis, Insights and Forecast - by Application
- 5.2.1. Polyurea
- 5.2.2. Fuel Additives
- 5.2.3. Composites
- 5.2.4. Epoxy Coatings
- 5.2.5. Adhesives and Sealants
- 5.2.6. Other Applications
- 5.3. Market Analysis, Insights and Forecast - by Region
- 5.3.1. Asia Pacific
- 5.3.2. North America
- 5.3.3. Europe
- 5.3.4. South America
- 5.3.5. Middle East and Africa
- 5.1. Market Analysis, Insights and Forecast - by Type
- 6. Global Polyether Amine Industry Analysis, Insights and Forecast, 2021-2033
- 6.1. Market Analysis, Insights and Forecast - by Type
- 6.1.1. Monoamine
- 6.1.2. Diamine
- 6.1.3. Triamine
- 6.2. Market Analysis, Insights and Forecast - by Application
- 6.2.1. Polyurea
- 6.2.2. Fuel Additives
- 6.2.3. Composites
- 6.2.4. Epoxy Coatings
- 6.2.5. Adhesives and Sealants
- 6.2.6. Other Applications
- 6.1. Market Analysis, Insights and Forecast - by Type
- 7. Asia Pacific Polyether Amine Industry Analysis, Insights and Forecast, 2020-2032
- 7.1. Market Analysis, Insights and Forecast - by Type
- 7.1.1. Monoamine
- 7.1.2. Diamine
- 7.1.3. Triamine
- 7.2. Market Analysis, Insights and Forecast - by Application
- 7.2.1. Polyurea
- 7.2.2. Fuel Additives
- 7.2.3. Composites
- 7.2.4. Epoxy Coatings
- 7.2.5. Adhesives and Sealants
- 7.2.6. Other Applications
- 7.1. Market Analysis, Insights and Forecast - by Type
- 8. North America Polyether Amine Industry Analysis, Insights and Forecast, 2020-2032
- 8.1. Market Analysis, Insights and Forecast - by Type
- 8.1.1. Monoamine
- 8.1.2. Diamine
- 8.1.3. Triamine
- 8.2. Market Analysis, Insights and Forecast - by Application
- 8.2.1. Polyurea
- 8.2.2. Fuel Additives
- 8.2.3. Composites
- 8.2.4. Epoxy Coatings
- 8.2.5. Adhesives and Sealants
- 8.2.6. Other Applications
- 8.1. Market Analysis, Insights and Forecast - by Type
- 9. Europe Polyether Amine Industry Analysis, Insights and Forecast, 2020-2032
- 9.1. Market Analysis, Insights and Forecast - by Type
- 9.1.1. Monoamine
- 9.1.2. Diamine
- 9.1.3. Triamine
- 9.2. Market Analysis, Insights and Forecast - by Application
- 9.2.1. Polyurea
- 9.2.2. Fuel Additives
- 9.2.3. Composites
- 9.2.4. Epoxy Coatings
- 9.2.5. Adhesives and Sealants
- 9.2.6. Other Applications
- 9.1. Market Analysis, Insights and Forecast - by Type
- 10. South America Polyether Amine Industry Analysis, Insights and Forecast, 2020-2032
- 10.1. Market Analysis, Insights and Forecast - by Type
- 10.1.1. Monoamine
- 10.1.2. Diamine
- 10.1.3. Triamine
- 10.2. Market Analysis, Insights and Forecast - by Application
- 10.2.1. Polyurea
- 10.2.2. Fuel Additives
- 10.2.3. Composites
- 10.2.4. Epoxy Coatings
- 10.2.5. Adhesives and Sealants
- 10.2.6. Other Applications
- 10.1. Market Analysis, Insights and Forecast - by Type
- 11. Middle East and Africa Polyether Amine Industry Analysis, Insights and Forecast, 2020-2032
- 11.1. Market Analysis, Insights and Forecast - by Type
- 11.1.1. Monoamine
- 11.1.2. Diamine
- 11.1.3. Triamine
- 11.2. Market Analysis, Insights and Forecast - by Application
- 11.2.1. Polyurea
- 11.2.2. Fuel Additives
- 11.2.3. Composites
- 11.2.4. Epoxy Coatings
- 11.2.5. Adhesives and Sealants
- 11.2.6. Other Applications
- 11.1. Market Analysis, Insights and Forecast - by Type
- 12. Competitive Analysis
- 12.1. Company Profiles
- 12.1.1 Dasteck
- 12.1.1.1. Company Overview
- 12.1.1.2. Products
- 12.1.1.3. Company Financials
- 12.1.1.4. SWOT Analysis
- 12.1.2 Clariant
- 12.1.2.1. Company Overview
- 12.1.2.2. Products
- 12.1.2.3. Company Financials
- 12.1.2.4. SWOT Analysis
- 12.1.3 Wuxi Acryl Technology Co Ltd
- 12.1.3.1. Company Overview
- 12.1.3.2. Products
- 12.1.3.3. Company Financials
- 12.1.3.4. SWOT Analysis
- 12.1.4 Qingdao IRO Surfactant Co Ltd
- 12.1.4.1. Company Overview
- 12.1.4.2. Products
- 12.1.4.3. Company Financials
- 12.1.4.4. SWOT Analysis
- 12.1.5 BASF SE
- 12.1.5.1. Company Overview
- 12.1.5.2. Products
- 12.1.5.3. Company Financials
- 12.1.5.4. SWOT Analysis
- 12.1.6 Huntsman International LLC
- 12.1.6.1. Company Overview
- 12.1.6.2. Products
- 12.1.6.3. Company Financials
- 12.1.6.4. SWOT Analysis
- 12.1.7 Shanghai Chenhua International Trade Co Ltd
- 12.1.7.1. Company Overview
- 12.1.7.2. Products
- 12.1.7.3. Company Financials
- 12.1.7.4. SWOT Analysis
- 12.1.8 Chia Tai New Materials (Zibo Zhengda Polyurethane Co Ltd )
- 12.1.8.1. Company Overview
- 12.1.8.2. Products
- 12.1.8.3. Company Financials
- 12.1.8.4. SWOT Analysis
- 12.1.1 Dasteck
- 12.2. Market Entropy
- 12.2.1 Company's Key Areas Served
- 12.2.2 Recent Developments
- 12.3. Company Market Share Analysis 2025
- 12.3.1 Top 5 Companies Market Share Analysis
- 12.3.2 Top 3 Companies Market Share Analysis
- 12.4. List of Potential Customers
- 13. Research Methodology
List of Figures
- Figure 1: Global Polyether Amine Industry Revenue Breakdown (billion, %) by Region 2025 & 2033
- Figure 2: Global Polyether Amine Industry Volume Breakdown (kilotons, %) by Region 2025 & 2033
- Figure 3: Asia Pacific Polyether Amine Industry Revenue (billion), by Type 2025 & 2033
- Figure 4: Asia Pacific Polyether Amine Industry Volume (kilotons), by Type 2025 & 2033
- Figure 5: Asia Pacific Polyether Amine Industry Revenue Share (%), by Type 2025 & 2033
- Figure 6: Asia Pacific Polyether Amine Industry Volume Share (%), by Type 2025 & 2033
- Figure 7: Asia Pacific Polyether Amine Industry Revenue (billion), by Application 2025 & 2033
- Figure 8: Asia Pacific Polyether Amine Industry Volume (kilotons), by Application 2025 & 2033
- Figure 9: Asia Pacific Polyether Amine Industry Revenue Share (%), by Application 2025 & 2033
- Figure 10: Asia Pacific Polyether Amine Industry Volume Share (%), by Application 2025 & 2033
- Figure 11: Asia Pacific Polyether Amine Industry Revenue (billion), by Country 2025 & 2033
- Figure 12: Asia Pacific Polyether Amine Industry Volume (kilotons), by Country 2025 & 2033
- Figure 13: Asia Pacific Polyether Amine Industry Revenue Share (%), by Country 2025 & 2033
- Figure 14: Asia Pacific Polyether Amine Industry Volume Share (%), by Country 2025 & 2033
- Figure 15: North America Polyether Amine Industry Revenue (billion), by Type 2025 & 2033
- Figure 16: North America Polyether Amine Industry Volume (kilotons), by Type 2025 & 2033
- Figure 17: North America Polyether Amine Industry Revenue Share (%), by Type 2025 & 2033
- Figure 18: North America Polyether Amine Industry Volume Share (%), by Type 2025 & 2033
- Figure 19: North America Polyether Amine Industry Revenue (billion), by Application 2025 & 2033
- Figure 20: North America Polyether Amine Industry Volume (kilotons), by Application 2025 & 2033
- Figure 21: North America Polyether Amine Industry Revenue Share (%), by Application 2025 & 2033
- Figure 22: North America Polyether Amine Industry Volume Share (%), by Application 2025 & 2033
- Figure 23: North America Polyether Amine Industry Revenue (billion), by Country 2025 & 2033
- Figure 24: North America Polyether Amine Industry Volume (kilotons), by Country 2025 & 2033
- Figure 25: North America Polyether Amine Industry Revenue Share (%), by Country 2025 & 2033
- Figure 26: North America Polyether Amine Industry Volume Share (%), by Country 2025 & 2033
- Figure 27: Europe Polyether Amine Industry Revenue (billion), by Type 2025 & 2033
- Figure 28: Europe Polyether Amine Industry Volume (kilotons), by Type 2025 & 2033
- Figure 29: Europe Polyether Amine Industry Revenue Share (%), by Type 2025 & 2033
- Figure 30: Europe Polyether Amine Industry Volume Share (%), by Type 2025 & 2033
- Figure 31: Europe Polyether Amine Industry Revenue (billion), by Application 2025 & 2033
- Figure 32: Europe Polyether Amine Industry Volume (kilotons), by Application 2025 & 2033
- Figure 33: Europe Polyether Amine Industry Revenue Share (%), by Application 2025 & 2033
- Figure 34: Europe Polyether Amine Industry Volume Share (%), by Application 2025 & 2033
- Figure 35: Europe Polyether Amine Industry Revenue (billion), by Country 2025 & 2033
- Figure 36: Europe Polyether Amine Industry Volume (kilotons), by Country 2025 & 2033
- Figure 37: Europe Polyether Amine Industry Revenue Share (%), by Country 2025 & 2033
- Figure 38: Europe Polyether Amine Industry Volume Share (%), by Country 2025 & 2033
- Figure 39: South America Polyether Amine Industry Revenue (billion), by Type 2025 & 2033
- Figure 40: South America Polyether Amine Industry Volume (kilotons), by Type 2025 & 2033
- Figure 41: South America Polyether Amine Industry Revenue Share (%), by Type 2025 & 2033
- Figure 42: South America Polyether Amine Industry Volume Share (%), by Type 2025 & 2033
- Figure 43: South America Polyether Amine Industry Revenue (billion), by Application 2025 & 2033
- Figure 44: South America Polyether Amine Industry Volume (kilotons), by Application 2025 & 2033
- Figure 45: South America Polyether Amine Industry Revenue Share (%), by Application 2025 & 2033
- Figure 46: South America Polyether Amine Industry Volume Share (%), by Application 2025 & 2033
- Figure 47: South America Polyether Amine Industry Revenue (billion), by Country 2025 & 2033
- Figure 48: South America Polyether Amine Industry Volume (kilotons), by Country 2025 & 2033
- Figure 49: South America Polyether Amine Industry Revenue Share (%), by Country 2025 & 2033
- Figure 50: South America Polyether Amine Industry Volume Share (%), by Country 2025 & 2033
- Figure 51: Middle East and Africa Polyether Amine Industry Revenue (billion), by Type 2025 & 2033
- Figure 52: Middle East and Africa Polyether Amine Industry Volume (kilotons), by Type 2025 & 2033
- Figure 53: Middle East and Africa Polyether Amine Industry Revenue Share (%), by Type 2025 & 2033
- Figure 54: Middle East and Africa Polyether Amine Industry Volume Share (%), by Type 2025 & 2033
- Figure 55: Middle East and Africa Polyether Amine Industry Revenue (billion), by Application 2025 & 2033
- Figure 56: Middle East and Africa Polyether Amine Industry Volume (kilotons), by Application 2025 & 2033
- Figure 57: Middle East and Africa Polyether Amine Industry Revenue Share (%), by Application 2025 & 2033
- Figure 58: Middle East and Africa Polyether Amine Industry Volume Share (%), by Application 2025 & 2033
- Figure 59: Middle East and Africa Polyether Amine Industry Revenue (billion), by Country 2025 & 2033
- Figure 60: Middle East and Africa Polyether Amine Industry Volume (kilotons), by Country 2025 & 2033
- Figure 61: Middle East and Africa Polyether Amine Industry Revenue Share (%), by Country 2025 & 2033
- Figure 62: Middle East and Africa Polyether Amine Industry Volume Share (%), by Country 2025 & 2033
List of Tables
- Table 1: Global Polyether Amine Industry Revenue billion Forecast, by Type 2020 & 2033
- Table 2: Global Polyether Amine Industry Volume kilotons Forecast, by Type 2020 & 2033
- Table 3: Global Polyether Amine Industry Revenue billion Forecast, by Application 2020 & 2033
- Table 4: Global Polyether Amine Industry Volume kilotons Forecast, by Application 2020 & 2033
- Table 5: Global Polyether Amine Industry Revenue billion Forecast, by Region 2020 & 2033
- Table 6: Global Polyether Amine Industry Volume kilotons Forecast, by Region 2020 & 2033
- Table 7: Global Polyether Amine Industry Revenue billion Forecast, by Type 2020 & 2033
- Table 8: Global Polyether Amine Industry Volume kilotons Forecast, by Type 2020 & 2033
- Table 9: Global Polyether Amine Industry Revenue billion Forecast, by Application 2020 & 2033
- Table 10: Global Polyether Amine Industry Volume kilotons Forecast, by Application 2020 & 2033
- Table 11: Global Polyether Amine Industry Revenue billion Forecast, by Country 2020 & 2033
- Table 12: Global Polyether Amine Industry Volume kilotons Forecast, by Country 2020 & 2033
- Table 13: China Polyether Amine Industry Revenue (billion) Forecast, by Application 2020 & 2033
- Table 14: China Polyether Amine Industry Volume (kilotons) Forecast, by Application 2020 & 2033
- Table 15: India Polyether Amine Industry Revenue (billion) Forecast, by Application 2020 & 2033
- Table 16: India Polyether Amine Industry Volume (kilotons) Forecast, by Application 2020 & 2033
- Table 17: Japan Polyether Amine Industry Revenue (billion) Forecast, by Application 2020 & 2033
- Table 18: Japan Polyether Amine Industry Volume (kilotons) Forecast, by Application 2020 & 2033
- Table 19: South Korea Polyether Amine Industry Revenue (billion) Forecast, by Application 2020 & 2033
- Table 20: South Korea Polyether Amine Industry Volume (kilotons) Forecast, by Application 2020 & 2033
- Table 21: Rest of Asia Pacific Polyether Amine Industry Revenue (billion) Forecast, by Application 2020 & 2033
- Table 22: Rest of Asia Pacific Polyether Amine Industry Volume (kilotons) Forecast, by Application 2020 & 2033
- Table 23: Global Polyether Amine Industry Revenue billion Forecast, by Type 2020 & 2033
- Table 24: Global Polyether Amine Industry Volume kilotons Forecast, by Type 2020 & 2033
- Table 25: Global Polyether Amine Industry Revenue billion Forecast, by Application 2020 & 2033
- Table 26: Global Polyether Amine Industry Volume kilotons Forecast, by Application 2020 & 2033
- Table 27: Global Polyether Amine Industry Revenue billion Forecast, by Country 2020 & 2033
- Table 28: Global Polyether Amine Industry Volume kilotons Forecast, by Country 2020 & 2033
- Table 29: United States Polyether Amine Industry Revenue (billion) Forecast, by Application 2020 & 2033
- Table 30: United States Polyether Amine Industry Volume (kilotons) Forecast, by Application 2020 & 2033
- Table 31: Canada Polyether Amine Industry Revenue (billion) Forecast, by Application 2020 & 2033
- Table 32: Canada Polyether Amine Industry Volume (kilotons) Forecast, by Application 2020 & 2033
- Table 33: Mexico Polyether Amine Industry Revenue (billion) Forecast, by Application 2020 & 2033
- Table 34: Mexico Polyether Amine Industry Volume (kilotons) Forecast, by Application 2020 & 2033
- Table 35: Global Polyether Amine Industry Revenue billion Forecast, by Type 2020 & 2033
- Table 36: Global Polyether Amine Industry Volume kilotons Forecast, by Type 2020 & 2033
- Table 37: Global Polyether Amine Industry Revenue billion Forecast, by Application 2020 & 2033
- Table 38: Global Polyether Amine Industry Volume kilotons Forecast, by Application 2020 & 2033
- Table 39: Global Polyether Amine Industry Revenue billion Forecast, by Country 2020 & 2033
- Table 40: Global Polyether Amine Industry Volume kilotons Forecast, by Country 2020 & 2033
- Table 41: Germany Polyether Amine Industry Revenue (billion) Forecast, by Application 2020 & 2033
- Table 42: Germany Polyether Amine Industry Volume (kilotons) Forecast, by Application 2020 & 2033
- Table 43: United Kingdom Polyether Amine Industry Revenue (billion) Forecast, by Application 2020 & 2033
- Table 44: United Kingdom Polyether Amine Industry Volume (kilotons) Forecast, by Application 2020 & 2033
- Table 45: Italy Polyether Amine Industry Revenue (billion) Forecast, by Application 2020 & 2033
- Table 46: Italy Polyether Amine Industry Volume (kilotons) Forecast, by Application 2020 & 2033
- Table 47: France Polyether Amine Industry Revenue (billion) Forecast, by Application 2020 & 2033
- Table 48: France Polyether Amine Industry Volume (kilotons) Forecast, by Application 2020 & 2033
- Table 49: Rest of Europe Polyether Amine Industry Revenue (billion) Forecast, by Application 2020 & 2033
- Table 50: Rest of Europe Polyether Amine Industry Volume (kilotons) Forecast, by Application 2020 & 2033
- Table 51: Global Polyether Amine Industry Revenue billion Forecast, by Type 2020 & 2033
- Table 52: Global Polyether Amine Industry Volume kilotons Forecast, by Type 2020 & 2033
- Table 53: Global Polyether Amine Industry Revenue billion Forecast, by Application 2020 & 2033
- Table 54: Global Polyether Amine Industry Volume kilotons Forecast, by Application 2020 & 2033
- Table 55: Global Polyether Amine Industry Revenue billion Forecast, by Country 2020 & 2033
- Table 56: Global Polyether Amine Industry Volume kilotons Forecast, by Country 2020 & 2033
- Table 57: Brazil Polyether Amine Industry Revenue (billion) Forecast, by Application 2020 & 2033
- Table 58: Brazil Polyether Amine Industry Volume (kilotons) Forecast, by Application 2020 & 2033
- Table 59: Argentina Polyether Amine Industry Revenue (billion) Forecast, by Application 2020 & 2033
- Table 60: Argentina Polyether Amine Industry Volume (kilotons) Forecast, by Application 2020 & 2033
- Table 61: Rest of South America Polyether Amine Industry Revenue (billion) Forecast, by Application 2020 & 2033
- Table 62: Rest of South America Polyether Amine Industry Volume (kilotons) Forecast, by Application 2020 & 2033
- Table 63: Global Polyether Amine Industry Revenue billion Forecast, by Type 2020 & 2033
- Table 64: Global Polyether Amine Industry Volume kilotons Forecast, by Type 2020 & 2033
- Table 65: Global Polyether Amine Industry Revenue billion Forecast, by Application 2020 & 2033
- Table 66: Global Polyether Amine Industry Volume kilotons Forecast, by Application 2020 & 2033
- Table 67: Global Polyether Amine Industry Revenue billion Forecast, by Country 2020 & 2033
- Table 68: Global Polyether Amine Industry Volume kilotons Forecast, by Country 2020 & 2033
- Table 69: Saudi Arabia Polyether Amine Industry Revenue (billion) Forecast, by Application 2020 & 2033
- Table 70: Saudi Arabia Polyether Amine Industry Volume (kilotons) Forecast, by Application 2020 & 2033
- Table 71: South Africa Polyether Amine Industry Revenue (billion) Forecast, by Application 2020 & 2033
- Table 72: South Africa Polyether Amine Industry Volume (kilotons) Forecast, by Application 2020 & 2033
- Table 73: Rest of Middle East and Africa Polyether Amine Industry Revenue (billion) Forecast, by Application 2020 & 2033
- Table 74: Rest of Middle East and Africa Polyether Amine Industry Volume (kilotons) Forecast, by Application 2020 & 2033
Frequently Asked Questions
1. What is the projected Compound Annual Growth Rate (CAGR) of the Polyether Amine Industry?
The projected CAGR is approximately 13.56%.
2. Which companies are prominent players in the Polyether Amine Industry?
Key companies in the market include Dasteck, Clariant, Wuxi Acryl Technology Co Ltd , Qingdao IRO Surfactant Co Ltd, BASF SE, Huntsman International LLC, Shanghai Chenhua International Trade Co Ltd, Chia Tai New Materials (Zibo Zhengda Polyurethane Co Ltd ).
3. What are the main segments of the Polyether Amine Industry?
The market segments include Type, Application.
4. Can you provide details about the market size?
The market size is estimated to be USD 9.05 billion as of 2022.
5. What are some drivers contributing to market growth?
Increasing Demand from Construction Industry; Growing Trend of Eco-friendly and Renewable Energy Generation; Other Drivers.
6. What are the notable trends driving market growth?
Increasing Demand from Composite Application.
7. Are there any restraints impacting market growth?
Environmental Concern Due to Excessive Use of Polyetheramines; Other Restraints.
8. Can you provide examples of recent developments in the market?
June 2022: BASF made an announcement about the ongoing expansion of production capacity at the Geismar site in North America, with the aim of being on-stream by mid-2023. This expansion will focus on key specialty amines and will enable the production of more polyetheramines marketed under the Baxxodur brand.
9. What pricing options are available for accessing the report?
Pricing options include single-user, multi-user, and enterprise licenses priced at USD 4750, USD 5250, and USD 8750 respectively.
10. Is the market size provided in terms of value or volume?
The market size is provided in terms of value, measured in billion and volume, measured in kilotons.
11. Are there any specific market keywords associated with the report?
Yes, the market keyword associated with the report is "Polyether Amine Industry," which aids in identifying and referencing the specific market segment covered.
12. How do I determine which pricing option suits my needs best?
The pricing options vary based on user requirements and access needs. Individual users may opt for single-user licenses, while businesses requiring broader access may choose multi-user or enterprise licenses for cost-effective access to the report.
13. Are there any additional resources or data provided in the Polyether Amine Industry report?
While the report offers comprehensive insights, it's advisable to review the specific contents or supplementary materials provided to ascertain if additional resources or data are available.
14. How can I stay updated on further developments or reports in the Polyether Amine Industry?
To stay informed about further developments, trends, and reports in the Polyether Amine Industry, consider subscribing to industry newsletters, following relevant companies and organizations, or regularly checking reputable industry news sources and publications.
Methodology
Step 1 - Identification of Relevant Samples Size from Population Database


Step 2 - Approaches for Defining Global Market Size (Value, Volume* & Price*)

Note*: In applicable scenarios
Step 3 - Data Sources
Primary Research
- Web Analytics
- Survey Reports
- Research Institute
- Latest Research Reports
- Opinion Leaders
Secondary Research
- Annual Reports
- White Paper
- Latest Press Release
- Industry Association
- Paid Database
- Investor Presentations

Step 4 - Data Triangulation
Involves using different sources of information in order to increase the validity of a study
These sources are likely to be stakeholders in a program - participants, other researchers, program staff, other community members, and so on.
Then we put all data in single framework & apply various statistical tools to find out the dynamic on the market.
During the analysis stage, feedback from the stakeholder groups would be compared to determine areas of agreement as well as areas of divergence