

Key Insights
The global polyether polyols market, valued at approximately $30 billion in 2025, is projected for substantial growth with a Compound Annual Growth Rate (CAGR) exceeding 5.00% from 2025 to 2033. Key growth drivers include escalating demand from the furniture and bedding sectors for flexible foams, alongside the construction industry's increasing utilization of rigid polyols for insulation and adhesives. The automotive sector's shift towards lightweight, high-performance materials also significantly contributes to market expansion. Emerging trends encompass technological advancements in sustainable and efficient polyol production and a growing need for specialized polyols in electrical and electronics applications. Conversely, raw material price volatility, particularly for petroleum-based feedstocks, and stringent environmental regulations present market restraints. The development of eco-friendly alternatives offers both challenges and opportunities. The market is segmented by type (flexible, rigid, other) and end-user industry (furniture & bedding, construction, automotive, electrical & electronics, others). Key players such as Arpadis Benelux NV, Solvay, Shell plc, and BASF SE are driving market dynamics through innovation and strategic alliances. North America and Asia-Pacific are anticipated to lead geographical growth, fueled by strong economic expansion and infrastructure development.
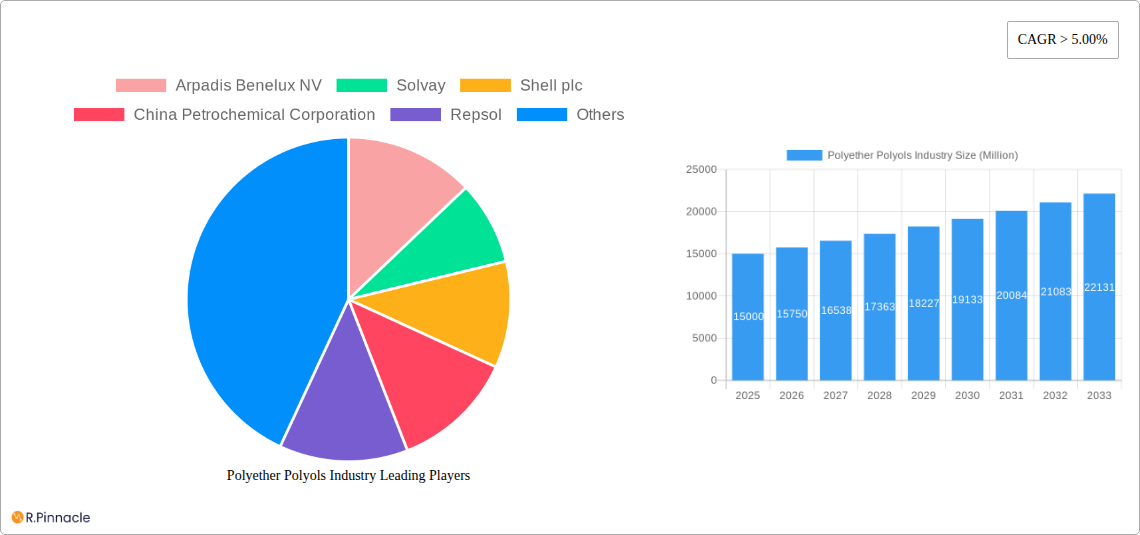
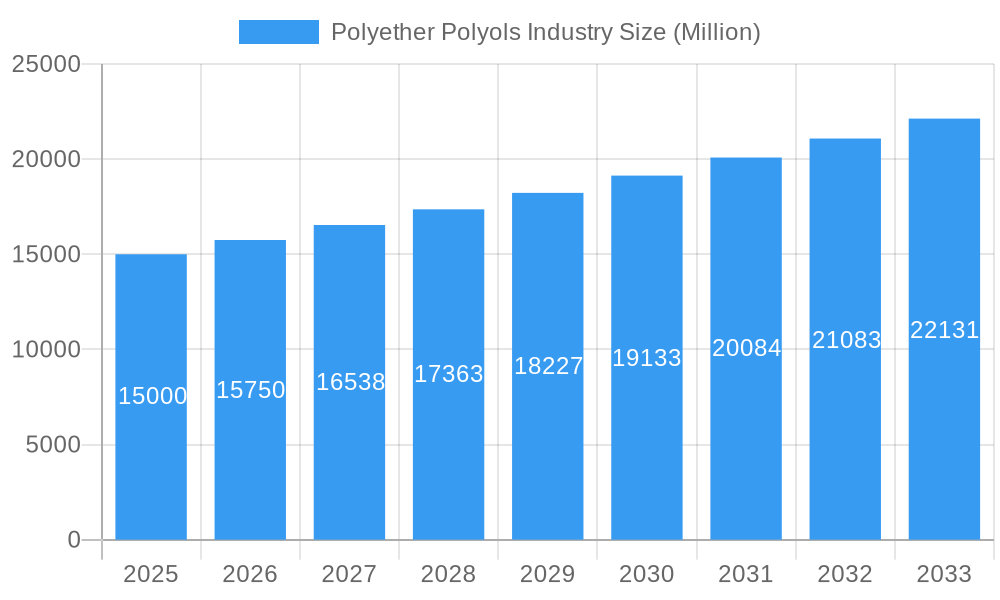
Polyether Polyols Industry Market Size (In Billion)
The forecast period (2025-2033) indicates sustained market expansion, driven by end-use sector growth and the adoption of advanced polyol technologies. The competitive landscape features major multinational corporations and specialized producers, fostering innovation. Despite challenges from raw material price fluctuations and environmental concerns, the polyether polyols market maintains a positive long-term outlook, supported by the persistent demand for flexible and rigid foams across various industries. The integration of bio-based polyols and sustainable manufacturing practices will be critical for future differentiation and growth. Regional growth rates will vary based on economic conditions, governmental policies, and industrialization progress.
Polyether Polyols Industry Company Market Share
Polyether Polyols Industry Market Report: 2019-2033
This comprehensive report provides an in-depth analysis of the Polyether Polyols industry, offering valuable insights for industry professionals, investors, and strategic decision-makers. Covering the period 2019-2033, with a focus on 2025, this report presents a detailed examination of market dynamics, key players, and future growth potential. The report uses Million for all values.
Polyether Polyols Industry Market Structure & Innovation Trends
The global polyether polyols market exhibits a moderately concentrated structure, with key players like BASF SE, Dow, and Huntsman International LLC holding significant market share. The estimated market share for these companies combined in 2025 is approximately xx%. Innovation is driven by the need for sustainable and high-performance materials, leading to increased R&D investment in bio-based polyols and advanced formulations. Regulatory frameworks, particularly those focusing on environmental sustainability and chemical safety, are shaping industry practices. Product substitutes, such as polyester polyols, present competitive challenges. The end-user demographics are diverse, with significant demand from the automotive, construction, and furniture industries. M&A activity has been moderate in recent years, with deals primarily focused on expanding production capacity and acquiring specialized technologies. Examples include the xx Million acquisition of INVISTA’s aromatic polyester polyol business by Stepan Company in 2021 and Repsol’s licensing agreement for polyol plant construction with a total capacity of 250,000 tonnes/year in 2021.
Polyether Polyols Industry Market Dynamics & Trends
The polyether polyols market is experiencing steady growth, with a projected CAGR of xx% during the forecast period (2025-2033). Key growth drivers include the increasing demand from the automotive and construction sectors, driven by factors such as rising urbanization and the growth of the global automotive industry. Technological disruptions, such as the development of bio-based polyols and more sustainable manufacturing processes, are altering the competitive landscape. Consumer preferences are shifting towards environmentally friendly and high-performance products, creating new market opportunities. Competitive dynamics are intense, with major players focusing on innovation, capacity expansion, and strategic partnerships to maintain market leadership. Market penetration of bio-based polyols is expected to reach xx% by 2033.
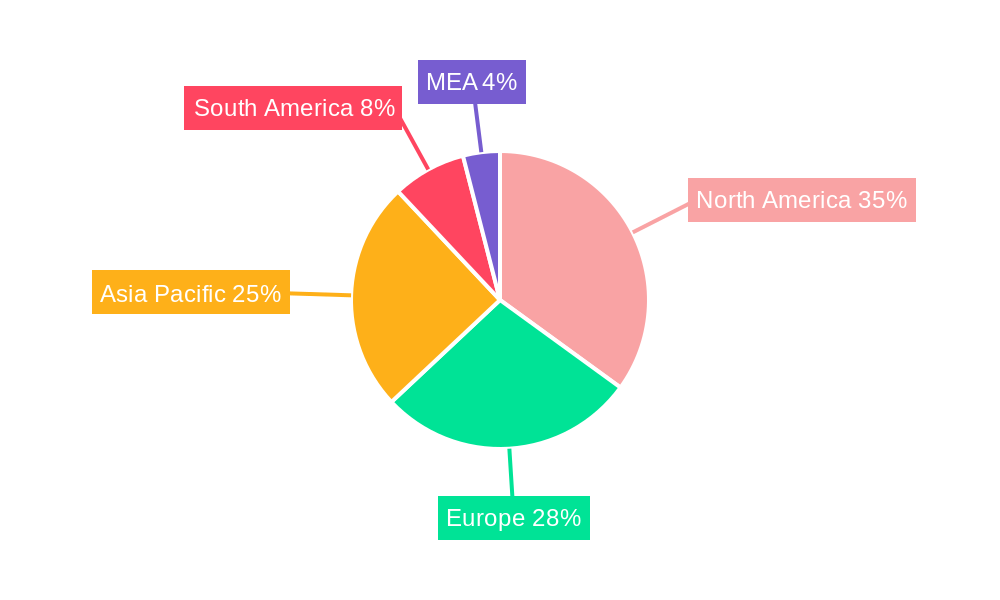
Dominant Regions & Segments in Polyether Polyols Industry
Asia-Pacific is projected to be the dominant region in the polyether polyols market throughout the forecast period.
- Key Drivers in Asia-Pacific: Rapid industrialization, robust infrastructure development, favorable government policies supporting manufacturing, and a large and growing consumer base.
- Dominant Segment (Type): Flexible polyether polyols are expected to maintain their dominance due to widespread use in furniture and bedding applications.
- Dominant Segment (End-user Industry): The automotive industry is projected to remain the largest end-user sector due to its high demand for flexible and rigid foams in vehicle manufacturing.
The European market holds a significant share, driven by stringent environmental regulations and a focus on sustainable materials. North America, while showing steady growth, faces competition from other regions.
Polyether Polyols Industry Product Innovations
Recent innovations focus on developing bio-based polyether polyols derived from renewable resources, offering enhanced sustainability and reduced environmental impact. These new products cater to the growing demand for environmentally friendly materials in various applications, improving market fit and providing a competitive advantage. Improvements in existing formulations and the introduction of new specialty polyols for niche applications are also key trends.
Report Scope & Segmentation Analysis
This report segments the polyether polyols market based on type (Flexible, Rigid, Other Types) and end-user industry (Furniture and Bedding, Construction, Automotive, Electrical and Electronics, Other End-user Industries). Each segment's growth projections, market size (in Millions), and competitive dynamics are thoroughly analyzed. For instance, the flexible polyols segment is expected to witness significant growth due to its extensive use in various applications, while the rigid polyols segment is projected to demonstrate steady growth due to its application in construction and insulation. The market sizes for these segments in 2025 are estimated at xx Million and xx Million respectively. The construction sector dominates the end-user market, with a projected market size of xx Million in 2025.
Key Drivers of Polyether Polyols Industry Growth
The industry's growth is propelled by several factors: rising demand from diverse end-user industries, particularly in the automotive and construction sectors; advancements in technology leading to improved product performance and sustainability; favorable government regulations supporting the use of eco-friendly materials; and increasing investments in research and development.
Challenges in the Polyether Polyols Industry Sector
The industry faces challenges such as fluctuating raw material prices, increasing competition from substitutes, stringent environmental regulations requiring compliance, and supply chain disruptions impacting production and delivery. These factors may limit growth and profitability in certain regions and segments. The cost of raw materials contributed to an estimated xx% decrease in profit margins in 2024.
Emerging Opportunities in Polyether Polyols Industry
Significant opportunities exist in developing bio-based polyols and expanding into emerging markets with high growth potential. Furthermore, catering to the increasing demand for high-performance, specialized polyols for niche applications presents considerable scope for future expansion. The development of innovative applications in areas such as renewable energy and sustainable packaging also offer considerable potential.
Leading Players in the Polyether Polyols Industry Market
- Arpadis Benelux NV
- Solvay
- Shell plc
- China Petrochemical Corporation
- Repsol
- BASF SE
- Huntsman International LLC
- Dow
- Covestro AG
- PCC Group
- Purinova Sp z o o
Key Developments in Polyether Polyols Industry
- December 2021: PCC Group expands production capacity and product range for ethoxylates, polyether polyols, and other ethoxylated products, including biodegradable options.
- February 2021: Repsol licenses agreement to build propylene oxide (PO), styrene monomer (SM), and polyol plants in China (250,000 tonnes/year capacity).
- January 2021: Stepan Company acquires INVISTA's aromatic polyester polyol business, expanding its market presence.
Future Outlook for Polyether Polyols Industry Market
The polyether polyols market is poised for continued growth, driven by increasing demand from key end-user sectors and the development of innovative, sustainable products. Strategic investments in R&D, capacity expansion, and collaborations will play a crucial role in shaping the industry's future. The market is expected to benefit from the rising focus on sustainable solutions and the continuous innovation in the sector, creating opportunities for market expansion.
Polyether Polyols Industry Segmentation
-
1. Type
- 1.1. Flexible
- 1.2. Rigid
- 1.3. Other Types
-
2. End-user Industry
- 2.1. Furniture and Bedding
- 2.2. Construction
- 2.3. Automotive
- 2.4. Electrical and Electronics
- 2.5. Other End-user Industries
Polyether Polyols Industry Segmentation By Geography
-
1. Asia Pacific
- 1.1. China
- 1.2. India
- 1.3. Japan
- 1.4. South Korea
- 1.5. Rest of Asia Pacific
-
2. North America
- 2.1. United States
- 2.2. Canada
- 2.3. Mexico
-
3. Europe
- 3.1. Germany
- 3.2. United Kingdom
- 3.3. Italy
- 3.4. France
- 3.5. Rest of Europe
-
4. South America
- 4.1. Brazil
- 4.2. Argentina
- 4.3. Rest of South America
-
5. Middle East and Africa
- 5.1. Saudi Arabia
- 5.2. South Africa
- 5.3. Rest of Middle East and Africa
Polyether Polyols Industry Regional Market Share
Geographic Coverage of Polyether Polyols Industry
Polyether Polyols Industry REPORT HIGHLIGHTS
| Aspects | Details |
|---|---|
| Study Period | 2020-2034 |
| Base Year | 2025 |
| Estimated Year | 2026 |
| Forecast Period | 2026-2034 |
| Historical Period | 2020-2025 |
| Growth Rate | CAGR of 5% from 2020-2034 |
| Segmentation |
|
Table of Contents
- 1. Introduction
- 1.1. Research Scope
- 1.2. Market Segmentation
- 1.3. Research Objective
- 1.4. Definitions and Assumptions
- 2. Executive Summary
- 2.1. Market Snapshot
- 3. Market Dynamics
- 3.1. Market Drivers
- 3.2. Market Restrains
- 3.3. Market Trends
- 3.4. Market Opportunities
- 4. Market Factor Analysis
- 4.1. Porters Five Forces
- 4.1.1. Bargaining Power of Suppliers
- 4.1.2. Bargaining Power of Buyers
- 4.1.3. Threat of New Entrants
- 4.1.4. Threat of Substitutes
- 4.1.5. Competitive Rivalry
- 4.2. PESTEL analysis
- 4.3. BCG Analysis
- 4.3.1. Stars (High Growth, High Market Share)
- 4.3.2. Cash Cows (Low Growth, High Market Share)
- 4.3.3. Question Mark (High Growth, Low Market Share)
- 4.3.4. Dogs (Low Growth, Low Market Share)
- 4.4. Ansoff Matrix Analysis
- 4.5. Supply Chain Analysis
- 4.6. Regulatory Landscape
- 4.7. Current Market Potential and Opportunity Assessment (TAM–SAM–SOM Framework)
- 4.8. PRI Analyst Note
- 4.1. Porters Five Forces
- 5. Market Analysis, Insights and Forecast 2021-2033
- 5.1. Market Analysis, Insights and Forecast - by Type
- 5.1.1. Flexible
- 5.1.2. Rigid
- 5.1.3. Other Types
- 5.2. Market Analysis, Insights and Forecast - by End-user Industry
- 5.2.1. Furniture and Bedding
- 5.2.2. Construction
- 5.2.3. Automotive
- 5.2.4. Electrical and Electronics
- 5.2.5. Other End-user Industries
- 5.3. Market Analysis, Insights and Forecast - by Region
- 5.3.1. Asia Pacific
- 5.3.2. North America
- 5.3.3. Europe
- 5.3.4. South America
- 5.3.5. Middle East and Africa
- 5.1. Market Analysis, Insights and Forecast - by Type
- 6. Global Polyether Polyols Industry Analysis, Insights and Forecast, 2021-2033
- 6.1. Market Analysis, Insights and Forecast - by Type
- 6.1.1. Flexible
- 6.1.2. Rigid
- 6.1.3. Other Types
- 6.2. Market Analysis, Insights and Forecast - by End-user Industry
- 6.2.1. Furniture and Bedding
- 6.2.2. Construction
- 6.2.3. Automotive
- 6.2.4. Electrical and Electronics
- 6.2.5. Other End-user Industries
- 6.1. Market Analysis, Insights and Forecast - by Type
- 7. Asia Pacific Polyether Polyols Industry Analysis, Insights and Forecast, 2020-2032
- 7.1. Market Analysis, Insights and Forecast - by Type
- 7.1.1. Flexible
- 7.1.2. Rigid
- 7.1.3. Other Types
- 7.2. Market Analysis, Insights and Forecast - by End-user Industry
- 7.2.1. Furniture and Bedding
- 7.2.2. Construction
- 7.2.3. Automotive
- 7.2.4. Electrical and Electronics
- 7.2.5. Other End-user Industries
- 7.1. Market Analysis, Insights and Forecast - by Type
- 8. North America Polyether Polyols Industry Analysis, Insights and Forecast, 2020-2032
- 8.1. Market Analysis, Insights and Forecast - by Type
- 8.1.1. Flexible
- 8.1.2. Rigid
- 8.1.3. Other Types
- 8.2. Market Analysis, Insights and Forecast - by End-user Industry
- 8.2.1. Furniture and Bedding
- 8.2.2. Construction
- 8.2.3. Automotive
- 8.2.4. Electrical and Electronics
- 8.2.5. Other End-user Industries
- 8.1. Market Analysis, Insights and Forecast - by Type
- 9. Europe Polyether Polyols Industry Analysis, Insights and Forecast, 2020-2032
- 9.1. Market Analysis, Insights and Forecast - by Type
- 9.1.1. Flexible
- 9.1.2. Rigid
- 9.1.3. Other Types
- 9.2. Market Analysis, Insights and Forecast - by End-user Industry
- 9.2.1. Furniture and Bedding
- 9.2.2. Construction
- 9.2.3. Automotive
- 9.2.4. Electrical and Electronics
- 9.2.5. Other End-user Industries
- 9.1. Market Analysis, Insights and Forecast - by Type
- 10. South America Polyether Polyols Industry Analysis, Insights and Forecast, 2020-2032
- 10.1. Market Analysis, Insights and Forecast - by Type
- 10.1.1. Flexible
- 10.1.2. Rigid
- 10.1.3. Other Types
- 10.2. Market Analysis, Insights and Forecast - by End-user Industry
- 10.2.1. Furniture and Bedding
- 10.2.2. Construction
- 10.2.3. Automotive
- 10.2.4. Electrical and Electronics
- 10.2.5. Other End-user Industries
- 10.1. Market Analysis, Insights and Forecast - by Type
- 11. Middle East and Africa Polyether Polyols Industry Analysis, Insights and Forecast, 2020-2032
- 11.1. Market Analysis, Insights and Forecast - by Type
- 11.1.1. Flexible
- 11.1.2. Rigid
- 11.1.3. Other Types
- 11.2. Market Analysis, Insights and Forecast - by End-user Industry
- 11.2.1. Furniture and Bedding
- 11.2.2. Construction
- 11.2.3. Automotive
- 11.2.4. Electrical and Electronics
- 11.2.5. Other End-user Industries
- 11.1. Market Analysis, Insights and Forecast - by Type
- 12. Competitive Analysis
- 12.1. Company Profiles
- 12.1.1 Arpadis Benelux NV
- 12.1.1.1. Company Overview
- 12.1.1.2. Products
- 12.1.1.3. Company Financials
- 12.1.1.4. SWOT Analysis
- 12.1.2 Solvay
- 12.1.2.1. Company Overview
- 12.1.2.2. Products
- 12.1.2.3. Company Financials
- 12.1.2.4. SWOT Analysis
- 12.1.3 Shell plc
- 12.1.3.1. Company Overview
- 12.1.3.2. Products
- 12.1.3.3. Company Financials
- 12.1.3.4. SWOT Analysis
- 12.1.4 China Petrochemical Corporation
- 12.1.4.1. Company Overview
- 12.1.4.2. Products
- 12.1.4.3. Company Financials
- 12.1.4.4. SWOT Analysis
- 12.1.5 Repsol
- 12.1.5.1. Company Overview
- 12.1.5.2. Products
- 12.1.5.3. Company Financials
- 12.1.5.4. SWOT Analysis
- 12.1.6 BASF SE
- 12.1.6.1. Company Overview
- 12.1.6.2. Products
- 12.1.6.3. Company Financials
- 12.1.6.4. SWOT Analysis
- 12.1.7 Huntsman International LLC
- 12.1.7.1. Company Overview
- 12.1.7.2. Products
- 12.1.7.3. Company Financials
- 12.1.7.4. SWOT Analysis
- 12.1.8 Dow
- 12.1.8.1. Company Overview
- 12.1.8.2. Products
- 12.1.8.3. Company Financials
- 12.1.8.4. SWOT Analysis
- 12.1.9 Covestro AG
- 12.1.9.1. Company Overview
- 12.1.9.2. Products
- 12.1.9.3. Company Financials
- 12.1.9.4. SWOT Analysis
- 12.1.10 PCC Group
- 12.1.10.1. Company Overview
- 12.1.10.2. Products
- 12.1.10.3. Company Financials
- 12.1.10.4. SWOT Analysis
- 12.1.11 Purinova Sp z o o
- 12.1.11.1. Company Overview
- 12.1.11.2. Products
- 12.1.11.3. Company Financials
- 12.1.11.4. SWOT Analysis
- 12.1.1 Arpadis Benelux NV
- 12.2. Market Entropy
- 12.2.1 Company's Key Areas Served
- 12.2.2 Recent Developments
- 12.3. Company Market Share Analysis 2025
- 12.3.1 Top 5 Companies Market Share Analysis
- 12.3.2 Top 3 Companies Market Share Analysis
- 12.4. List of Potential Customers
- 13. Research Methodology
List of Figures
- Figure 1: Global Polyether Polyols Industry Revenue Breakdown (billion, %) by Region 2025 & 2033
- Figure 2: Global Polyether Polyols Industry Volume Breakdown (K Tons, %) by Region 2025 & 2033
- Figure 3: Asia Pacific Polyether Polyols Industry Revenue (billion), by Type 2025 & 2033
- Figure 4: Asia Pacific Polyether Polyols Industry Volume (K Tons), by Type 2025 & 2033
- Figure 5: Asia Pacific Polyether Polyols Industry Revenue Share (%), by Type 2025 & 2033
- Figure 6: Asia Pacific Polyether Polyols Industry Volume Share (%), by Type 2025 & 2033
- Figure 7: Asia Pacific Polyether Polyols Industry Revenue (billion), by End-user Industry 2025 & 2033
- Figure 8: Asia Pacific Polyether Polyols Industry Volume (K Tons), by End-user Industry 2025 & 2033
- Figure 9: Asia Pacific Polyether Polyols Industry Revenue Share (%), by End-user Industry 2025 & 2033
- Figure 10: Asia Pacific Polyether Polyols Industry Volume Share (%), by End-user Industry 2025 & 2033
- Figure 11: Asia Pacific Polyether Polyols Industry Revenue (billion), by Country 2025 & 2033
- Figure 12: Asia Pacific Polyether Polyols Industry Volume (K Tons), by Country 2025 & 2033
- Figure 13: Asia Pacific Polyether Polyols Industry Revenue Share (%), by Country 2025 & 2033
- Figure 14: Asia Pacific Polyether Polyols Industry Volume Share (%), by Country 2025 & 2033
- Figure 15: North America Polyether Polyols Industry Revenue (billion), by Type 2025 & 2033
- Figure 16: North America Polyether Polyols Industry Volume (K Tons), by Type 2025 & 2033
- Figure 17: North America Polyether Polyols Industry Revenue Share (%), by Type 2025 & 2033
- Figure 18: North America Polyether Polyols Industry Volume Share (%), by Type 2025 & 2033
- Figure 19: North America Polyether Polyols Industry Revenue (billion), by End-user Industry 2025 & 2033
- Figure 20: North America Polyether Polyols Industry Volume (K Tons), by End-user Industry 2025 & 2033
- Figure 21: North America Polyether Polyols Industry Revenue Share (%), by End-user Industry 2025 & 2033
- Figure 22: North America Polyether Polyols Industry Volume Share (%), by End-user Industry 2025 & 2033
- Figure 23: North America Polyether Polyols Industry Revenue (billion), by Country 2025 & 2033
- Figure 24: North America Polyether Polyols Industry Volume (K Tons), by Country 2025 & 2033
- Figure 25: North America Polyether Polyols Industry Revenue Share (%), by Country 2025 & 2033
- Figure 26: North America Polyether Polyols Industry Volume Share (%), by Country 2025 & 2033
- Figure 27: Europe Polyether Polyols Industry Revenue (billion), by Type 2025 & 2033
- Figure 28: Europe Polyether Polyols Industry Volume (K Tons), by Type 2025 & 2033
- Figure 29: Europe Polyether Polyols Industry Revenue Share (%), by Type 2025 & 2033
- Figure 30: Europe Polyether Polyols Industry Volume Share (%), by Type 2025 & 2033
- Figure 31: Europe Polyether Polyols Industry Revenue (billion), by End-user Industry 2025 & 2033
- Figure 32: Europe Polyether Polyols Industry Volume (K Tons), by End-user Industry 2025 & 2033
- Figure 33: Europe Polyether Polyols Industry Revenue Share (%), by End-user Industry 2025 & 2033
- Figure 34: Europe Polyether Polyols Industry Volume Share (%), by End-user Industry 2025 & 2033
- Figure 35: Europe Polyether Polyols Industry Revenue (billion), by Country 2025 & 2033
- Figure 36: Europe Polyether Polyols Industry Volume (K Tons), by Country 2025 & 2033
- Figure 37: Europe Polyether Polyols Industry Revenue Share (%), by Country 2025 & 2033
- Figure 38: Europe Polyether Polyols Industry Volume Share (%), by Country 2025 & 2033
- Figure 39: South America Polyether Polyols Industry Revenue (billion), by Type 2025 & 2033
- Figure 40: South America Polyether Polyols Industry Volume (K Tons), by Type 2025 & 2033
- Figure 41: South America Polyether Polyols Industry Revenue Share (%), by Type 2025 & 2033
- Figure 42: South America Polyether Polyols Industry Volume Share (%), by Type 2025 & 2033
- Figure 43: South America Polyether Polyols Industry Revenue (billion), by End-user Industry 2025 & 2033
- Figure 44: South America Polyether Polyols Industry Volume (K Tons), by End-user Industry 2025 & 2033
- Figure 45: South America Polyether Polyols Industry Revenue Share (%), by End-user Industry 2025 & 2033
- Figure 46: South America Polyether Polyols Industry Volume Share (%), by End-user Industry 2025 & 2033
- Figure 47: South America Polyether Polyols Industry Revenue (billion), by Country 2025 & 2033
- Figure 48: South America Polyether Polyols Industry Volume (K Tons), by Country 2025 & 2033
- Figure 49: South America Polyether Polyols Industry Revenue Share (%), by Country 2025 & 2033
- Figure 50: South America Polyether Polyols Industry Volume Share (%), by Country 2025 & 2033
- Figure 51: Middle East and Africa Polyether Polyols Industry Revenue (billion), by Type 2025 & 2033
- Figure 52: Middle East and Africa Polyether Polyols Industry Volume (K Tons), by Type 2025 & 2033
- Figure 53: Middle East and Africa Polyether Polyols Industry Revenue Share (%), by Type 2025 & 2033
- Figure 54: Middle East and Africa Polyether Polyols Industry Volume Share (%), by Type 2025 & 2033
- Figure 55: Middle East and Africa Polyether Polyols Industry Revenue (billion), by End-user Industry 2025 & 2033
- Figure 56: Middle East and Africa Polyether Polyols Industry Volume (K Tons), by End-user Industry 2025 & 2033
- Figure 57: Middle East and Africa Polyether Polyols Industry Revenue Share (%), by End-user Industry 2025 & 2033
- Figure 58: Middle East and Africa Polyether Polyols Industry Volume Share (%), by End-user Industry 2025 & 2033
- Figure 59: Middle East and Africa Polyether Polyols Industry Revenue (billion), by Country 2025 & 2033
- Figure 60: Middle East and Africa Polyether Polyols Industry Volume (K Tons), by Country 2025 & 2033
- Figure 61: Middle East and Africa Polyether Polyols Industry Revenue Share (%), by Country 2025 & 2033
- Figure 62: Middle East and Africa Polyether Polyols Industry Volume Share (%), by Country 2025 & 2033
List of Tables
- Table 1: Global Polyether Polyols Industry Revenue billion Forecast, by Type 2020 & 2033
- Table 2: Global Polyether Polyols Industry Volume K Tons Forecast, by Type 2020 & 2033
- Table 3: Global Polyether Polyols Industry Revenue billion Forecast, by End-user Industry 2020 & 2033
- Table 4: Global Polyether Polyols Industry Volume K Tons Forecast, by End-user Industry 2020 & 2033
- Table 5: Global Polyether Polyols Industry Revenue billion Forecast, by Region 2020 & 2033
- Table 6: Global Polyether Polyols Industry Volume K Tons Forecast, by Region 2020 & 2033
- Table 7: Global Polyether Polyols Industry Revenue billion Forecast, by Type 2020 & 2033
- Table 8: Global Polyether Polyols Industry Volume K Tons Forecast, by Type 2020 & 2033
- Table 9: Global Polyether Polyols Industry Revenue billion Forecast, by End-user Industry 2020 & 2033
- Table 10: Global Polyether Polyols Industry Volume K Tons Forecast, by End-user Industry 2020 & 2033
- Table 11: Global Polyether Polyols Industry Revenue billion Forecast, by Country 2020 & 2033
- Table 12: Global Polyether Polyols Industry Volume K Tons Forecast, by Country 2020 & 2033
- Table 13: China Polyether Polyols Industry Revenue (billion) Forecast, by Application 2020 & 2033
- Table 14: China Polyether Polyols Industry Volume (K Tons) Forecast, by Application 2020 & 2033
- Table 15: India Polyether Polyols Industry Revenue (billion) Forecast, by Application 2020 & 2033
- Table 16: India Polyether Polyols Industry Volume (K Tons) Forecast, by Application 2020 & 2033
- Table 17: Japan Polyether Polyols Industry Revenue (billion) Forecast, by Application 2020 & 2033
- Table 18: Japan Polyether Polyols Industry Volume (K Tons) Forecast, by Application 2020 & 2033
- Table 19: South Korea Polyether Polyols Industry Revenue (billion) Forecast, by Application 2020 & 2033
- Table 20: South Korea Polyether Polyols Industry Volume (K Tons) Forecast, by Application 2020 & 2033
- Table 21: Rest of Asia Pacific Polyether Polyols Industry Revenue (billion) Forecast, by Application 2020 & 2033
- Table 22: Rest of Asia Pacific Polyether Polyols Industry Volume (K Tons) Forecast, by Application 2020 & 2033
- Table 23: Global Polyether Polyols Industry Revenue billion Forecast, by Type 2020 & 2033
- Table 24: Global Polyether Polyols Industry Volume K Tons Forecast, by Type 2020 & 2033
- Table 25: Global Polyether Polyols Industry Revenue billion Forecast, by End-user Industry 2020 & 2033
- Table 26: Global Polyether Polyols Industry Volume K Tons Forecast, by End-user Industry 2020 & 2033
- Table 27: Global Polyether Polyols Industry Revenue billion Forecast, by Country 2020 & 2033
- Table 28: Global Polyether Polyols Industry Volume K Tons Forecast, by Country 2020 & 2033
- Table 29: United States Polyether Polyols Industry Revenue (billion) Forecast, by Application 2020 & 2033
- Table 30: United States Polyether Polyols Industry Volume (K Tons) Forecast, by Application 2020 & 2033
- Table 31: Canada Polyether Polyols Industry Revenue (billion) Forecast, by Application 2020 & 2033
- Table 32: Canada Polyether Polyols Industry Volume (K Tons) Forecast, by Application 2020 & 2033
- Table 33: Mexico Polyether Polyols Industry Revenue (billion) Forecast, by Application 2020 & 2033
- Table 34: Mexico Polyether Polyols Industry Volume (K Tons) Forecast, by Application 2020 & 2033
- Table 35: Global Polyether Polyols Industry Revenue billion Forecast, by Type 2020 & 2033
- Table 36: Global Polyether Polyols Industry Volume K Tons Forecast, by Type 2020 & 2033
- Table 37: Global Polyether Polyols Industry Revenue billion Forecast, by End-user Industry 2020 & 2033
- Table 38: Global Polyether Polyols Industry Volume K Tons Forecast, by End-user Industry 2020 & 2033
- Table 39: Global Polyether Polyols Industry Revenue billion Forecast, by Country 2020 & 2033
- Table 40: Global Polyether Polyols Industry Volume K Tons Forecast, by Country 2020 & 2033
- Table 41: Germany Polyether Polyols Industry Revenue (billion) Forecast, by Application 2020 & 2033
- Table 42: Germany Polyether Polyols Industry Volume (K Tons) Forecast, by Application 2020 & 2033
- Table 43: United Kingdom Polyether Polyols Industry Revenue (billion) Forecast, by Application 2020 & 2033
- Table 44: United Kingdom Polyether Polyols Industry Volume (K Tons) Forecast, by Application 2020 & 2033
- Table 45: Italy Polyether Polyols Industry Revenue (billion) Forecast, by Application 2020 & 2033
- Table 46: Italy Polyether Polyols Industry Volume (K Tons) Forecast, by Application 2020 & 2033
- Table 47: France Polyether Polyols Industry Revenue (billion) Forecast, by Application 2020 & 2033
- Table 48: France Polyether Polyols Industry Volume (K Tons) Forecast, by Application 2020 & 2033
- Table 49: Rest of Europe Polyether Polyols Industry Revenue (billion) Forecast, by Application 2020 & 2033
- Table 50: Rest of Europe Polyether Polyols Industry Volume (K Tons) Forecast, by Application 2020 & 2033
- Table 51: Global Polyether Polyols Industry Revenue billion Forecast, by Type 2020 & 2033
- Table 52: Global Polyether Polyols Industry Volume K Tons Forecast, by Type 2020 & 2033
- Table 53: Global Polyether Polyols Industry Revenue billion Forecast, by End-user Industry 2020 & 2033
- Table 54: Global Polyether Polyols Industry Volume K Tons Forecast, by End-user Industry 2020 & 2033
- Table 55: Global Polyether Polyols Industry Revenue billion Forecast, by Country 2020 & 2033
- Table 56: Global Polyether Polyols Industry Volume K Tons Forecast, by Country 2020 & 2033
- Table 57: Brazil Polyether Polyols Industry Revenue (billion) Forecast, by Application 2020 & 2033
- Table 58: Brazil Polyether Polyols Industry Volume (K Tons) Forecast, by Application 2020 & 2033
- Table 59: Argentina Polyether Polyols Industry Revenue (billion) Forecast, by Application 2020 & 2033
- Table 60: Argentina Polyether Polyols Industry Volume (K Tons) Forecast, by Application 2020 & 2033
- Table 61: Rest of South America Polyether Polyols Industry Revenue (billion) Forecast, by Application 2020 & 2033
- Table 62: Rest of South America Polyether Polyols Industry Volume (K Tons) Forecast, by Application 2020 & 2033
- Table 63: Global Polyether Polyols Industry Revenue billion Forecast, by Type 2020 & 2033
- Table 64: Global Polyether Polyols Industry Volume K Tons Forecast, by Type 2020 & 2033
- Table 65: Global Polyether Polyols Industry Revenue billion Forecast, by End-user Industry 2020 & 2033
- Table 66: Global Polyether Polyols Industry Volume K Tons Forecast, by End-user Industry 2020 & 2033
- Table 67: Global Polyether Polyols Industry Revenue billion Forecast, by Country 2020 & 2033
- Table 68: Global Polyether Polyols Industry Volume K Tons Forecast, by Country 2020 & 2033
- Table 69: Saudi Arabia Polyether Polyols Industry Revenue (billion) Forecast, by Application 2020 & 2033
- Table 70: Saudi Arabia Polyether Polyols Industry Volume (K Tons) Forecast, by Application 2020 & 2033
- Table 71: South Africa Polyether Polyols Industry Revenue (billion) Forecast, by Application 2020 & 2033
- Table 72: South Africa Polyether Polyols Industry Volume (K Tons) Forecast, by Application 2020 & 2033
- Table 73: Rest of Middle East and Africa Polyether Polyols Industry Revenue (billion) Forecast, by Application 2020 & 2033
- Table 74: Rest of Middle East and Africa Polyether Polyols Industry Volume (K Tons) Forecast, by Application 2020 & 2033
Frequently Asked Questions
1. What is the projected Compound Annual Growth Rate (CAGR) of the Polyether Polyols Industry?
The projected CAGR is approximately 5%.
2. Which companies are prominent players in the Polyether Polyols Industry?
Key companies in the market include Arpadis Benelux NV, Solvay, Shell plc, China Petrochemical Corporation, Repsol, BASF SE, Huntsman International LLC, Dow, Covestro AG, PCC Group, Purinova Sp z o o.
3. What are the main segments of the Polyether Polyols Industry?
The market segments include Type, End-user Industry.
4. Can you provide details about the market size?
The market size is estimated to be USD 30 billion as of 2022.
5. What are some drivers contributing to market growth?
Rising Demand for Flexible and Rigid Polyurethane Foam; Growth of Automotive Industry; Rising Demand from Construction Industry.
6. What are the notable trends driving market growth?
Rising Demand from Construction Industry.
7. Are there any restraints impacting market growth?
Volatile Prices of Raw Materials; Stringent Government Regulations on Polyurethane Foam Manufacturing.
8. Can you provide examples of recent developments in the market?
In December 2021, PCC Group has expanded its production capacity and the range of manufactured products. The installation is to produce a range of ethoxylates, polyether polyols, and other ethoxylated products, including biodegradable products.
9. What pricing options are available for accessing the report?
Pricing options include single-user, multi-user, and enterprise licenses priced at USD 4750, USD 5250, and USD 8750 respectively.
10. Is the market size provided in terms of value or volume?
The market size is provided in terms of value, measured in billion and volume, measured in K Tons.
11. Are there any specific market keywords associated with the report?
Yes, the market keyword associated with the report is "Polyether Polyols Industry," which aids in identifying and referencing the specific market segment covered.
12. How do I determine which pricing option suits my needs best?
The pricing options vary based on user requirements and access needs. Individual users may opt for single-user licenses, while businesses requiring broader access may choose multi-user or enterprise licenses for cost-effective access to the report.
13. Are there any additional resources or data provided in the Polyether Polyols Industry report?
While the report offers comprehensive insights, it's advisable to review the specific contents or supplementary materials provided to ascertain if additional resources or data are available.
14. How can I stay updated on further developments or reports in the Polyether Polyols Industry?
To stay informed about further developments, trends, and reports in the Polyether Polyols Industry, consider subscribing to industry newsletters, following relevant companies and organizations, or regularly checking reputable industry news sources and publications.
Methodology
Step 1 - Identification of Relevant Samples Size from Population Database


Step 2 - Approaches for Defining Global Market Size (Value, Volume* & Price*)

Note*: In applicable scenarios
Step 3 - Data Sources
Primary Research
- Web Analytics
- Survey Reports
- Research Institute
- Latest Research Reports
- Opinion Leaders
Secondary Research
- Annual Reports
- White Paper
- Latest Press Release
- Industry Association
- Paid Database
- Investor Presentations

Step 4 - Data Triangulation
Involves using different sources of information in order to increase the validity of a study
These sources are likely to be stakeholders in a program - participants, other researchers, program staff, other community members, and so on.
Then we put all data in single framework & apply various statistical tools to find out the dynamic on the market.
During the analysis stage, feedback from the stakeholder groups would be compared to determine areas of agreement as well as areas of divergence