

Key Insights
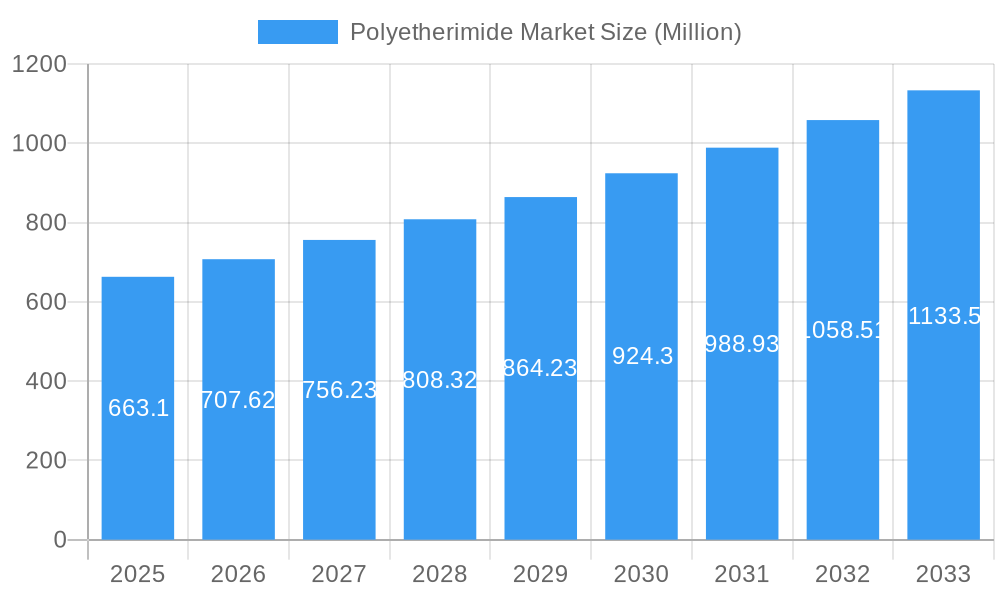
The polyetherimide (PEI) market, valued at $663.10 million in 2025, is projected to experience robust growth, exhibiting a Compound Annual Growth Rate (CAGR) exceeding 6.50% from 2025 to 2033. This expansion is driven by several key factors. The increasing demand for high-performance materials in diverse sectors such as transportation (lightweighting initiatives in automotive and aerospace), electrical and electronics (demand for high-temperature insulation and components), and healthcare (sterilizable medical devices) fuels market growth. Furthermore, the inherent properties of PEI, including its exceptional thermal stability, chemical resistance, and mechanical strength, make it an ideal choice for demanding applications. The market segmentation reveals significant contributions from reinforced PEI grades, reflecting the preference for enhanced material properties in high-stress applications. Major players like Solvay, SABIC, and Mitsubishi Chemical Group are leveraging their technological expertise to cater to this growing demand, driving innovation in material formulations and manufacturing processes. Geographic analysis indicates strong growth across North America and Asia Pacific, fueled by substantial manufacturing activities and a rising consumer base. However, factors such as the relatively high cost of PEI compared to alternative polymers and potential supply chain constraints could act as restraints on market growth. Continued research and development into cost-effective manufacturing processes, alongside the exploration of new applications, are expected to mitigate these challenges and sustain market expansion.
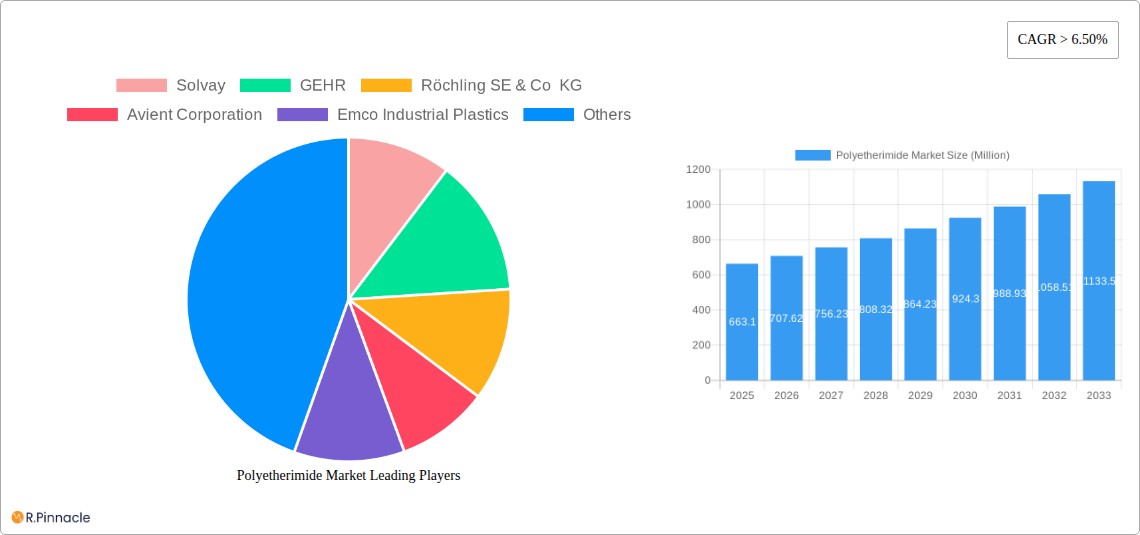
Polyetherimide Market Market Size (In Million)
The forecast period (2025-2033) anticipates a significant market expansion, driven primarily by technological advancements and increasing adoption in emerging applications. The transportation sector, particularly automotive and aerospace, presents a significant opportunity for growth due to the ongoing push for lightweighting and improved fuel efficiency. The electronics industry's need for high-performance components for 5G infrastructure and advanced computing further propels demand. Furthermore, growing awareness of PEI's biocompatibility and sterilizability is driving its adoption in the healthcare sector. The market is anticipated to see strategic partnerships and collaborations among material manufacturers, processors, and end-users to foster innovation and develop customized PEI solutions for niche applications. The continued focus on sustainability and the development of more environmentally friendly production processes will also play a crucial role in shaping the future of the PEI market.
Polyetherimide Market Company Market Share
This in-depth report provides a comprehensive analysis of the Polyetherimide market, offering invaluable insights for industry professionals, investors, and strategic decision-makers. Covering the period from 2019 to 2033, with a base year of 2025 and a forecast period of 2025-2033, this report meticulously examines market dynamics, competitive landscapes, and future growth potential.
Polyetherimide Market Market Structure & Innovation Trends
The Polyetherimide market exhibits a moderately concentrated structure, with key players like Solvay, GEHR, Röchling SE & Co KG, and Avient Corporation holding significant market share. The xx% market share held by the top 5 players indicates room for both consolidation and the emergence of niche players. Innovation is driven by the need for high-performance materials in demanding applications, particularly in the transportation and electronics sectors. Stringent regulatory frameworks regarding material safety and environmental impact are influencing product development. Competition from alternative materials like polyimides and PEEK exists, although Polyetherimide's unique properties, such as high temperature resistance and chemical stability, maintain its competitive edge. Recent M&A activities, valued at approximately xx Million in the past five years, have focused on expanding geographical reach and enhancing product portfolios. The average deal size was approximately xx Million.
Polyetherimide Market Market Dynamics & Trends
The Polyetherimide market is projected to experience a CAGR of xx% during the forecast period (2025-2033), driven by increasing demand from the automotive, electronics, and healthcare industries. Technological advancements in material science are leading to the development of higher-performance Polyetherimide variants with improved properties, such as enhanced thermal stability and flame retardancy. Growing consumer preference for lightweight, durable, and sustainable products is further fueling market growth. The increasing adoption of electric vehicles and the rise of 5G technology are creating significant opportunities for Polyetherimide in these sectors. However, price fluctuations in raw materials and intense competition among established players present ongoing challenges. Market penetration in emerging economies is expected to increase significantly by xx%, driven by rising disposable incomes and infrastructural developments.
Dominant Regions & Segments in Polyetherimide Market
The Asia Pacific region dominates the global Polyetherimide market, driven by rapid industrialization, significant investments in infrastructure, and a burgeoning automotive sector. China and Japan are particularly significant contributors.
Key Drivers in Asia-Pacific:
- Strong government support for technological advancement and manufacturing.
- Rapid growth of the automotive and electronics industries.
- Increasing adoption of high-performance materials in various applications.
Dominant Segments:
- Grade: Reinforced Polyetherimide holds a larger market share due to its enhanced mechanical properties, making it suitable for demanding applications.
- End-User Industry: The transportation sector is currently the largest consumer of Polyetherimide, followed by the electrical and electronics sector. This is mainly due to the material's ability to withstand high temperatures and harsh conditions. The healthcare sector shows high growth potential with a projected increase of xx% over the forecast period.
Growth in other regions is also expected, but at a slower pace compared to Asia-Pacific. North America and Europe are expected to show steady growth propelled by the increase in demand for high-performance polymers in various industries.
Polyetherimide Market Product Innovations
Recent innovations focus on developing Polyetherimide compounds with improved flame retardancy, higher thermal stability, and enhanced mechanical strength. These advancements cater to the growing demands of high-temperature applications, particularly in the aerospace and automotive industries. The development of bio-based Polyetherimide variants is gaining traction as sustainability concerns rise. These innovations are providing competitive advantages through improved performance and enhanced market fit, responding to the increasing demand for more sustainable materials.
Report Scope & Segmentation Analysis
This report segments the Polyetherimide market based on grade (reinforced and unreinforced) and end-user industry (transportation, electrical and electronics, consumer goods, healthcare, household and industrial appliances, and others). Each segment's market size, growth projections, and competitive dynamics are analyzed in detail. The reinforced segment is expected to exhibit faster growth due to the increasing demand for high-strength materials. Within end-user industries, transportation and electronics are projected to dominate, driven by the robust demand for lightweight yet durable components.
Key Drivers of Polyetherimide Market Growth
Several factors fuel the Polyetherimide market's growth. Advancements in material science resulting in higher-performance materials is a key driver. The robust growth of end-user industries, especially in developing economies, increases demand. Government regulations promoting the use of eco-friendly materials are also contributing to market expansion. Furthermore, the increasing preference for durable and lightweight materials across various industries is propelling growth.
Challenges in the Polyetherimide Market Sector
The Polyetherimide market faces several challenges. Fluctuations in raw material prices impact profitability. Intense competition from alternative materials and established players pressures margins. Meeting stringent regulatory compliance adds cost and complexity. Supply chain disruptions can cause production delays and impact market availability. These factors collectively restrain market growth to some extent.
Emerging Opportunities in Polyetherimide Market
Several emerging opportunities exist. The development of bio-based Polyetherimide variants offers a pathway for sustainable growth. The growing demand for lightweight materials in the automotive and aerospace sectors creates significant potential. Expansion into new and emerging markets, such as renewable energy and medical devices, presents further opportunities. Exploring new applications within existing industries can also drive future growth.
Leading Players in the Polyetherimide Market Market
- Solvay
- GEHR
- Röchling SE & Co KG
- Avient Corporation
- Emco Industrial Plastics
- SABIC
- The Mitsubishi Chemical Group of companies
- RTP Company
- Kuraray Europe GmbH
- Aikolon Oy
- Ensinger
- Eagle Performance Plastics Inc
Key Developments in Polyetherimide Market Industry
- 2022-Q4: Solvay launched a new high-performance Polyetherimide grade with enhanced thermal stability.
- 2023-Q1: Avient Corporation announced a strategic partnership to expand its Polyetherimide manufacturing capacity.
- 2023-Q2: A significant merger between two smaller Polyetherimide manufacturers resulted in a more consolidated market. (Details of the merger are unavailable for this report).
Future Outlook for Polyetherimide Market Market
The Polyetherimide market is poised for robust growth over the next decade, driven by technological advancements, increasing demand from key end-user industries, and the emergence of novel applications. Strategic partnerships, investments in R&D, and focus on sustainability will play a crucial role in shaping the future of this market. The continuous innovation in material properties and the expansion into new markets will unlock significant growth potential, further establishing Polyetherimide as a high-performance material of choice across diverse sectors.
Polyetherimide Market Segmentation
-
1. Grade
- 1.1. Reinforced
- 1.2. Unreinforced
-
2. End-User Industry
- 2.1. Transportation
- 2.2. Electrical and Electronics
- 2.3. Consumer Goods
- 2.4. Healthcare
- 2.5. Household and Industrial Appliances
- 2.6. Others
Polyetherimide Market Segmentation By Geography
-
1. Asia Pacific
- 1.1. China
- 1.2. India
- 1.3. Japan
- 1.4. South Korea
- 1.5. Southeast ASia
- 1.6. Australia
- 1.7. Rest of Asia Pacific
-
2. North America
- 2.1. United States
- 2.2. Canada
- 2.3. Mexico
-
3. Europe
- 3.1. Germany
- 3.2. United Kingdom
- 3.3. Italy
- 3.4. France
- 3.5. Spain
- 3.6. Rest of Europe
-
4. South America
- 4.1. Brazil
- 4.2. Argentina
- 4.3. Colombia
- 4.4. Rest of South America
-
5. Middle East and Africa
- 5.1. Saudi Arabia
- 5.2. South Africa
- 5.3. UAE
- 5.4. Rest of Middle East and Africa

Polyetherimide Market Regional Market Share
Geographic Coverage of Polyetherimide Market
Polyetherimide Market REPORT HIGHLIGHTS
| Aspects | Details |
|---|---|
| Study Period | 2020-2034 |
| Base Year | 2025 |
| Estimated Year | 2026 |
| Forecast Period | 2026-2034 |
| Historical Period | 2020-2025 |
| Growth Rate | CAGR of > 6.50% from 2020-2034 |
| Segmentation |
|
Table of Contents
- 1. Introduction
- 1.1. Research Scope
- 1.2. Market Segmentation
- 1.3. Research Objective
- 1.4. Definitions and Assumptions
- 2. Executive Summary
- 2.1. Market Snapshot
- 3. Market Dynamics
- 3.1. Market Drivers
- 3.2. Market Restrains
- 3.3. Market Trends
- 3.4. Market Opportunities
- 4. Market Factor Analysis
- 4.1. Porters Five Forces
- 4.1.1. Bargaining Power of Suppliers
- 4.1.2. Bargaining Power of Buyers
- 4.1.3. Threat of New Entrants
- 4.1.4. Threat of Substitutes
- 4.1.5. Competitive Rivalry
- 4.2. PESTEL analysis
- 4.3. BCG Analysis
- 4.3.1. Stars (High Growth, High Market Share)
- 4.3.2. Cash Cows (Low Growth, High Market Share)
- 4.3.3. Question Mark (High Growth, Low Market Share)
- 4.3.4. Dogs (Low Growth, Low Market Share)
- 4.4. Ansoff Matrix Analysis
- 4.5. Supply Chain Analysis
- 4.6. Regulatory Landscape
- 4.7. Current Market Potential and Opportunity Assessment (TAM–SAM–SOM Framework)
- 4.8. PRI Analyst Note
- 4.1. Porters Five Forces
- 5. Market Analysis, Insights and Forecast 2021-2033
- 5.1. Market Analysis, Insights and Forecast - by Grade
- 5.1.1. Reinforced
- 5.1.2. Unreinforced
- 5.2. Market Analysis, Insights and Forecast - by End-User Industry
- 5.2.1. Transportation
- 5.2.2. Electrical and Electronics
- 5.2.3. Consumer Goods
- 5.2.4. Healthcare
- 5.2.5. Household and Industrial Appliances
- 5.2.6. Others
- 5.3. Market Analysis, Insights and Forecast - by Region
- 5.3.1. Asia Pacific
- 5.3.2. North America
- 5.3.3. Europe
- 5.3.4. South America
- 5.3.5. Middle East and Africa
- 5.1. Market Analysis, Insights and Forecast - by Grade
- 6. Global Polyetherimide Market Analysis, Insights and Forecast, 2021-2033
- 6.1. Market Analysis, Insights and Forecast - by Grade
- 6.1.1. Reinforced
- 6.1.2. Unreinforced
- 6.2. Market Analysis, Insights and Forecast - by End-User Industry
- 6.2.1. Transportation
- 6.2.2. Electrical and Electronics
- 6.2.3. Consumer Goods
- 6.2.4. Healthcare
- 6.2.5. Household and Industrial Appliances
- 6.2.6. Others
- 6.1. Market Analysis, Insights and Forecast - by Grade
- 7. Asia Pacific Polyetherimide Market Analysis, Insights and Forecast, 2020-2032
- 7.1. Market Analysis, Insights and Forecast - by Grade
- 7.1.1. Reinforced
- 7.1.2. Unreinforced
- 7.2. Market Analysis, Insights and Forecast - by End-User Industry
- 7.2.1. Transportation
- 7.2.2. Electrical and Electronics
- 7.2.3. Consumer Goods
- 7.2.4. Healthcare
- 7.2.5. Household and Industrial Appliances
- 7.2.6. Others
- 7.1. Market Analysis, Insights and Forecast - by Grade
- 8. North America Polyetherimide Market Analysis, Insights and Forecast, 2020-2032
- 8.1. Market Analysis, Insights and Forecast - by Grade
- 8.1.1. Reinforced
- 8.1.2. Unreinforced
- 8.2. Market Analysis, Insights and Forecast - by End-User Industry
- 8.2.1. Transportation
- 8.2.2. Electrical and Electronics
- 8.2.3. Consumer Goods
- 8.2.4. Healthcare
- 8.2.5. Household and Industrial Appliances
- 8.2.6. Others
- 8.1. Market Analysis, Insights and Forecast - by Grade
- 9. Europe Polyetherimide Market Analysis, Insights and Forecast, 2020-2032
- 9.1. Market Analysis, Insights and Forecast - by Grade
- 9.1.1. Reinforced
- 9.1.2. Unreinforced
- 9.2. Market Analysis, Insights and Forecast - by End-User Industry
- 9.2.1. Transportation
- 9.2.2. Electrical and Electronics
- 9.2.3. Consumer Goods
- 9.2.4. Healthcare
- 9.2.5. Household and Industrial Appliances
- 9.2.6. Others
- 9.1. Market Analysis, Insights and Forecast - by Grade
- 10. South America Polyetherimide Market Analysis, Insights and Forecast, 2020-2032
- 10.1. Market Analysis, Insights and Forecast - by Grade
- 10.1.1. Reinforced
- 10.1.2. Unreinforced
- 10.2. Market Analysis, Insights and Forecast - by End-User Industry
- 10.2.1. Transportation
- 10.2.2. Electrical and Electronics
- 10.2.3. Consumer Goods
- 10.2.4. Healthcare
- 10.2.5. Household and Industrial Appliances
- 10.2.6. Others
- 10.1. Market Analysis, Insights and Forecast - by Grade
- 11. Middle East and Africa Polyetherimide Market Analysis, Insights and Forecast, 2020-2032
- 11.1. Market Analysis, Insights and Forecast - by Grade
- 11.1.1. Reinforced
- 11.1.2. Unreinforced
- 11.2. Market Analysis, Insights and Forecast - by End-User Industry
- 11.2.1. Transportation
- 11.2.2. Electrical and Electronics
- 11.2.3. Consumer Goods
- 11.2.4. Healthcare
- 11.2.5. Household and Industrial Appliances
- 11.2.6. Others
- 11.1. Market Analysis, Insights and Forecast - by Grade
- 12. Competitive Analysis
- 12.1. Company Profiles
- 12.1.1 Solvay
- 12.1.1.1. Company Overview
- 12.1.1.2. Products
- 12.1.1.3. Company Financials
- 12.1.1.4. SWOT Analysis
- 12.1.2 GEHR
- 12.1.2.1. Company Overview
- 12.1.2.2. Products
- 12.1.2.3. Company Financials
- 12.1.2.4. SWOT Analysis
- 12.1.3 Röchling SE & Co KG
- 12.1.3.1. Company Overview
- 12.1.3.2. Products
- 12.1.3.3. Company Financials
- 12.1.3.4. SWOT Analysis
- 12.1.4 Avient Corporation
- 12.1.4.1. Company Overview
- 12.1.4.2. Products
- 12.1.4.3. Company Financials
- 12.1.4.4. SWOT Analysis
- 12.1.5 Emco Industrial Plastics
- 12.1.5.1. Company Overview
- 12.1.5.2. Products
- 12.1.5.3. Company Financials
- 12.1.5.4. SWOT Analysis
- 12.1.6 SABIC
- 12.1.6.1. Company Overview
- 12.1.6.2. Products
- 12.1.6.3. Company Financials
- 12.1.6.4. SWOT Analysis
- 12.1.7 the Mitsubishi Chemical Group of companies
- 12.1.7.1. Company Overview
- 12.1.7.2. Products
- 12.1.7.3. Company Financials
- 12.1.7.4. SWOT Analysis
- 12.1.8 RTP Company
- 12.1.8.1. Company Overview
- 12.1.8.2. Products
- 12.1.8.3. Company Financials
- 12.1.8.4. SWOT Analysis
- 12.1.9 Kuraray Europe GmbH
- 12.1.9.1. Company Overview
- 12.1.9.2. Products
- 12.1.9.3. Company Financials
- 12.1.9.4. SWOT Analysis
- 12.1.10 Aikolon Oy
- 12.1.10.1. Company Overview
- 12.1.10.2. Products
- 12.1.10.3. Company Financials
- 12.1.10.4. SWOT Analysis
- 12.1.11 Ensinger
- 12.1.11.1. Company Overview
- 12.1.11.2. Products
- 12.1.11.3. Company Financials
- 12.1.11.4. SWOT Analysis
- 12.1.12 Eagle Performance Plastics Inc
- 12.1.12.1. Company Overview
- 12.1.12.2. Products
- 12.1.12.3. Company Financials
- 12.1.12.4. SWOT Analysis
- 12.1.1 Solvay
- 12.2. Market Entropy
- 12.2.1 Company's Key Areas Served
- 12.2.2 Recent Developments
- 12.3. Company Market Share Analysis 2025
- 12.3.1 Top 5 Companies Market Share Analysis
- 12.3.2 Top 3 Companies Market Share Analysis
- 12.4. List of Potential Customers
- 13. Research Methodology
List of Figures
- Figure 1: Global Polyetherimide Market Revenue Breakdown (Million, %) by Region 2025 & 2033
- Figure 2: Global Polyetherimide Market Volume Breakdown (K Tons, %) by Region 2025 & 2033
- Figure 3: Asia Pacific Polyetherimide Market Revenue (Million), by Grade 2025 & 2033
- Figure 4: Asia Pacific Polyetherimide Market Volume (K Tons), by Grade 2025 & 2033
- Figure 5: Asia Pacific Polyetherimide Market Revenue Share (%), by Grade 2025 & 2033
- Figure 6: Asia Pacific Polyetherimide Market Volume Share (%), by Grade 2025 & 2033
- Figure 7: Asia Pacific Polyetherimide Market Revenue (Million), by End-User Industry 2025 & 2033
- Figure 8: Asia Pacific Polyetherimide Market Volume (K Tons), by End-User Industry 2025 & 2033
- Figure 9: Asia Pacific Polyetherimide Market Revenue Share (%), by End-User Industry 2025 & 2033
- Figure 10: Asia Pacific Polyetherimide Market Volume Share (%), by End-User Industry 2025 & 2033
- Figure 11: Asia Pacific Polyetherimide Market Revenue (Million), by Country 2025 & 2033
- Figure 12: Asia Pacific Polyetherimide Market Volume (K Tons), by Country 2025 & 2033
- Figure 13: Asia Pacific Polyetherimide Market Revenue Share (%), by Country 2025 & 2033
- Figure 14: Asia Pacific Polyetherimide Market Volume Share (%), by Country 2025 & 2033
- Figure 15: North America Polyetherimide Market Revenue (Million), by Grade 2025 & 2033
- Figure 16: North America Polyetherimide Market Volume (K Tons), by Grade 2025 & 2033
- Figure 17: North America Polyetherimide Market Revenue Share (%), by Grade 2025 & 2033
- Figure 18: North America Polyetherimide Market Volume Share (%), by Grade 2025 & 2033
- Figure 19: North America Polyetherimide Market Revenue (Million), by End-User Industry 2025 & 2033
- Figure 20: North America Polyetherimide Market Volume (K Tons), by End-User Industry 2025 & 2033
- Figure 21: North America Polyetherimide Market Revenue Share (%), by End-User Industry 2025 & 2033
- Figure 22: North America Polyetherimide Market Volume Share (%), by End-User Industry 2025 & 2033
- Figure 23: North America Polyetherimide Market Revenue (Million), by Country 2025 & 2033
- Figure 24: North America Polyetherimide Market Volume (K Tons), by Country 2025 & 2033
- Figure 25: North America Polyetherimide Market Revenue Share (%), by Country 2025 & 2033
- Figure 26: North America Polyetherimide Market Volume Share (%), by Country 2025 & 2033
- Figure 27: Europe Polyetherimide Market Revenue (Million), by Grade 2025 & 2033
- Figure 28: Europe Polyetherimide Market Volume (K Tons), by Grade 2025 & 2033
- Figure 29: Europe Polyetherimide Market Revenue Share (%), by Grade 2025 & 2033
- Figure 30: Europe Polyetherimide Market Volume Share (%), by Grade 2025 & 2033
- Figure 31: Europe Polyetherimide Market Revenue (Million), by End-User Industry 2025 & 2033
- Figure 32: Europe Polyetherimide Market Volume (K Tons), by End-User Industry 2025 & 2033
- Figure 33: Europe Polyetherimide Market Revenue Share (%), by End-User Industry 2025 & 2033
- Figure 34: Europe Polyetherimide Market Volume Share (%), by End-User Industry 2025 & 2033
- Figure 35: Europe Polyetherimide Market Revenue (Million), by Country 2025 & 2033
- Figure 36: Europe Polyetherimide Market Volume (K Tons), by Country 2025 & 2033
- Figure 37: Europe Polyetherimide Market Revenue Share (%), by Country 2025 & 2033
- Figure 38: Europe Polyetherimide Market Volume Share (%), by Country 2025 & 2033
- Figure 39: South America Polyetherimide Market Revenue (Million), by Grade 2025 & 2033
- Figure 40: South America Polyetherimide Market Volume (K Tons), by Grade 2025 & 2033
- Figure 41: South America Polyetherimide Market Revenue Share (%), by Grade 2025 & 2033
- Figure 42: South America Polyetherimide Market Volume Share (%), by Grade 2025 & 2033
- Figure 43: South America Polyetherimide Market Revenue (Million), by End-User Industry 2025 & 2033
- Figure 44: South America Polyetherimide Market Volume (K Tons), by End-User Industry 2025 & 2033
- Figure 45: South America Polyetherimide Market Revenue Share (%), by End-User Industry 2025 & 2033
- Figure 46: South America Polyetherimide Market Volume Share (%), by End-User Industry 2025 & 2033
- Figure 47: South America Polyetherimide Market Revenue (Million), by Country 2025 & 2033
- Figure 48: South America Polyetherimide Market Volume (K Tons), by Country 2025 & 2033
- Figure 49: South America Polyetherimide Market Revenue Share (%), by Country 2025 & 2033
- Figure 50: South America Polyetherimide Market Volume Share (%), by Country 2025 & 2033
- Figure 51: Middle East and Africa Polyetherimide Market Revenue (Million), by Grade 2025 & 2033
- Figure 52: Middle East and Africa Polyetherimide Market Volume (K Tons), by Grade 2025 & 2033
- Figure 53: Middle East and Africa Polyetherimide Market Revenue Share (%), by Grade 2025 & 2033
- Figure 54: Middle East and Africa Polyetherimide Market Volume Share (%), by Grade 2025 & 2033
- Figure 55: Middle East and Africa Polyetherimide Market Revenue (Million), by End-User Industry 2025 & 2033
- Figure 56: Middle East and Africa Polyetherimide Market Volume (K Tons), by End-User Industry 2025 & 2033
- Figure 57: Middle East and Africa Polyetherimide Market Revenue Share (%), by End-User Industry 2025 & 2033
- Figure 58: Middle East and Africa Polyetherimide Market Volume Share (%), by End-User Industry 2025 & 2033
- Figure 59: Middle East and Africa Polyetherimide Market Revenue (Million), by Country 2025 & 2033
- Figure 60: Middle East and Africa Polyetherimide Market Volume (K Tons), by Country 2025 & 2033
- Figure 61: Middle East and Africa Polyetherimide Market Revenue Share (%), by Country 2025 & 2033
- Figure 62: Middle East and Africa Polyetherimide Market Volume Share (%), by Country 2025 & 2033
List of Tables
- Table 1: Global Polyetherimide Market Revenue Million Forecast, by Grade 2020 & 2033
- Table 2: Global Polyetherimide Market Volume K Tons Forecast, by Grade 2020 & 2033
- Table 3: Global Polyetherimide Market Revenue Million Forecast, by End-User Industry 2020 & 2033
- Table 4: Global Polyetherimide Market Volume K Tons Forecast, by End-User Industry 2020 & 2033
- Table 5: Global Polyetherimide Market Revenue Million Forecast, by Region 2020 & 2033
- Table 6: Global Polyetherimide Market Volume K Tons Forecast, by Region 2020 & 2033
- Table 7: Global Polyetherimide Market Revenue Million Forecast, by Grade 2020 & 2033
- Table 8: Global Polyetherimide Market Volume K Tons Forecast, by Grade 2020 & 2033
- Table 9: Global Polyetherimide Market Revenue Million Forecast, by End-User Industry 2020 & 2033
- Table 10: Global Polyetherimide Market Volume K Tons Forecast, by End-User Industry 2020 & 2033
- Table 11: Global Polyetherimide Market Revenue Million Forecast, by Country 2020 & 2033
- Table 12: Global Polyetherimide Market Volume K Tons Forecast, by Country 2020 & 2033
- Table 13: China Polyetherimide Market Revenue (Million) Forecast, by Application 2020 & 2033
- Table 14: China Polyetherimide Market Volume (K Tons) Forecast, by Application 2020 & 2033
- Table 15: India Polyetherimide Market Revenue (Million) Forecast, by Application 2020 & 2033
- Table 16: India Polyetherimide Market Volume (K Tons) Forecast, by Application 2020 & 2033
- Table 17: Japan Polyetherimide Market Revenue (Million) Forecast, by Application 2020 & 2033
- Table 18: Japan Polyetherimide Market Volume (K Tons) Forecast, by Application 2020 & 2033
- Table 19: South Korea Polyetherimide Market Revenue (Million) Forecast, by Application 2020 & 2033
- Table 20: South Korea Polyetherimide Market Volume (K Tons) Forecast, by Application 2020 & 2033
- Table 21: Southeast ASia Polyetherimide Market Revenue (Million) Forecast, by Application 2020 & 2033
- Table 22: Southeast ASia Polyetherimide Market Volume (K Tons) Forecast, by Application 2020 & 2033
- Table 23: Australia Polyetherimide Market Revenue (Million) Forecast, by Application 2020 & 2033
- Table 24: Australia Polyetherimide Market Volume (K Tons) Forecast, by Application 2020 & 2033
- Table 25: Rest of Asia Pacific Polyetherimide Market Revenue (Million) Forecast, by Application 2020 & 2033
- Table 26: Rest of Asia Pacific Polyetherimide Market Volume (K Tons) Forecast, by Application 2020 & 2033
- Table 27: Global Polyetherimide Market Revenue Million Forecast, by Grade 2020 & 2033
- Table 28: Global Polyetherimide Market Volume K Tons Forecast, by Grade 2020 & 2033
- Table 29: Global Polyetherimide Market Revenue Million Forecast, by End-User Industry 2020 & 2033
- Table 30: Global Polyetherimide Market Volume K Tons Forecast, by End-User Industry 2020 & 2033
- Table 31: Global Polyetherimide Market Revenue Million Forecast, by Country 2020 & 2033
- Table 32: Global Polyetherimide Market Volume K Tons Forecast, by Country 2020 & 2033
- Table 33: United States Polyetherimide Market Revenue (Million) Forecast, by Application 2020 & 2033
- Table 34: United States Polyetherimide Market Volume (K Tons) Forecast, by Application 2020 & 2033
- Table 35: Canada Polyetherimide Market Revenue (Million) Forecast, by Application 2020 & 2033
- Table 36: Canada Polyetherimide Market Volume (K Tons) Forecast, by Application 2020 & 2033
- Table 37: Mexico Polyetherimide Market Revenue (Million) Forecast, by Application 2020 & 2033
- Table 38: Mexico Polyetherimide Market Volume (K Tons) Forecast, by Application 2020 & 2033
- Table 39: Global Polyetherimide Market Revenue Million Forecast, by Grade 2020 & 2033
- Table 40: Global Polyetherimide Market Volume K Tons Forecast, by Grade 2020 & 2033
- Table 41: Global Polyetherimide Market Revenue Million Forecast, by End-User Industry 2020 & 2033
- Table 42: Global Polyetherimide Market Volume K Tons Forecast, by End-User Industry 2020 & 2033
- Table 43: Global Polyetherimide Market Revenue Million Forecast, by Country 2020 & 2033
- Table 44: Global Polyetherimide Market Volume K Tons Forecast, by Country 2020 & 2033
- Table 45: Germany Polyetherimide Market Revenue (Million) Forecast, by Application 2020 & 2033
- Table 46: Germany Polyetherimide Market Volume (K Tons) Forecast, by Application 2020 & 2033
- Table 47: United Kingdom Polyetherimide Market Revenue (Million) Forecast, by Application 2020 & 2033
- Table 48: United Kingdom Polyetherimide Market Volume (K Tons) Forecast, by Application 2020 & 2033
- Table 49: Italy Polyetherimide Market Revenue (Million) Forecast, by Application 2020 & 2033
- Table 50: Italy Polyetherimide Market Volume (K Tons) Forecast, by Application 2020 & 2033
- Table 51: France Polyetherimide Market Revenue (Million) Forecast, by Application 2020 & 2033
- Table 52: France Polyetherimide Market Volume (K Tons) Forecast, by Application 2020 & 2033
- Table 53: Spain Polyetherimide Market Revenue (Million) Forecast, by Application 2020 & 2033
- Table 54: Spain Polyetherimide Market Volume (K Tons) Forecast, by Application 2020 & 2033
- Table 55: Rest of Europe Polyetherimide Market Revenue (Million) Forecast, by Application 2020 & 2033
- Table 56: Rest of Europe Polyetherimide Market Volume (K Tons) Forecast, by Application 2020 & 2033
- Table 57: Global Polyetherimide Market Revenue Million Forecast, by Grade 2020 & 2033
- Table 58: Global Polyetherimide Market Volume K Tons Forecast, by Grade 2020 & 2033
- Table 59: Global Polyetherimide Market Revenue Million Forecast, by End-User Industry 2020 & 2033
- Table 60: Global Polyetherimide Market Volume K Tons Forecast, by End-User Industry 2020 & 2033
- Table 61: Global Polyetherimide Market Revenue Million Forecast, by Country 2020 & 2033
- Table 62: Global Polyetherimide Market Volume K Tons Forecast, by Country 2020 & 2033
- Table 63: Brazil Polyetherimide Market Revenue (Million) Forecast, by Application 2020 & 2033
- Table 64: Brazil Polyetherimide Market Volume (K Tons) Forecast, by Application 2020 & 2033
- Table 65: Argentina Polyetherimide Market Revenue (Million) Forecast, by Application 2020 & 2033
- Table 66: Argentina Polyetherimide Market Volume (K Tons) Forecast, by Application 2020 & 2033
- Table 67: Colombia Polyetherimide Market Revenue (Million) Forecast, by Application 2020 & 2033
- Table 68: Colombia Polyetherimide Market Volume (K Tons) Forecast, by Application 2020 & 2033
- Table 69: Rest of South America Polyetherimide Market Revenue (Million) Forecast, by Application 2020 & 2033
- Table 70: Rest of South America Polyetherimide Market Volume (K Tons) Forecast, by Application 2020 & 2033
- Table 71: Global Polyetherimide Market Revenue Million Forecast, by Grade 2020 & 2033
- Table 72: Global Polyetherimide Market Volume K Tons Forecast, by Grade 2020 & 2033
- Table 73: Global Polyetherimide Market Revenue Million Forecast, by End-User Industry 2020 & 2033
- Table 74: Global Polyetherimide Market Volume K Tons Forecast, by End-User Industry 2020 & 2033
- Table 75: Global Polyetherimide Market Revenue Million Forecast, by Country 2020 & 2033
- Table 76: Global Polyetherimide Market Volume K Tons Forecast, by Country 2020 & 2033
- Table 77: Saudi Arabia Polyetherimide Market Revenue (Million) Forecast, by Application 2020 & 2033
- Table 78: Saudi Arabia Polyetherimide Market Volume (K Tons) Forecast, by Application 2020 & 2033
- Table 79: South Africa Polyetherimide Market Revenue (Million) Forecast, by Application 2020 & 2033
- Table 80: South Africa Polyetherimide Market Volume (K Tons) Forecast, by Application 2020 & 2033
- Table 81: UAE Polyetherimide Market Revenue (Million) Forecast, by Application 2020 & 2033
- Table 82: UAE Polyetherimide Market Volume (K Tons) Forecast, by Application 2020 & 2033
- Table 83: Rest of Middle East and Africa Polyetherimide Market Revenue (Million) Forecast, by Application 2020 & 2033
- Table 84: Rest of Middle East and Africa Polyetherimide Market Volume (K Tons) Forecast, by Application 2020 & 2033
Frequently Asked Questions
1. What is the projected Compound Annual Growth Rate (CAGR) of the Polyetherimide Market?
The projected CAGR is approximately > 6.50%.
2. Which companies are prominent players in the Polyetherimide Market?
Key companies in the market include Solvay, GEHR, Röchling SE & Co KG, Avient Corporation, Emco Industrial Plastics, SABIC, the Mitsubishi Chemical Group of companies, RTP Company, Kuraray Europe GmbH, Aikolon Oy, Ensinger, Eagle Performance Plastics Inc.
3. What are the main segments of the Polyetherimide Market?
The market segments include Grade, End-User Industry.
4. Can you provide details about the market size?
The market size is estimated to be USD 663.10 Million as of 2022.
5. What are some drivers contributing to market growth?
Increasing Demand from the Transportation Industry; Rapid Growth in the Automotive Sector; Increasing Usage in Healthcare Sector.
6. What are the notable trends driving market growth?
Increasing demand from Electrical & Electronics Industry.
7. Are there any restraints impacting market growth?
High Price When Compared to the Conventional Polymers; Availability of Substitute Materials.
8. Can you provide examples of recent developments in the market?
N/A
9. What pricing options are available for accessing the report?
Pricing options include single-user, multi-user, and enterprise licenses priced at USD 4750, USD 5250, and USD 8750 respectively.
10. Is the market size provided in terms of value or volume?
The market size is provided in terms of value, measured in Million and volume, measured in K Tons.
11. Are there any specific market keywords associated with the report?
Yes, the market keyword associated with the report is "Polyetherimide Market," which aids in identifying and referencing the specific market segment covered.
12. How do I determine which pricing option suits my needs best?
The pricing options vary based on user requirements and access needs. Individual users may opt for single-user licenses, while businesses requiring broader access may choose multi-user or enterprise licenses for cost-effective access to the report.
13. Are there any additional resources or data provided in the Polyetherimide Market report?
While the report offers comprehensive insights, it's advisable to review the specific contents or supplementary materials provided to ascertain if additional resources or data are available.
14. How can I stay updated on further developments or reports in the Polyetherimide Market?
To stay informed about further developments, trends, and reports in the Polyetherimide Market, consider subscribing to industry newsletters, following relevant companies and organizations, or regularly checking reputable industry news sources and publications.
Methodology
Step 1 - Identification of Relevant Samples Size from Population Database


Step 2 - Approaches for Defining Global Market Size (Value, Volume* & Price*)

Note*: In applicable scenarios
Step 3 - Data Sources
Primary Research
- Web Analytics
- Survey Reports
- Research Institute
- Latest Research Reports
- Opinion Leaders
Secondary Research
- Annual Reports
- White Paper
- Latest Press Release
- Industry Association
- Paid Database
- Investor Presentations

Step 4 - Data Triangulation
Involves using different sources of information in order to increase the validity of a study
These sources are likely to be stakeholders in a program - participants, other researchers, program staff, other community members, and so on.
Then we put all data in single framework & apply various statistical tools to find out the dynamic on the market.
During the analysis stage, feedback from the stakeholder groups would be compared to determine areas of agreement as well as areas of divergence