

Key Insights
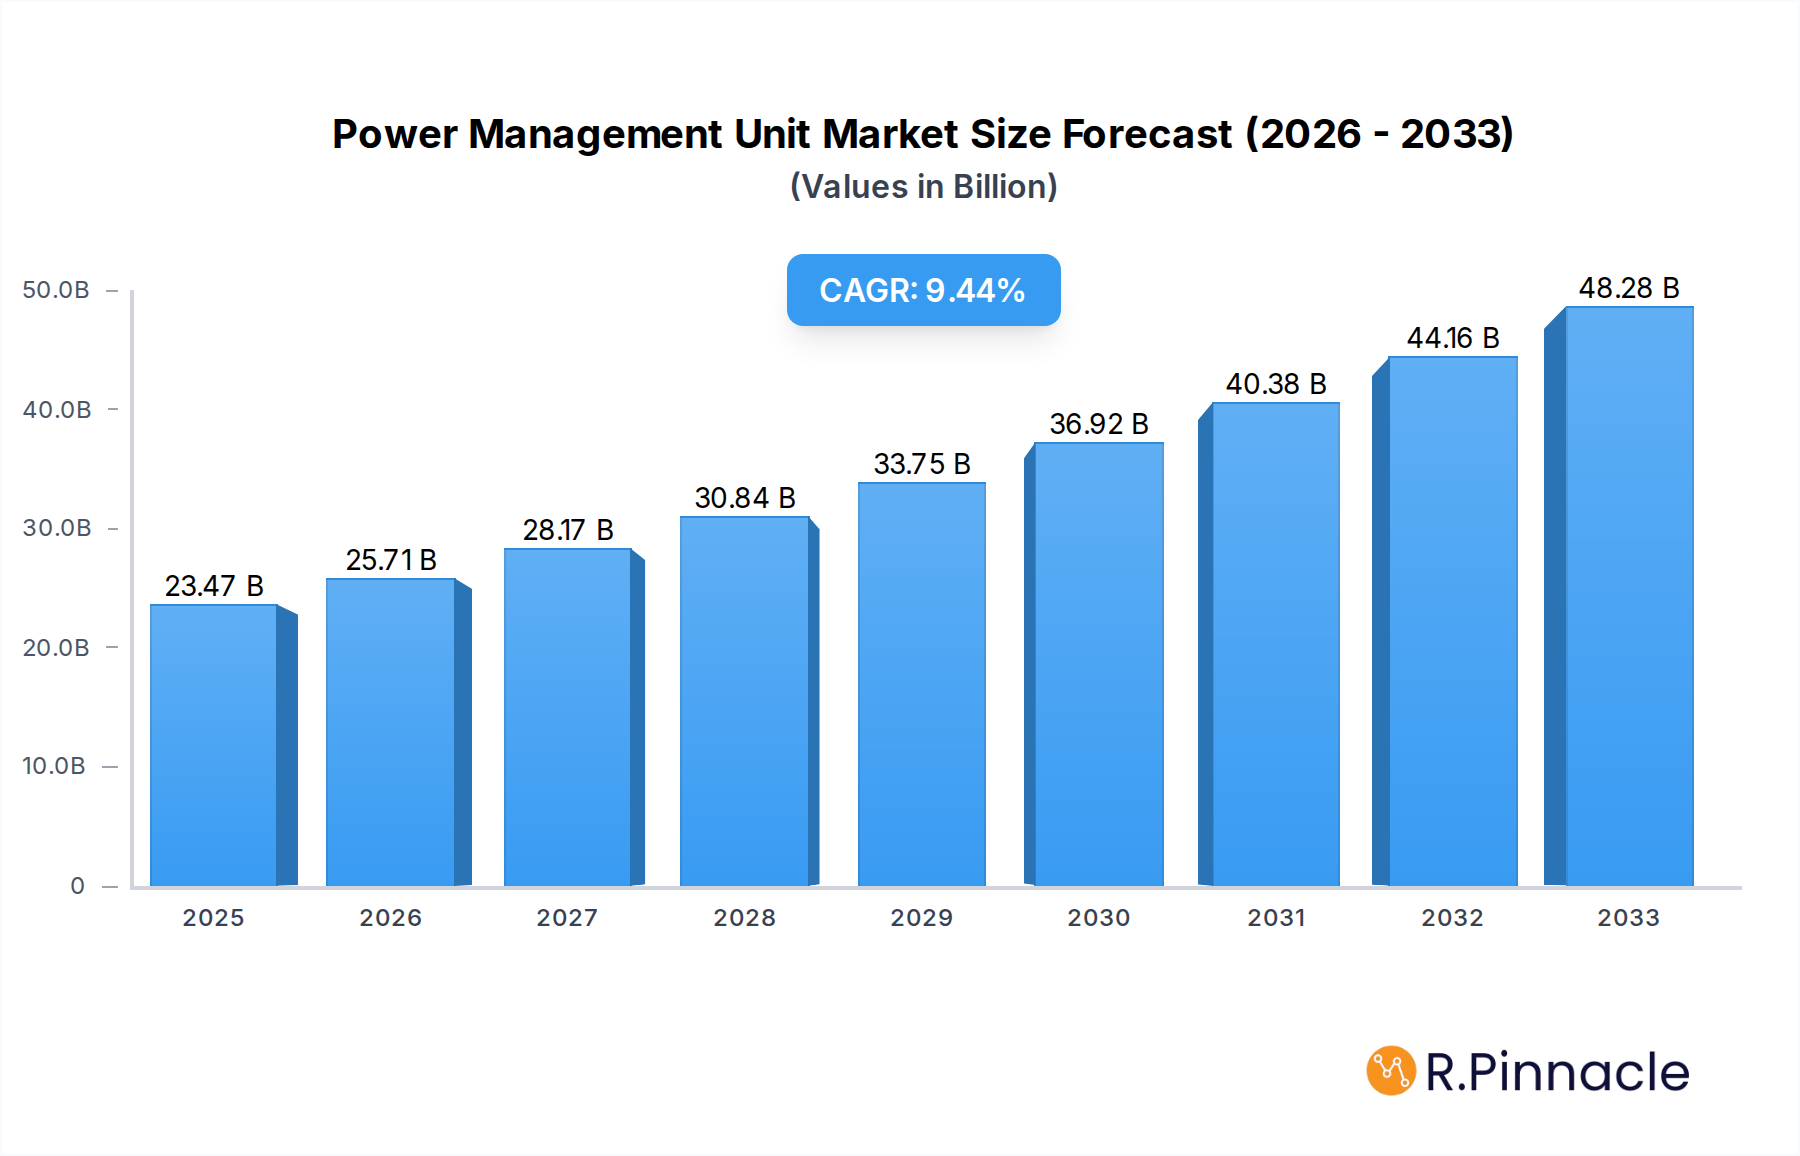
The global Power Management Unit (PMU) market is poised for significant expansion, projected to reach $23.47 billion in 2025. This robust growth is underpinned by a Compound Annual Growth Rate (CAGR) of 9.6% throughout the forecast period of 2025-2033. The burgeoning demand for sophisticated power solutions across a multitude of electronic devices is a primary driver, fueled by the relentless innovation in consumer electronics, automotive, and industrial sectors. The proliferation of smartphones, tablets, and wearables, all requiring efficient power management for extended battery life and optimal performance, significantly contributes to this upward trajectory. Furthermore, the increasing adoption of electric vehicles (EVs) and advanced driver-assistance systems (ADAS) in the automotive industry, alongside the growing complexity of smart home devices and industrial automation, creates a substantial appetite for advanced PMUs. These devices are essential for regulating voltage, managing power distribution, and ensuring the longevity and reliability of electronic components.

Power Management Unit Market Size (In Billion)
The market is segmented by application, with Mobile Phones and Computers representing the largest segments due to their widespread consumer adoption and rapid upgrade cycles. However, the Television and "Others" categories, which encompass emerging applications like IoT devices, medical equipment, and industrial machinery, are expected to exhibit strong growth potential. In terms of types, both Centralized and Distributed PMU architectures are witnessing advancements. Centralized PMUs offer simpler design and cost-effectiveness, while distributed PMUs provide greater flexibility and scalability, particularly in complex systems. Key companies like Texas Instruments, Analog Devices, and STMicroelectronics are at the forefront of innovation, developing cutting-edge PMU solutions that enhance energy efficiency, reduce form factors, and improve thermal management. The competitive landscape is characterized by ongoing research and development, strategic partnerships, and product differentiation aimed at capturing market share in this dynamic and evolving industry.
Power Management Unit Company Market Share
Power Management Unit Market: Comprehensive Industry Analysis and Future Projections (2019–2033)
This in-depth report offers a detailed examination of the global Power Management Unit (PMU) market, encompassing market structure, dynamics, regional dominance, product innovations, and future outlook. Covering the study period from 2019 to 2033, with a base year of 2025, this analysis provides actionable insights for industry professionals, investors, and stakeholders navigating the evolving PMU landscape. We explore key segments, growth drivers, challenges, and emerging opportunities, supported by extensive data and expert analysis.
Power Management Unit Market Structure & Innovation Trends
The Power Management Unit (PMU) market exhibits a moderately consolidated structure, with key players like Texas Instruments, NXP Semiconductors, and STMicroelectronics holding significant market shares, estimated to be in the hundreds of billions USD globally. Innovation is a primary driver, fueled by the relentless demand for increased power efficiency and miniaturization across consumer electronics, telecommunications, and automotive sectors. Regulatory frameworks, particularly concerning energy efficiency standards and environmental impact, are progressively shaping product development and market entry strategies. The emergence of advanced semiconductor technologies and novel battery chemistries presents both opportunities and challenges, influencing the adoption of new PMU architectures. Product substitutes, while present in niche applications, are largely outpaced by the specialized functionality and integration offered by dedicated PMUs. End-user demographics are increasingly sophisticated, demanding longer battery life, faster charging, and seamless integration into smart, connected devices. Mergers and acquisitions (M&A) activity is a consistent feature, with estimated deal values reaching billions USD annually, as larger companies seek to acquire innovative technologies and expand their product portfolios.
- Market Concentration: Moderate, with top players holding substantial market share.
- Innovation Drivers: Energy efficiency, miniaturization, IoT integration, advanced battery technologies.
- Regulatory Frameworks: Energy efficiency standards (e.g., Energy Star, EU Directives), environmental regulations.
- Product Substitutes: General-purpose voltage regulators, basic power switching ICs (limited in advanced applications).
- End-User Demographics: Tech-savvy consumers, enterprise users requiring reliable and efficient power.
- M&A Activities: Frequent, driven by technology acquisition and market consolidation.
Power Management Unit Market Dynamics & Trends
The global Power Management Unit (PMU) market is experiencing robust growth, propelled by several interconnected dynamics and trends. The ever-increasing proliferation of portable electronic devices, including smartphones, wearables, and laptops, constitutes a primary growth driver. Consumers demand longer battery life and faster charging capabilities, creating a continuous need for advanced PMU solutions that optimize power consumption and thermal management. The burgeoning Internet of Things (IoT) ecosystem further fuels this demand, with billions of connected devices requiring efficient power management for continuous operation. Technological disruptions, such as the advent of advanced semiconductor manufacturing processes (e.g., FinFET technology), enabling smaller, more powerful, and energy-efficient PMUs, are reshaping the competitive landscape. The shift towards electric vehicles (EVs) and hybrid electric vehicles (HEVs) is another significant growth catalyst, as these vehicles incorporate complex power management systems for their batteries, charging, and onboard electronics. Consumer preferences are leaning towards devices with extended battery life, reduced heat generation, and faster charging speeds, directly influencing the design and features of PMUs. Competitive dynamics are characterized by intense innovation, strategic partnerships, and a focus on cost optimization. Key players are continuously investing in research and development to offer differentiated products that meet stringent performance and efficiency requirements. Market penetration is expected to deepen across emerging economies as access to advanced electronics and electric mobility solutions expands. The forecast anticipates a Compound Annual Growth Rate (CAGR) of approximately 8-10% for the PMU market over the forecast period, driven by these powerful underlying trends.
Dominant Regions & Segments in Power Management Unit
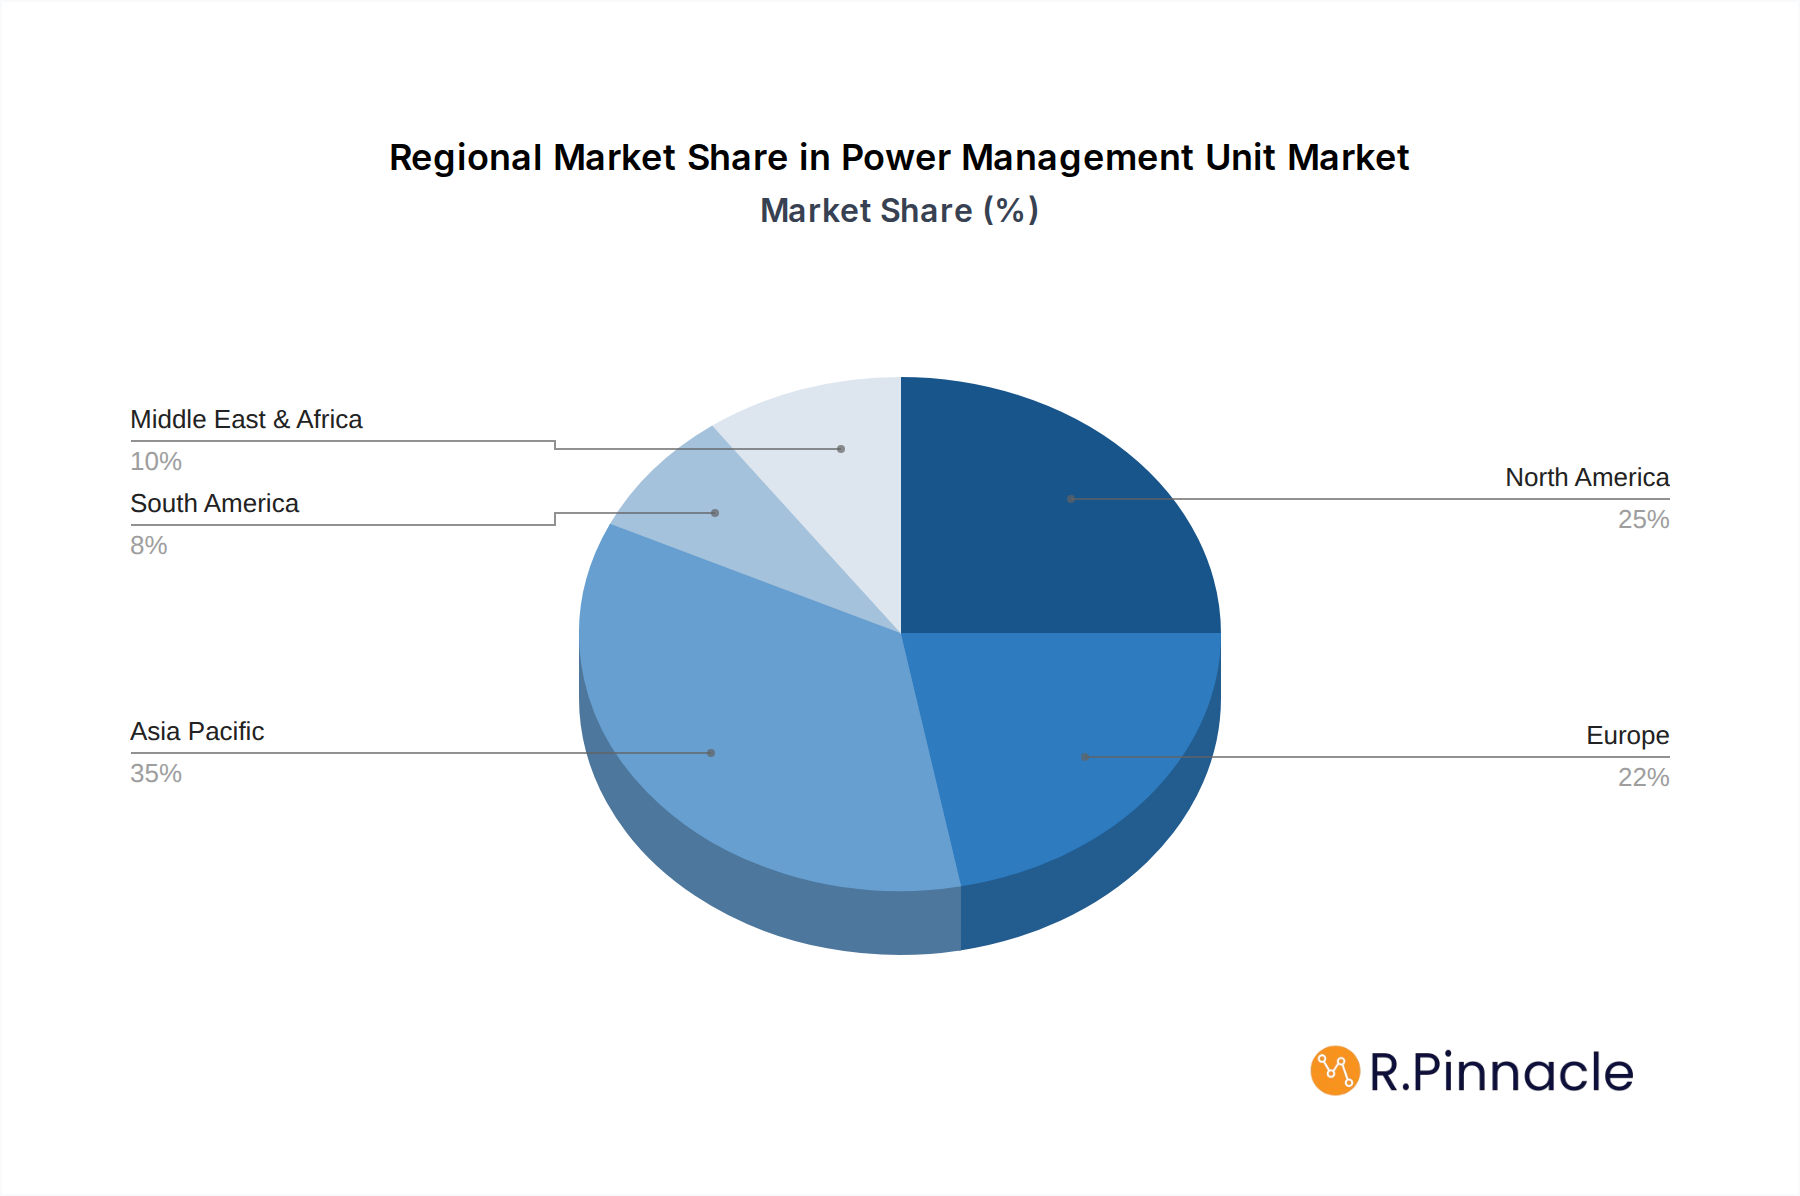
Asia-Pacific stands as the dominant region in the Power Management Unit (PMU) market, driven by its robust manufacturing capabilities, a massive consumer electronics market, and rapid adoption of advanced technologies. Within this region, China, South Korea, and Taiwan are pivotal countries, hosting major electronics manufacturers and a substantial base of component suppliers. The economic policies supporting high-tech manufacturing and significant investments in research and development further solidify Asia-Pacific's leadership.
In terms of applications, the Mobile Phone segment holds the largest market share and exhibits strong growth. This dominance is attributed to the sheer volume of smartphone production globally and the continuous demand for power-efficient and feature-rich devices. The increasing complexity of mobile devices, with multiple processors, sensors, and displays, necessitates sophisticated PMU solutions to manage power effectively and extend battery life.
The Computer segment, encompassing laptops, desktops, and servers, also represents a significant market for PMUs. The growing trend of remote work and the demand for high-performance computing power continue to drive the need for efficient power management in these devices.
The Centralized PMU type is currently dominant, offering a unified approach to power distribution and management within a system. However, the Distributed PMU architecture is gaining traction, particularly in complex systems where localized power management offers advantages in terms of flexibility, efficiency, and modularity. This trend is fueled by the increasing modularity and complexity of modern electronic systems.
- Leading Region: Asia-Pacific.
- Key Drivers: Strong manufacturing base, massive consumer electronics market, rapid technological adoption, supportive government policies, R&D investments.
- Dominant Countries: China, South Korea, Taiwan, Japan.
- Dominant Application Segment: Mobile Phone.
- Key Drivers: High production volumes, demand for longer battery life, device complexity, integration of advanced features.
- Significant Application Segment: Computer.
- Key Drivers: Growth in laptops and desktops, demand for high-performance computing, remote work trends.
- Dominant PMU Type: Centralized.
- Key Drivers: Simplicity in design and implementation for many applications.
- Emerging PMU Type: Distributed.
- Key Drivers: System complexity, need for localized control, improved efficiency, modular design advantages.
Power Management Unit Product Innovations
Product innovations in the Power Management Unit (PMU) sector are primarily focused on enhancing energy efficiency, reducing form factors, and improving thermal management. Key developments include the integration of advanced digital control techniques, enabling more precise power delivery and dynamic voltage and frequency scaling (DVFS). Ultra-low quiescent current designs are crucial for extending battery life in always-on devices, a critical trend in the IoT and wearable markets. Furthermore, the integration of multiple power rails and functionalities into single-chip solutions streamlines system design and reduces bill-of-materials costs. These innovations offer a significant competitive advantage by meeting the growing demand for smaller, more powerful, and energy-conscious electronic devices.
Report Scope & Segmentation Analysis
This report delves into the global Power Management Unit (PMU) market, segmenting it by Application and Type. The Application segment includes Mobile Phone, Computer, Television, and Others, while the Type segment comprises Centralized and Distributed architectures. This comprehensive segmentation allows for a granular analysis of market trends, growth projections, and competitive dynamics within each specific category. We will provide detailed market sizes and growth forecasts for each segment, highlighting the key factors influencing their performance.
- Application: Mobile Phone: This segment is projected to exhibit strong growth due to high device penetration and continuous demand for advanced power solutions.
- Application: Computer: Continued demand for laptops and desktops, coupled with the increasing power requirements of high-performance computing, will drive growth.
- Application: Television: The evolution of smart TVs and display technologies will influence power management needs in this segment.
- Application: Others: This broad category encompasses automotive, industrial, medical devices, and consumer electronics, representing diverse growth opportunities.
- Type: Centralized: While a mature segment, it continues to be crucial for many applications requiring a unified power management approach.
- Type: Distributed: This segment is poised for significant growth as system complexity increases, offering greater flexibility and efficiency.
Key Drivers of Power Management Unit Growth
The Power Management Unit (PMU) market is propelled by several key drivers, primarily stemming from technological advancements and evolving consumer demands. The relentless miniaturization of electronic devices necessitates smaller and more integrated PMUs. The exponential growth of the Internet of Things (IoT) ecosystem, with billions of connected devices requiring efficient power solutions, is a major catalyst. Furthermore, the electrification of transportation, particularly the burgeoning electric vehicle (EV) market, presents substantial growth opportunities for advanced PMU solutions to manage high-voltage battery systems and onboard power distribution. Regulatory mandates for energy efficiency are also pushing manufacturers to adopt more sophisticated PMUs, reducing energy waste and improving overall system performance.
Challenges in the Power Management Unit Sector
The Power Management Unit (PMU) sector faces several challenges that can impede growth and market penetration. Intense competition among established players and emerging startups can lead to price erosion and pressure on profit margins. Supply chain disruptions, as witnessed in recent years, can impact the availability of critical components and affect production timelines, leading to significant financial losses. The rapid pace of technological evolution requires continuous and substantial investment in research and development to stay competitive, posing a barrier for smaller companies. Evolving and stringent regulatory requirements for energy efficiency and environmental compliance add complexity and necessitate ongoing adaptation of product designs.
Emerging Opportunities in Power Management Unit
Emerging opportunities in the Power Management Unit (PMU) market are abundant, driven by technological innovation and evolving market needs. The rapid expansion of the 5G infrastructure and the associated increase in mobile data traffic create a demand for highly efficient power management in base stations and mobile devices. The growing adoption of renewable energy sources, such as solar and wind power, requires advanced PMUs for efficient energy storage and conversion in grid-tied and off-grid systems. The burgeoning field of artificial intelligence (AI) and machine learning (ML) applications, particularly in edge computing devices, necessitates specialized PMUs capable of handling variable and high-power demands. Furthermore, the increasing focus on sustainable and green electronics presents opportunities for PMU manufacturers to develop eco-friendly and energy-saving solutions.
Leading Players in the Power Management Unit Market
- Texas Instruments
- Ams AG
- NXP Semiconductors
- Nordic Semiconductor
- Leonardo DRS
- STMicroelectronics
- Analog Devices
- Onsemi
- Atmel
- Microchip Technology
- Qorvo
- Electro Standards Laboratories
- Rockchip
Key Developments in Power Management Unit Industry
- 2023/Q4: Introduction of next-generation ultra-low quiescent current PMICs for IoT devices, extending battery life by xx%.
- 2024/Q1: Significant advancements in Gallium Nitride (GaN) based power transistors integrated into PMU designs, enabling higher efficiency and smaller form factors.
- 2024/Q2: Major players announce strategic partnerships to develop advanced PMU solutions for emerging electric vehicle charging infrastructure.
- 2024/Q3: Launch of highly integrated, multi-output PMUs for advanced smartphone architectures, simplifying system design and reducing component count.
- 2024/Q4: Increased M&A activity focused on acquiring specialized IP in advanced battery management systems for renewable energy storage.
- 2025/Q1: Release of new PMUs optimized for AI/ML workloads at the edge, providing robust power delivery for demanding computational tasks.
Future Outlook for Power Management Unit Market
The future outlook for the Power Management Unit (PMU) market is exceptionally promising, characterized by sustained high growth and continuous innovation. The accelerating adoption of electric vehicles, the pervasive expansion of the Internet of Things (IoT), and the ongoing evolution of mobile and computing technologies will continue to be primary growth accelerators. The increasing demand for higher energy efficiency, driven by both regulatory pressures and consumer awareness, will push the boundaries of PMU technology. The integration of advanced features such as AI-powered power optimization and enhanced thermal management will become standard. Emerging markets in developing economies represent significant untapped potential. Strategic investments in research and development, coupled with strategic collaborations and acquisitions, will be crucial for companies to capitalize on the vast future market potential and maintain a competitive edge.
Power Management Unit Segmentation
-
1. Application
- 1.1. Mobile Phone
- 1.2. Computer
- 1.3. Television
- 1.4. Others
-
2. Types
- 2.1. Centralized
- 2.2. Distributed
Power Management Unit Segmentation By Geography
-
1. North America
- 1.1. United States
- 1.2. Canada
- 1.3. Mexico
-
2. South America
- 2.1. Brazil
- 2.2. Argentina
- 2.3. Rest of South America
-
3. Europe
- 3.1. United Kingdom
- 3.2. Germany
- 3.3. France
- 3.4. Italy
- 3.5. Spain
- 3.6. Russia
- 3.7. Benelux
- 3.8. Nordics
- 3.9. Rest of Europe
-
4. Middle East & Africa
- 4.1. Turkey
- 4.2. Israel
- 4.3. GCC
- 4.4. North Africa
- 4.5. South Africa
- 4.6. Rest of Middle East & Africa
-
5. Asia Pacific
- 5.1. China
- 5.2. India
- 5.3. Japan
- 5.4. South Korea
- 5.5. ASEAN
- 5.6. Oceania
- 5.7. Rest of Asia Pacific
Power Management Unit Regional Market Share
Geographic Coverage of Power Management Unit
Power Management Unit REPORT HIGHLIGHTS
| Aspects | Details |
|---|---|
| Study Period | 2020-2034 |
| Base Year | 2025 |
| Estimated Year | 2026 |
| Forecast Period | 2026-2034 |
| Historical Period | 2020-2025 |
| Growth Rate | CAGR of 9.6% from 2020-2034 |
| Segmentation |
|
Table of Contents
- 1. Introduction
- 1.1. Research Scope
- 1.2. Market Segmentation
- 1.3. Research Methodology
- 1.4. Definitions and Assumptions
- 2. Executive Summary
- 2.1. Introduction
- 3. Market Dynamics
- 3.1. Introduction
- 3.2. Market Drivers
- 3.3. Market Restrains
- 3.4. Market Trends
- 4. Market Factor Analysis
- 4.1. Porters Five Forces
- 4.2. Supply/Value Chain
- 4.3. PESTEL analysis
- 4.4. Market Entropy
- 4.5. Patent/Trademark Analysis
- 5. Global Power Management Unit Analysis, Insights and Forecast, 2020-2032
- 5.1. Market Analysis, Insights and Forecast - by Application
- 5.1.1. Mobile Phone
- 5.1.2. Computer
- 5.1.3. Television
- 5.1.4. Others
- 5.2. Market Analysis, Insights and Forecast - by Types
- 5.2.1. Centralized
- 5.2.2. Distributed
- 5.3. Market Analysis, Insights and Forecast - by Region
- 5.3.1. North America
- 5.3.2. South America
- 5.3.3. Europe
- 5.3.4. Middle East & Africa
- 5.3.5. Asia Pacific
- 5.1. Market Analysis, Insights and Forecast - by Application
- 6. North America Power Management Unit Analysis, Insights and Forecast, 2020-2032
- 6.1. Market Analysis, Insights and Forecast - by Application
- 6.1.1. Mobile Phone
- 6.1.2. Computer
- 6.1.3. Television
- 6.1.4. Others
- 6.2. Market Analysis, Insights and Forecast - by Types
- 6.2.1. Centralized
- 6.2.2. Distributed
- 6.1. Market Analysis, Insights and Forecast - by Application
- 7. South America Power Management Unit Analysis, Insights and Forecast, 2020-2032
- 7.1. Market Analysis, Insights and Forecast - by Application
- 7.1.1. Mobile Phone
- 7.1.2. Computer
- 7.1.3. Television
- 7.1.4. Others
- 7.2. Market Analysis, Insights and Forecast - by Types
- 7.2.1. Centralized
- 7.2.2. Distributed
- 7.1. Market Analysis, Insights and Forecast - by Application
- 8. Europe Power Management Unit Analysis, Insights and Forecast, 2020-2032
- 8.1. Market Analysis, Insights and Forecast - by Application
- 8.1.1. Mobile Phone
- 8.1.2. Computer
- 8.1.3. Television
- 8.1.4. Others
- 8.2. Market Analysis, Insights and Forecast - by Types
- 8.2.1. Centralized
- 8.2.2. Distributed
- 8.1. Market Analysis, Insights and Forecast - by Application
- 9. Middle East & Africa Power Management Unit Analysis, Insights and Forecast, 2020-2032
- 9.1. Market Analysis, Insights and Forecast - by Application
- 9.1.1. Mobile Phone
- 9.1.2. Computer
- 9.1.3. Television
- 9.1.4. Others
- 9.2. Market Analysis, Insights and Forecast - by Types
- 9.2.1. Centralized
- 9.2.2. Distributed
- 9.1. Market Analysis, Insights and Forecast - by Application
- 10. Asia Pacific Power Management Unit Analysis, Insights and Forecast, 2020-2032
- 10.1. Market Analysis, Insights and Forecast - by Application
- 10.1.1. Mobile Phone
- 10.1.2. Computer
- 10.1.3. Television
- 10.1.4. Others
- 10.2. Market Analysis, Insights and Forecast - by Types
- 10.2.1. Centralized
- 10.2.2. Distributed
- 10.1. Market Analysis, Insights and Forecast - by Application
- 11. Competitive Analysis
- 11.1. Global Market Share Analysis 2025
- 11.2. Company Profiles
- 11.2.1 Texas Instruments
- 11.2.1.1. Overview
- 11.2.1.2. Products
- 11.2.1.3. SWOT Analysis
- 11.2.1.4. Recent Developments
- 11.2.1.5. Financials (Based on Availability)
- 11.2.2 Ams AG
- 11.2.2.1. Overview
- 11.2.2.2. Products
- 11.2.2.3. SWOT Analysis
- 11.2.2.4. Recent Developments
- 11.2.2.5. Financials (Based on Availability)
- 11.2.3 NXP Semiconductors
- 11.2.3.1. Overview
- 11.2.3.2. Products
- 11.2.3.3. SWOT Analysis
- 11.2.3.4. Recent Developments
- 11.2.3.5. Financials (Based on Availability)
- 11.2.4 Nordic Semiconductor
- 11.2.4.1. Overview
- 11.2.4.2. Products
- 11.2.4.3. SWOT Analysis
- 11.2.4.4. Recent Developments
- 11.2.4.5. Financials (Based on Availability)
- 11.2.5 Leonardo DRS
- 11.2.5.1. Overview
- 11.2.5.2. Products
- 11.2.5.3. SWOT Analysis
- 11.2.5.4. Recent Developments
- 11.2.5.5. Financials (Based on Availability)
- 11.2.6 STMicroelectronics
- 11.2.6.1. Overview
- 11.2.6.2. Products
- 11.2.6.3. SWOT Analysis
- 11.2.6.4. Recent Developments
- 11.2.6.5. Financials (Based on Availability)
- 11.2.7 Analog Devices
- 11.2.7.1. Overview
- 11.2.7.2. Products
- 11.2.7.3. SWOT Analysis
- 11.2.7.4. Recent Developments
- 11.2.7.5. Financials (Based on Availability)
- 11.2.8 Onsemi
- 11.2.8.1. Overview
- 11.2.8.2. Products
- 11.2.8.3. SWOT Analysis
- 11.2.8.4. Recent Developments
- 11.2.8.5. Financials (Based on Availability)
- 11.2.9 Atmel
- 11.2.9.1. Overview
- 11.2.9.2. Products
- 11.2.9.3. SWOT Analysis
- 11.2.9.4. Recent Developments
- 11.2.9.5. Financials (Based on Availability)
- 11.2.10 Microchip Technology
- 11.2.10.1. Overview
- 11.2.10.2. Products
- 11.2.10.3. SWOT Analysis
- 11.2.10.4. Recent Developments
- 11.2.10.5. Financials (Based on Availability)
- 11.2.11 Qorvo
- 11.2.11.1. Overview
- 11.2.11.2. Products
- 11.2.11.3. SWOT Analysis
- 11.2.11.4. Recent Developments
- 11.2.11.5. Financials (Based on Availability)
- 11.2.12 Electro Standards Laboratories
- 11.2.12.1. Overview
- 11.2.12.2. Products
- 11.2.12.3. SWOT Analysis
- 11.2.12.4. Recent Developments
- 11.2.12.5. Financials (Based on Availability)
- 11.2.13 Rockchip
- 11.2.13.1. Overview
- 11.2.13.2. Products
- 11.2.13.3. SWOT Analysis
- 11.2.13.4. Recent Developments
- 11.2.13.5. Financials (Based on Availability)
- 11.2.1 Texas Instruments
List of Figures
- Figure 1: Global Power Management Unit Revenue Breakdown (billion, %) by Region 2025 & 2033
- Figure 2: North America Power Management Unit Revenue (billion), by Application 2025 & 2033
- Figure 3: North America Power Management Unit Revenue Share (%), by Application 2025 & 2033
- Figure 4: North America Power Management Unit Revenue (billion), by Types 2025 & 2033
- Figure 5: North America Power Management Unit Revenue Share (%), by Types 2025 & 2033
- Figure 6: North America Power Management Unit Revenue (billion), by Country 2025 & 2033
- Figure 7: North America Power Management Unit Revenue Share (%), by Country 2025 & 2033
- Figure 8: South America Power Management Unit Revenue (billion), by Application 2025 & 2033
- Figure 9: South America Power Management Unit Revenue Share (%), by Application 2025 & 2033
- Figure 10: South America Power Management Unit Revenue (billion), by Types 2025 & 2033
- Figure 11: South America Power Management Unit Revenue Share (%), by Types 2025 & 2033
- Figure 12: South America Power Management Unit Revenue (billion), by Country 2025 & 2033
- Figure 13: South America Power Management Unit Revenue Share (%), by Country 2025 & 2033
- Figure 14: Europe Power Management Unit Revenue (billion), by Application 2025 & 2033
- Figure 15: Europe Power Management Unit Revenue Share (%), by Application 2025 & 2033
- Figure 16: Europe Power Management Unit Revenue (billion), by Types 2025 & 2033
- Figure 17: Europe Power Management Unit Revenue Share (%), by Types 2025 & 2033
- Figure 18: Europe Power Management Unit Revenue (billion), by Country 2025 & 2033
- Figure 19: Europe Power Management Unit Revenue Share (%), by Country 2025 & 2033
- Figure 20: Middle East & Africa Power Management Unit Revenue (billion), by Application 2025 & 2033
- Figure 21: Middle East & Africa Power Management Unit Revenue Share (%), by Application 2025 & 2033
- Figure 22: Middle East & Africa Power Management Unit Revenue (billion), by Types 2025 & 2033
- Figure 23: Middle East & Africa Power Management Unit Revenue Share (%), by Types 2025 & 2033
- Figure 24: Middle East & Africa Power Management Unit Revenue (billion), by Country 2025 & 2033
- Figure 25: Middle East & Africa Power Management Unit Revenue Share (%), by Country 2025 & 2033
- Figure 26: Asia Pacific Power Management Unit Revenue (billion), by Application 2025 & 2033
- Figure 27: Asia Pacific Power Management Unit Revenue Share (%), by Application 2025 & 2033
- Figure 28: Asia Pacific Power Management Unit Revenue (billion), by Types 2025 & 2033
- Figure 29: Asia Pacific Power Management Unit Revenue Share (%), by Types 2025 & 2033
- Figure 30: Asia Pacific Power Management Unit Revenue (billion), by Country 2025 & 2033
- Figure 31: Asia Pacific Power Management Unit Revenue Share (%), by Country 2025 & 2033
List of Tables
- Table 1: Global Power Management Unit Revenue billion Forecast, by Application 2020 & 2033
- Table 2: Global Power Management Unit Revenue billion Forecast, by Types 2020 & 2033
- Table 3: Global Power Management Unit Revenue billion Forecast, by Region 2020 & 2033
- Table 4: Global Power Management Unit Revenue billion Forecast, by Application 2020 & 2033
- Table 5: Global Power Management Unit Revenue billion Forecast, by Types 2020 & 2033
- Table 6: Global Power Management Unit Revenue billion Forecast, by Country 2020 & 2033
- Table 7: United States Power Management Unit Revenue (billion) Forecast, by Application 2020 & 2033
- Table 8: Canada Power Management Unit Revenue (billion) Forecast, by Application 2020 & 2033
- Table 9: Mexico Power Management Unit Revenue (billion) Forecast, by Application 2020 & 2033
- Table 10: Global Power Management Unit Revenue billion Forecast, by Application 2020 & 2033
- Table 11: Global Power Management Unit Revenue billion Forecast, by Types 2020 & 2033
- Table 12: Global Power Management Unit Revenue billion Forecast, by Country 2020 & 2033
- Table 13: Brazil Power Management Unit Revenue (billion) Forecast, by Application 2020 & 2033
- Table 14: Argentina Power Management Unit Revenue (billion) Forecast, by Application 2020 & 2033
- Table 15: Rest of South America Power Management Unit Revenue (billion) Forecast, by Application 2020 & 2033
- Table 16: Global Power Management Unit Revenue billion Forecast, by Application 2020 & 2033
- Table 17: Global Power Management Unit Revenue billion Forecast, by Types 2020 & 2033
- Table 18: Global Power Management Unit Revenue billion Forecast, by Country 2020 & 2033
- Table 19: United Kingdom Power Management Unit Revenue (billion) Forecast, by Application 2020 & 2033
- Table 20: Germany Power Management Unit Revenue (billion) Forecast, by Application 2020 & 2033
- Table 21: France Power Management Unit Revenue (billion) Forecast, by Application 2020 & 2033
- Table 22: Italy Power Management Unit Revenue (billion) Forecast, by Application 2020 & 2033
- Table 23: Spain Power Management Unit Revenue (billion) Forecast, by Application 2020 & 2033
- Table 24: Russia Power Management Unit Revenue (billion) Forecast, by Application 2020 & 2033
- Table 25: Benelux Power Management Unit Revenue (billion) Forecast, by Application 2020 & 2033
- Table 26: Nordics Power Management Unit Revenue (billion) Forecast, by Application 2020 & 2033
- Table 27: Rest of Europe Power Management Unit Revenue (billion) Forecast, by Application 2020 & 2033
- Table 28: Global Power Management Unit Revenue billion Forecast, by Application 2020 & 2033
- Table 29: Global Power Management Unit Revenue billion Forecast, by Types 2020 & 2033
- Table 30: Global Power Management Unit Revenue billion Forecast, by Country 2020 & 2033
- Table 31: Turkey Power Management Unit Revenue (billion) Forecast, by Application 2020 & 2033
- Table 32: Israel Power Management Unit Revenue (billion) Forecast, by Application 2020 & 2033
- Table 33: GCC Power Management Unit Revenue (billion) Forecast, by Application 2020 & 2033
- Table 34: North Africa Power Management Unit Revenue (billion) Forecast, by Application 2020 & 2033
- Table 35: South Africa Power Management Unit Revenue (billion) Forecast, by Application 2020 & 2033
- Table 36: Rest of Middle East & Africa Power Management Unit Revenue (billion) Forecast, by Application 2020 & 2033
- Table 37: Global Power Management Unit Revenue billion Forecast, by Application 2020 & 2033
- Table 38: Global Power Management Unit Revenue billion Forecast, by Types 2020 & 2033
- Table 39: Global Power Management Unit Revenue billion Forecast, by Country 2020 & 2033
- Table 40: China Power Management Unit Revenue (billion) Forecast, by Application 2020 & 2033
- Table 41: India Power Management Unit Revenue (billion) Forecast, by Application 2020 & 2033
- Table 42: Japan Power Management Unit Revenue (billion) Forecast, by Application 2020 & 2033
- Table 43: South Korea Power Management Unit Revenue (billion) Forecast, by Application 2020 & 2033
- Table 44: ASEAN Power Management Unit Revenue (billion) Forecast, by Application 2020 & 2033
- Table 45: Oceania Power Management Unit Revenue (billion) Forecast, by Application 2020 & 2033
- Table 46: Rest of Asia Pacific Power Management Unit Revenue (billion) Forecast, by Application 2020 & 2033
Frequently Asked Questions
1. What is the projected Compound Annual Growth Rate (CAGR) of the Power Management Unit?
The projected CAGR is approximately 9.6%.
2. Which companies are prominent players in the Power Management Unit?
Key companies in the market include Texas Instruments, Ams AG, NXP Semiconductors, Nordic Semiconductor, Leonardo DRS, STMicroelectronics, Analog Devices, Onsemi, Atmel, Microchip Technology, Qorvo, Electro Standards Laboratories, Rockchip.
3. What are the main segments of the Power Management Unit?
The market segments include Application, Types.
4. Can you provide details about the market size?
The market size is estimated to be USD 23.47 billion as of 2022.
5. What are some drivers contributing to market growth?
N/A
6. What are the notable trends driving market growth?
N/A
7. Are there any restraints impacting market growth?
N/A
8. Can you provide examples of recent developments in the market?
N/A
9. What pricing options are available for accessing the report?
Pricing options include single-user, multi-user, and enterprise licenses priced at USD 2900.00, USD 4350.00, and USD 5800.00 respectively.
10. Is the market size provided in terms of value or volume?
The market size is provided in terms of value, measured in billion.
11. Are there any specific market keywords associated with the report?
Yes, the market keyword associated with the report is "Power Management Unit," which aids in identifying and referencing the specific market segment covered.
12. How do I determine which pricing option suits my needs best?
The pricing options vary based on user requirements and access needs. Individual users may opt for single-user licenses, while businesses requiring broader access may choose multi-user or enterprise licenses for cost-effective access to the report.
13. Are there any additional resources or data provided in the Power Management Unit report?
While the report offers comprehensive insights, it's advisable to review the specific contents or supplementary materials provided to ascertain if additional resources or data are available.
14. How can I stay updated on further developments or reports in the Power Management Unit?
To stay informed about further developments, trends, and reports in the Power Management Unit, consider subscribing to industry newsletters, following relevant companies and organizations, or regularly checking reputable industry news sources and publications.
Methodology
Step 1 - Identification of Relevant Samples Size from Population Database


Step 2 - Approaches for Defining Global Market Size (Value, Volume* & Price*)

Note*: In applicable scenarios
Step 3 - Data Sources
Primary Research
- Web Analytics
- Survey Reports
- Research Institute
- Latest Research Reports
- Opinion Leaders
Secondary Research
- Annual Reports
- White Paper
- Latest Press Release
- Industry Association
- Paid Database
- Investor Presentations

Step 4 - Data Triangulation
Involves using different sources of information in order to increase the validity of a study
These sources are likely to be stakeholders in a program - participants, other researchers, program staff, other community members, and so on.
Then we put all data in single framework & apply various statistical tools to find out the dynamic on the market.
During the analysis stage, feedback from the stakeholder groups would be compared to determine areas of agreement as well as areas of divergence