
Key Insights
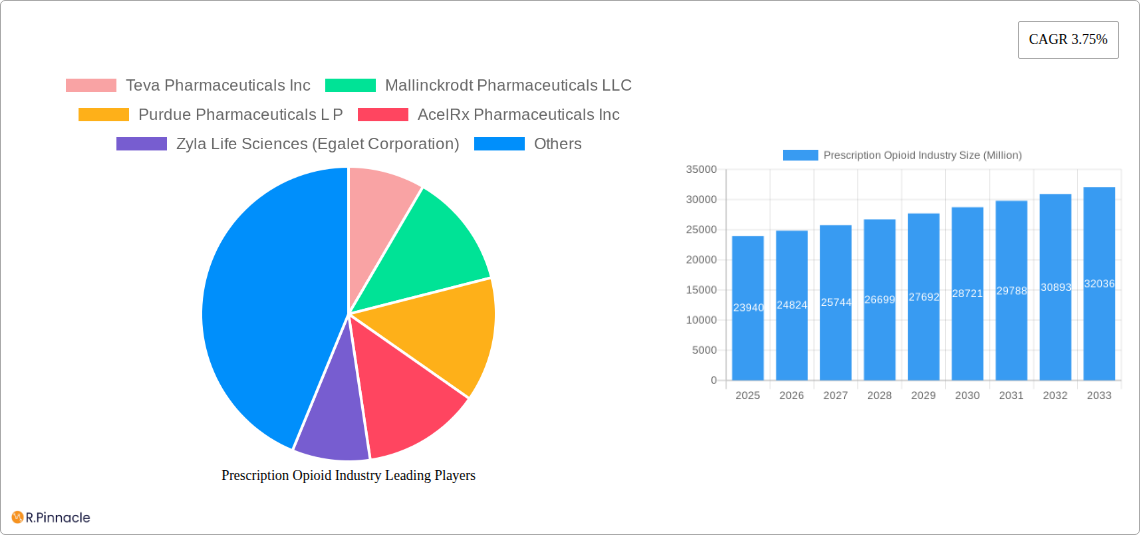
The global prescription opioid market, valued at $23.94 billion in 2025, is projected to experience steady growth, driven by a persistent need for effective pain management solutions, particularly for chronic conditions like arthritis and back pain. However, this growth is tempered by increasing regulatory scrutiny, heightened concerns surrounding opioid addiction and misuse, and the development and adoption of alternative pain management therapies. The market segmentation reveals a diverse landscape, with codeine, fentanyl, morphine, and methadone representing major product types. Strong agonist receptor-binding opioids dominate the market, reflecting the potency required for certain applications. Pain management remains the primary application area, but the market is witnessing a shift towards more responsible prescribing practices and a greater emphasis on patient monitoring and risk mitigation strategies. This necessitates a transition towards formulations with improved abuse-deterrent properties and a broader adoption of combination therapies that incorporate non-opioid analgesics. Major players in the market, including Teva Pharmaceuticals, Mallinckrodt, Purdue Pharma, and others, are adapting their strategies in response to this evolving landscape, emphasizing the development of safer and more effective opioid formulations, along with comprehensive patient support programs designed to reduce addiction risks.
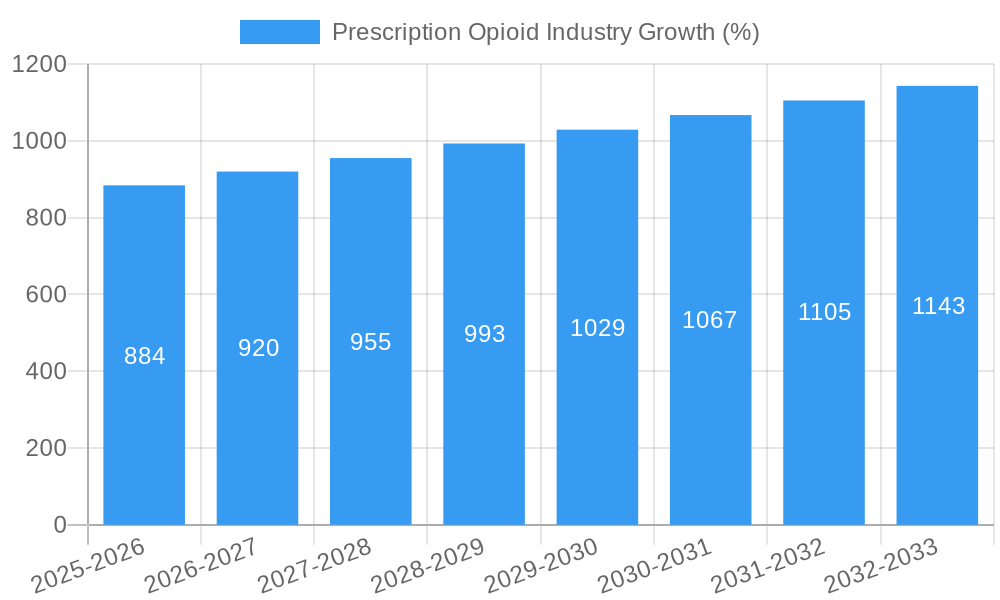
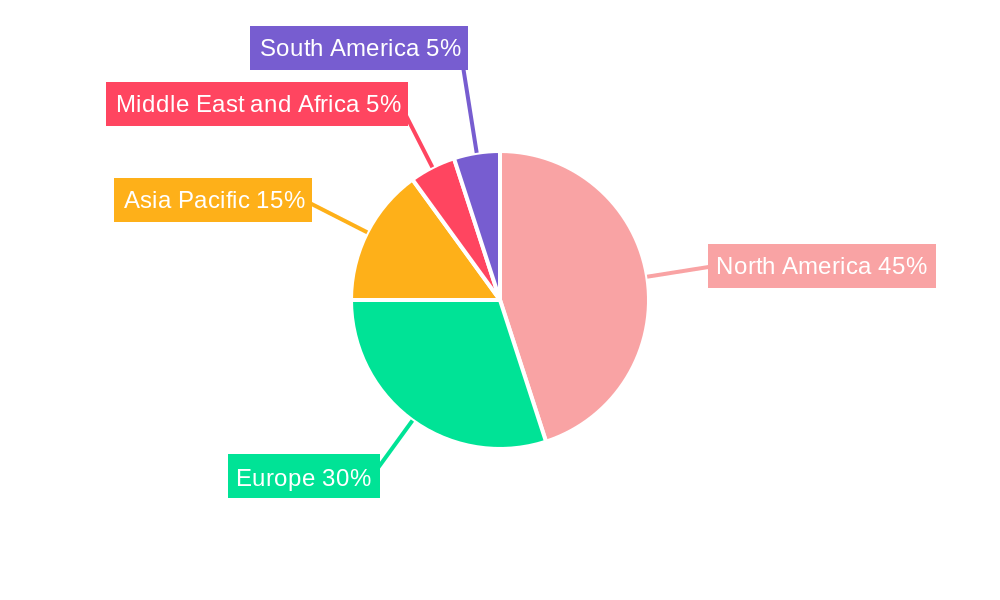
The regional distribution of the market shows a significant concentration in North America and Europe, reflecting higher healthcare spending and prevalent chronic pain conditions in these regions. However, developing economies in Asia-Pacific and other regions are expected to contribute to market growth in the coming years, although at a potentially slower pace than in more established markets. The forecast period (2025-2033) anticipates continued expansion, although at a CAGR of 3.75%, reflecting the aforementioned regulatory and societal pressures. Growth will likely be driven by new product launches featuring improved safety and abuse-deterrent properties, an increasing focus on personalized medicine approaches to pain management, and expansion into emerging markets. However, persistent challenges related to public health concerns will continue to shape market dynamics and limit overall growth potential.
This comprehensive report provides a detailed analysis of the Prescription Opioid Industry, offering invaluable insights for industry professionals, investors, and researchers. Covering the period from 2019 to 2033, with a focus on 2025, this report leverages rigorous data analysis to forecast market trends and identify key opportunities. The report examines market structure, dynamics, leading players, and emerging trends, providing actionable intelligence for strategic decision-making.
Prescription Opioid Industry Market Structure & Innovation Trends
The Prescription Opioid market, valued at xx Million in 2025, exhibits a moderately concentrated structure. Key players such as Teva Pharmaceuticals Inc, Mallinckrodt Pharmaceuticals LLC, and Purdue Pharmaceuticals L P hold significant market share, though the exact figures are proprietary to this report. Innovation is driven by the need for safer, more effective analgesics with reduced side effects and abuse potential. Stringent regulatory frameworks, including the FDA in the US and equivalent bodies globally, heavily influence the market. The rise of non-opioid pain management alternatives presents a substantial competitive threat, influencing market growth. Mergers and acquisitions (M&A) activity has been considerable, with deal values exceeding xx Million in recent years, driven by companies seeking to expand their product portfolios and geographic reach.
- Market Concentration: Moderately concentrated, with a few major players dominating.
- Innovation Drivers: Demand for safer analgesics, reduced abuse potential, and non-opioid alternatives.
- Regulatory Landscape: Stringent regulations impacting product development and market access.
- M&A Activity: Significant M&A activity exceeding xx Million in recent years.
- Market Share (2025): Teva Pharmaceuticals Inc: xx%, Mallinckrodt Pharmaceuticals LLC: xx%, Purdue Pharmaceuticals L P: xx%, Others: xx%.
Prescription Opioid Industry Market Dynamics & Trends
The Prescription Opioid market is projected to experience a CAGR of xx% during the forecast period (2025-2033). Market growth is fueled by increasing prevalence of chronic pain conditions, an aging population requiring pain management, and expanding access to healthcare in developing economies. Technological advancements in drug delivery systems, such as extended-release formulations and novel drug candidates, are influencing market dynamics. Changing consumer preferences towards less addictive pain relief options pose a challenge, although market penetration of non-opioid alternatives is currently at xx%. Intense competition among established players and emerging biotech firms is shaping the industry landscape.
Dominant Regions & Segments in Prescription Opioid Industry
The North American market currently dominates the Prescription Opioid landscape, driven by high healthcare expenditure, a large elderly population, and established healthcare infrastructure. However, growth is anticipated in Asia-Pacific owing to rising healthcare investment and increasing awareness regarding chronic pain conditions.
Dominant Segments:
- Product Type: Fentanyl holds the largest market share due to its potent analgesic properties, followed by Morphine and Oxycodone.
- Receptor Binding: Strong agonists continue to be the dominant segment due to their efficacy in pain management.
- Application: Pain management, primarily chronic pain, dominates the market.
Key Drivers:
- North America: High healthcare expenditure, aging population, established healthcare infrastructure.
- Asia-Pacific: Rising healthcare investment, increasing awareness of chronic pain.
Prescription Opioid Industry Product Innovations
Recent product innovations focus on reducing the risk of abuse and improving patient safety. This includes developing extended-release formulations and exploring novel drug targets. The market is also witnessing the introduction of combination therapies and advanced drug delivery systems to improve efficacy and compliance. These advancements contribute to a more tailored approach to pain management.
Report Scope & Segmentation Analysis
This report segments the Prescription Opioid market based on product type (Codeine, Fentanyl, Morphine, Meperidine, Methadone, Other Product Types), receptor binding (Strong Agonist, Mild to Moderate Agonist), and application (Pain Management). Each segment's growth projections, market size, and competitive dynamics are analyzed.
Key Drivers of Prescription Opioid Industry Growth
Key growth drivers include the increasing prevalence of chronic pain conditions globally, technological advancements leading to safer and more effective opioid formulations, and a growing elderly population requiring pain management solutions. Furthermore, rising healthcare expenditure in developing nations is expected to fuel market expansion.
Challenges in the Prescription Opioid Industry Sector
Challenges include stringent regulations aimed at curbing opioid abuse, fluctuating raw material prices impacting supply chain stability, and the emergence of non-opioid pain management alternatives that are increasing competition. The negative public perception surrounding opioids also impacts market growth.
Emerging Opportunities in Prescription Opioid Industry
Emerging opportunities lie in developing novel opioid formulations with reduced abuse potential, personalized medicine approaches targeting specific patient populations, and expansion into underpenetrated markets in developing countries. Investment in research and development of non-addictive pain management solutions will also shape future opportunities.
Leading Players in the Prescription Opioid Industry Market
- Teva Pharmaceuticals Inc Teva Pharmaceuticals
- Mallinckrodt Pharmaceuticals LLC
- Purdue Pharmaceuticals L P
- AcelRx Pharmaceuticals Inc AcelRx Pharmaceuticals
- Zyla Life Sciences (Egalet Corporation)
- Alcaliber SA
- Hikma Pharmaceuticals PLC Hikma Pharmaceuticals
- Johnson and Johnson Johnson & Johnson
- Amneal Pharmaceuticals Inc Amneal Pharmaceuticals
- Vertice Pharma LLC
- AbbVie Inc (Allergan PLC) AbbVie
- Endo Pharmaceuticals Inc
- Sun Pharmaceutical Industries Ltd Sun Pharma
- Pfizer Inc Pfizer
Key Developments in Prescription Opioid Industry Industry
- January 2022: Trevena, Inc. announced that China's NMPA accepted the NDA for OLINVYK (oliceridine) injection.
- October 2021: Esteve Pharmaceuticals received FDA approval for SEGLENTIS (celecoxib and tramadol hydrochloride).
Future Outlook for Prescription Opioid Industry Market
The Prescription Opioid market is poised for continued growth, albeit at a moderated pace compared to previous years, driven by the ongoing need for effective pain management solutions. Strategic opportunities exist in developing innovative formulations, expanding into new markets, and focusing on patient safety and reducing the risk of abuse. The market will continue to be shaped by evolving regulatory landscapes and increasing competition from non-opioid alternatives.
Prescription Opioid Industry Segmentation
-
1. Product Type
- 1.1. Codeine
- 1.2. Fentanyl
- 1.3. Morphine
- 1.4. Meperidine
- 1.5. Methadone
- 1.6. Other Product Types
-
2. Receptor Binding
- 2.1. Strong Agonist
- 2.2. Mild to Moderate Agonist
-
3. Application
-
3.1. Pain Management
- 3.1.1. Cancer Pain
- 3.1.2. Neuropathic Pain
- 3.1.3. Osteoarthritis Pain
- 3.1.4. Other Pain Managements
- 3.2. Cold and Cough
- 3.3. Diarrhoea
- 3.4. Other Applications
-
3.1. Pain Management
Prescription Opioid Industry Segmentation By Geography
-
1. North America
- 1.1. United States
- 1.2. Canada
- 1.3. Mexico
-
2. Europe
- 2.1. Germany
- 2.2. United Kingdom
- 2.3. France
- 2.4. Italy
- 2.5. Spain
- 2.6. Rest of Europe
-
3. Asia Pacific
- 3.1. China
- 3.2. Japan
- 3.3. India
- 3.4. Australia
- 3.5. South Korea
- 3.6. Rest of Asia Pacific
-
4. Middle East and Africa
- 4.1. GCC
- 4.2. South Africa
- 4.3. Rest of Middle East and Africa
-
5. South America
- 5.1. Brazil
- 5.2. Argentina
- 5.3. Rest of South America
Prescription Opioid Industry REPORT HIGHLIGHTS
| Aspects | Details |
|---|---|
| Study Period | 2019-2033 |
| Base Year | 2024 |
| Estimated Year | 2025 |
| Forecast Period | 2025-2033 |
| Historical Period | 2019-2024 |
| Growth Rate | CAGR of 3.75% from 2019-2033 |
| Segmentation |
|
Table of Contents
- 1. Introduction
- 1.1. Research Scope
- 1.2. Market Segmentation
- 1.3. Research Methodology
- 1.4. Definitions and Assumptions
- 2. Executive Summary
- 2.1. Introduction
- 3. Market Dynamics
- 3.1. Introduction
- 3.2. Market Drivers
- 3.2.1. Rising Prevalence of Orthopedic Diseases and Chronic Pain; Inclination toward Extended Release Formulations from Immediate Release of Opioids; Rising Focus on Abuse-deterrent Formulation (ADF) by Generic Manufacturers
- 3.3. Market Restrains
- 3.3.1. Advent and Legalization of Cannabis as an Alternative to Opioids; Prescription Drug Abuse
- 3.4. Market Trends
- 3.4.1. Strong Agonists are Expected to Hold Significant Market Share in the Receptor Binding Segment
- 4. Market Factor Analysis
- 4.1. Porters Five Forces
- 4.2. Supply/Value Chain
- 4.3. PESTEL analysis
- 4.4. Market Entropy
- 4.5. Patent/Trademark Analysis
- 5. Global Prescription Opioid Industry Analysis, Insights and Forecast, 2019-2031
- 5.1. Market Analysis, Insights and Forecast - by Product Type
- 5.1.1. Codeine
- 5.1.2. Fentanyl
- 5.1.3. Morphine
- 5.1.4. Meperidine
- 5.1.5. Methadone
- 5.1.6. Other Product Types
- 5.2. Market Analysis, Insights and Forecast - by Receptor Binding
- 5.2.1. Strong Agonist
- 5.2.2. Mild to Moderate Agonist
- 5.3. Market Analysis, Insights and Forecast - by Application
- 5.3.1. Pain Management
- 5.3.1.1. Cancer Pain
- 5.3.1.2. Neuropathic Pain
- 5.3.1.3. Osteoarthritis Pain
- 5.3.1.4. Other Pain Managements
- 5.3.2. Cold and Cough
- 5.3.3. Diarrhoea
- 5.3.4. Other Applications
- 5.3.1. Pain Management
- 5.4. Market Analysis, Insights and Forecast - by Region
- 5.4.1. North America
- 5.4.2. Europe
- 5.4.3. Asia Pacific
- 5.4.4. Middle East and Africa
- 5.4.5. South America
- 5.1. Market Analysis, Insights and Forecast - by Product Type
- 6. North America Prescription Opioid Industry Analysis, Insights and Forecast, 2019-2031
- 6.1. Market Analysis, Insights and Forecast - by Product Type
- 6.1.1. Codeine
- 6.1.2. Fentanyl
- 6.1.3. Morphine
- 6.1.4. Meperidine
- 6.1.5. Methadone
- 6.1.6. Other Product Types
- 6.2. Market Analysis, Insights and Forecast - by Receptor Binding
- 6.2.1. Strong Agonist
- 6.2.2. Mild to Moderate Agonist
- 6.3. Market Analysis, Insights and Forecast - by Application
- 6.3.1. Pain Management
- 6.3.1.1. Cancer Pain
- 6.3.1.2. Neuropathic Pain
- 6.3.1.3. Osteoarthritis Pain
- 6.3.1.4. Other Pain Managements
- 6.3.2. Cold and Cough
- 6.3.3. Diarrhoea
- 6.3.4. Other Applications
- 6.3.1. Pain Management
- 6.1. Market Analysis, Insights and Forecast - by Product Type
- 7. Europe Prescription Opioid Industry Analysis, Insights and Forecast, 2019-2031
- 7.1. Market Analysis, Insights and Forecast - by Product Type
- 7.1.1. Codeine
- 7.1.2. Fentanyl
- 7.1.3. Morphine
- 7.1.4. Meperidine
- 7.1.5. Methadone
- 7.1.6. Other Product Types
- 7.2. Market Analysis, Insights and Forecast - by Receptor Binding
- 7.2.1. Strong Agonist
- 7.2.2. Mild to Moderate Agonist
- 7.3. Market Analysis, Insights and Forecast - by Application
- 7.3.1. Pain Management
- 7.3.1.1. Cancer Pain
- 7.3.1.2. Neuropathic Pain
- 7.3.1.3. Osteoarthritis Pain
- 7.3.1.4. Other Pain Managements
- 7.3.2. Cold and Cough
- 7.3.3. Diarrhoea
- 7.3.4. Other Applications
- 7.3.1. Pain Management
- 7.1. Market Analysis, Insights and Forecast - by Product Type
- 8. Asia Pacific Prescription Opioid Industry Analysis, Insights and Forecast, 2019-2031
- 8.1. Market Analysis, Insights and Forecast - by Product Type
- 8.1.1. Codeine
- 8.1.2. Fentanyl
- 8.1.3. Morphine
- 8.1.4. Meperidine
- 8.1.5. Methadone
- 8.1.6. Other Product Types
- 8.2. Market Analysis, Insights and Forecast - by Receptor Binding
- 8.2.1. Strong Agonist
- 8.2.2. Mild to Moderate Agonist
- 8.3. Market Analysis, Insights and Forecast - by Application
- 8.3.1. Pain Management
- 8.3.1.1. Cancer Pain
- 8.3.1.2. Neuropathic Pain
- 8.3.1.3. Osteoarthritis Pain
- 8.3.1.4. Other Pain Managements
- 8.3.2. Cold and Cough
- 8.3.3. Diarrhoea
- 8.3.4. Other Applications
- 8.3.1. Pain Management
- 8.1. Market Analysis, Insights and Forecast - by Product Type
- 9. Middle East and Africa Prescription Opioid Industry Analysis, Insights and Forecast, 2019-2031
- 9.1. Market Analysis, Insights and Forecast - by Product Type
- 9.1.1. Codeine
- 9.1.2. Fentanyl
- 9.1.3. Morphine
- 9.1.4. Meperidine
- 9.1.5. Methadone
- 9.1.6. Other Product Types
- 9.2. Market Analysis, Insights and Forecast - by Receptor Binding
- 9.2.1. Strong Agonist
- 9.2.2. Mild to Moderate Agonist
- 9.3. Market Analysis, Insights and Forecast - by Application
- 9.3.1. Pain Management
- 9.3.1.1. Cancer Pain
- 9.3.1.2. Neuropathic Pain
- 9.3.1.3. Osteoarthritis Pain
- 9.3.1.4. Other Pain Managements
- 9.3.2. Cold and Cough
- 9.3.3. Diarrhoea
- 9.3.4. Other Applications
- 9.3.1. Pain Management
- 9.1. Market Analysis, Insights and Forecast - by Product Type
- 10. South America Prescription Opioid Industry Analysis, Insights and Forecast, 2019-2031
- 10.1. Market Analysis, Insights and Forecast - by Product Type
- 10.1.1. Codeine
- 10.1.2. Fentanyl
- 10.1.3. Morphine
- 10.1.4. Meperidine
- 10.1.5. Methadone
- 10.1.6. Other Product Types
- 10.2. Market Analysis, Insights and Forecast - by Receptor Binding
- 10.2.1. Strong Agonist
- 10.2.2. Mild to Moderate Agonist
- 10.3. Market Analysis, Insights and Forecast - by Application
- 10.3.1. Pain Management
- 10.3.1.1. Cancer Pain
- 10.3.1.2. Neuropathic Pain
- 10.3.1.3. Osteoarthritis Pain
- 10.3.1.4. Other Pain Managements
- 10.3.2. Cold and Cough
- 10.3.3. Diarrhoea
- 10.3.4. Other Applications
- 10.3.1. Pain Management
- 10.1. Market Analysis, Insights and Forecast - by Product Type
- 11. North America Prescription Opioid Industry Analysis, Insights and Forecast, 2019-2031
- 11.1. Market Analysis, Insights and Forecast - By Country/Sub-region
- 11.1.1. undefined
- 12. Europe Prescription Opioid Industry Analysis, Insights and Forecast, 2019-2031
- 12.1. Market Analysis, Insights and Forecast - By Country/Sub-region
- 12.1.1. undefined
- 13. Asia Pacific Prescription Opioid Industry Analysis, Insights and Forecast, 2019-2031
- 13.1. Market Analysis, Insights and Forecast - By Country/Sub-region
- 13.1.1. undefined
- 14. Middle East and Africa Prescription Opioid Industry Analysis, Insights and Forecast, 2019-2031
- 14.1. Market Analysis, Insights and Forecast - By Country/Sub-region
- 14.1.1. undefined
- 15. South America Prescription Opioid Industry Analysis, Insights and Forecast, 2019-2031
- 15.1. Market Analysis, Insights and Forecast - By Country/Sub-region
- 15.1.1. undefined
- 16. Competitive Analysis
- 16.1. Global Market Share Analysis 2024
- 16.2. Company Profiles
- 16.2.1 Teva Pharmaceuticals Inc
- 16.2.1.1. Overview
- 16.2.1.2. Products
- 16.2.1.3. SWOT Analysis
- 16.2.1.4. Recent Developments
- 16.2.1.5. Financials (Based on Availability)
- 16.2.2 Mallinckrodt Pharmaceuticals LLC
- 16.2.2.1. Overview
- 16.2.2.2. Products
- 16.2.2.3. SWOT Analysis
- 16.2.2.4. Recent Developments
- 16.2.2.5. Financials (Based on Availability)
- 16.2.3 Purdue Pharmaceuticals L P
- 16.2.3.1. Overview
- 16.2.3.2. Products
- 16.2.3.3. SWOT Analysis
- 16.2.3.4. Recent Developments
- 16.2.3.5. Financials (Based on Availability)
- 16.2.4 AcelRx Pharmaceuticals Inc
- 16.2.4.1. Overview
- 16.2.4.2. Products
- 16.2.4.3. SWOT Analysis
- 16.2.4.4. Recent Developments
- 16.2.4.5. Financials (Based on Availability)
- 16.2.5 Zyla Life Sciences (Egalet Corporation)
- 16.2.5.1. Overview
- 16.2.5.2. Products
- 16.2.5.3. SWOT Analysis
- 16.2.5.4. Recent Developments
- 16.2.5.5. Financials (Based on Availability)
- 16.2.6 Alcaliber SA
- 16.2.6.1. Overview
- 16.2.6.2. Products
- 16.2.6.3. SWOT Analysis
- 16.2.6.4. Recent Developments
- 16.2.6.5. Financials (Based on Availability)
- 16.2.7 Hikma Pharmaceuticals PLC
- 16.2.7.1. Overview
- 16.2.7.2. Products
- 16.2.7.3. SWOT Analysis
- 16.2.7.4. Recent Developments
- 16.2.7.5. Financials (Based on Availability)
- 16.2.8 Johnson and Johnson
- 16.2.8.1. Overview
- 16.2.8.2. Products
- 16.2.8.3. SWOT Analysis
- 16.2.8.4. Recent Developments
- 16.2.8.5. Financials (Based on Availability)
- 16.2.9 Amneal Pharmaceuticals Inc
- 16.2.9.1. Overview
- 16.2.9.2. Products
- 16.2.9.3. SWOT Analysis
- 16.2.9.4. Recent Developments
- 16.2.9.5. Financials (Based on Availability)
- 16.2.10 Vertice Pharma LLC
- 16.2.10.1. Overview
- 16.2.10.2. Products
- 16.2.10.3. SWOT Analysis
- 16.2.10.4. Recent Developments
- 16.2.10.5. Financials (Based on Availability)
- 16.2.11 AbbVie Inc (Allergan PLC)
- 16.2.11.1. Overview
- 16.2.11.2. Products
- 16.2.11.3. SWOT Analysis
- 16.2.11.4. Recent Developments
- 16.2.11.5. Financials (Based on Availability)
- 16.2.12 Endo Pharmaceuticals Inc
- 16.2.12.1. Overview
- 16.2.12.2. Products
- 16.2.12.3. SWOT Analysis
- 16.2.12.4. Recent Developments
- 16.2.12.5. Financials (Based on Availability)
- 16.2.13 Sun Pharmaceutical Industries Ltd
- 16.2.13.1. Overview
- 16.2.13.2. Products
- 16.2.13.3. SWOT Analysis
- 16.2.13.4. Recent Developments
- 16.2.13.5. Financials (Based on Availability)
- 16.2.14 Pfizer Inc
- 16.2.14.1. Overview
- 16.2.14.2. Products
- 16.2.14.3. SWOT Analysis
- 16.2.14.4. Recent Developments
- 16.2.14.5. Financials (Based on Availability)
- 16.2.1 Teva Pharmaceuticals Inc
List of Figures
- Figure 1: Global Prescription Opioid Industry Revenue Breakdown (Million, %) by Region 2024 & 2032
- Figure 2: Global Prescription Opioid Industry Volume Breakdown (K Unit, %) by Region 2024 & 2032
- Figure 3: North America Prescription Opioid Industry Revenue (Million), by Country 2024 & 2032
- Figure 4: North America Prescription Opioid Industry Volume (K Unit), by Country 2024 & 2032
- Figure 5: North America Prescription Opioid Industry Revenue Share (%), by Country 2024 & 2032
- Figure 6: North America Prescription Opioid Industry Volume Share (%), by Country 2024 & 2032
- Figure 7: Europe Prescription Opioid Industry Revenue (Million), by Country 2024 & 2032
- Figure 8: Europe Prescription Opioid Industry Volume (K Unit), by Country 2024 & 2032
- Figure 9: Europe Prescription Opioid Industry Revenue Share (%), by Country 2024 & 2032
- Figure 10: Europe Prescription Opioid Industry Volume Share (%), by Country 2024 & 2032
- Figure 11: Asia Pacific Prescription Opioid Industry Revenue (Million), by Country 2024 & 2032
- Figure 12: Asia Pacific Prescription Opioid Industry Volume (K Unit), by Country 2024 & 2032
- Figure 13: Asia Pacific Prescription Opioid Industry Revenue Share (%), by Country 2024 & 2032
- Figure 14: Asia Pacific Prescription Opioid Industry Volume Share (%), by Country 2024 & 2032
- Figure 15: Middle East and Africa Prescription Opioid Industry Revenue (Million), by Country 2024 & 2032
- Figure 16: Middle East and Africa Prescription Opioid Industry Volume (K Unit), by Country 2024 & 2032
- Figure 17: Middle East and Africa Prescription Opioid Industry Revenue Share (%), by Country 2024 & 2032
- Figure 18: Middle East and Africa Prescription Opioid Industry Volume Share (%), by Country 2024 & 2032
- Figure 19: South America Prescription Opioid Industry Revenue (Million), by Country 2024 & 2032
- Figure 20: South America Prescription Opioid Industry Volume (K Unit), by Country 2024 & 2032
- Figure 21: South America Prescription Opioid Industry Revenue Share (%), by Country 2024 & 2032
- Figure 22: South America Prescription Opioid Industry Volume Share (%), by Country 2024 & 2032
- Figure 23: North America Prescription Opioid Industry Revenue (Million), by Product Type 2024 & 2032
- Figure 24: North America Prescription Opioid Industry Volume (K Unit), by Product Type 2024 & 2032
- Figure 25: North America Prescription Opioid Industry Revenue Share (%), by Product Type 2024 & 2032
- Figure 26: North America Prescription Opioid Industry Volume Share (%), by Product Type 2024 & 2032
- Figure 27: North America Prescription Opioid Industry Revenue (Million), by Receptor Binding 2024 & 2032
- Figure 28: North America Prescription Opioid Industry Volume (K Unit), by Receptor Binding 2024 & 2032
- Figure 29: North America Prescription Opioid Industry Revenue Share (%), by Receptor Binding 2024 & 2032
- Figure 30: North America Prescription Opioid Industry Volume Share (%), by Receptor Binding 2024 & 2032
- Figure 31: North America Prescription Opioid Industry Revenue (Million), by Application 2024 & 2032
- Figure 32: North America Prescription Opioid Industry Volume (K Unit), by Application 2024 & 2032
- Figure 33: North America Prescription Opioid Industry Revenue Share (%), by Application 2024 & 2032
- Figure 34: North America Prescription Opioid Industry Volume Share (%), by Application 2024 & 2032
- Figure 35: North America Prescription Opioid Industry Revenue (Million), by Country 2024 & 2032
- Figure 36: North America Prescription Opioid Industry Volume (K Unit), by Country 2024 & 2032
- Figure 37: North America Prescription Opioid Industry Revenue Share (%), by Country 2024 & 2032
- Figure 38: North America Prescription Opioid Industry Volume Share (%), by Country 2024 & 2032
- Figure 39: Europe Prescription Opioid Industry Revenue (Million), by Product Type 2024 & 2032
- Figure 40: Europe Prescription Opioid Industry Volume (K Unit), by Product Type 2024 & 2032
- Figure 41: Europe Prescription Opioid Industry Revenue Share (%), by Product Type 2024 & 2032
- Figure 42: Europe Prescription Opioid Industry Volume Share (%), by Product Type 2024 & 2032
- Figure 43: Europe Prescription Opioid Industry Revenue (Million), by Receptor Binding 2024 & 2032
- Figure 44: Europe Prescription Opioid Industry Volume (K Unit), by Receptor Binding 2024 & 2032
- Figure 45: Europe Prescription Opioid Industry Revenue Share (%), by Receptor Binding 2024 & 2032
- Figure 46: Europe Prescription Opioid Industry Volume Share (%), by Receptor Binding 2024 & 2032
- Figure 47: Europe Prescription Opioid Industry Revenue (Million), by Application 2024 & 2032
- Figure 48: Europe Prescription Opioid Industry Volume (K Unit), by Application 2024 & 2032
- Figure 49: Europe Prescription Opioid Industry Revenue Share (%), by Application 2024 & 2032
- Figure 50: Europe Prescription Opioid Industry Volume Share (%), by Application 2024 & 2032
- Figure 51: Europe Prescription Opioid Industry Revenue (Million), by Country 2024 & 2032
- Figure 52: Europe Prescription Opioid Industry Volume (K Unit), by Country 2024 & 2032
- Figure 53: Europe Prescription Opioid Industry Revenue Share (%), by Country 2024 & 2032
- Figure 54: Europe Prescription Opioid Industry Volume Share (%), by Country 2024 & 2032
- Figure 55: Asia Pacific Prescription Opioid Industry Revenue (Million), by Product Type 2024 & 2032
- Figure 56: Asia Pacific Prescription Opioid Industry Volume (K Unit), by Product Type 2024 & 2032
- Figure 57: Asia Pacific Prescription Opioid Industry Revenue Share (%), by Product Type 2024 & 2032
- Figure 58: Asia Pacific Prescription Opioid Industry Volume Share (%), by Product Type 2024 & 2032
- Figure 59: Asia Pacific Prescription Opioid Industry Revenue (Million), by Receptor Binding 2024 & 2032
- Figure 60: Asia Pacific Prescription Opioid Industry Volume (K Unit), by Receptor Binding 2024 & 2032
- Figure 61: Asia Pacific Prescription Opioid Industry Revenue Share (%), by Receptor Binding 2024 & 2032
- Figure 62: Asia Pacific Prescription Opioid Industry Volume Share (%), by Receptor Binding 2024 & 2032
- Figure 63: Asia Pacific Prescription Opioid Industry Revenue (Million), by Application 2024 & 2032
- Figure 64: Asia Pacific Prescription Opioid Industry Volume (K Unit), by Application 2024 & 2032
- Figure 65: Asia Pacific Prescription Opioid Industry Revenue Share (%), by Application 2024 & 2032
- Figure 66: Asia Pacific Prescription Opioid Industry Volume Share (%), by Application 2024 & 2032
- Figure 67: Asia Pacific Prescription Opioid Industry Revenue (Million), by Country 2024 & 2032
- Figure 68: Asia Pacific Prescription Opioid Industry Volume (K Unit), by Country 2024 & 2032
- Figure 69: Asia Pacific Prescription Opioid Industry Revenue Share (%), by Country 2024 & 2032
- Figure 70: Asia Pacific Prescription Opioid Industry Volume Share (%), by Country 2024 & 2032
- Figure 71: Middle East and Africa Prescription Opioid Industry Revenue (Million), by Product Type 2024 & 2032
- Figure 72: Middle East and Africa Prescription Opioid Industry Volume (K Unit), by Product Type 2024 & 2032
- Figure 73: Middle East and Africa Prescription Opioid Industry Revenue Share (%), by Product Type 2024 & 2032
- Figure 74: Middle East and Africa Prescription Opioid Industry Volume Share (%), by Product Type 2024 & 2032
- Figure 75: Middle East and Africa Prescription Opioid Industry Revenue (Million), by Receptor Binding 2024 & 2032
- Figure 76: Middle East and Africa Prescription Opioid Industry Volume (K Unit), by Receptor Binding 2024 & 2032
- Figure 77: Middle East and Africa Prescription Opioid Industry Revenue Share (%), by Receptor Binding 2024 & 2032
- Figure 78: Middle East and Africa Prescription Opioid Industry Volume Share (%), by Receptor Binding 2024 & 2032
- Figure 79: Middle East and Africa Prescription Opioid Industry Revenue (Million), by Application 2024 & 2032
- Figure 80: Middle East and Africa Prescription Opioid Industry Volume (K Unit), by Application 2024 & 2032
- Figure 81: Middle East and Africa Prescription Opioid Industry Revenue Share (%), by Application 2024 & 2032
- Figure 82: Middle East and Africa Prescription Opioid Industry Volume Share (%), by Application 2024 & 2032
- Figure 83: Middle East and Africa Prescription Opioid Industry Revenue (Million), by Country 2024 & 2032
- Figure 84: Middle East and Africa Prescription Opioid Industry Volume (K Unit), by Country 2024 & 2032
- Figure 85: Middle East and Africa Prescription Opioid Industry Revenue Share (%), by Country 2024 & 2032
- Figure 86: Middle East and Africa Prescription Opioid Industry Volume Share (%), by Country 2024 & 2032
- Figure 87: South America Prescription Opioid Industry Revenue (Million), by Product Type 2024 & 2032
- Figure 88: South America Prescription Opioid Industry Volume (K Unit), by Product Type 2024 & 2032
- Figure 89: South America Prescription Opioid Industry Revenue Share (%), by Product Type 2024 & 2032
- Figure 90: South America Prescription Opioid Industry Volume Share (%), by Product Type 2024 & 2032
- Figure 91: South America Prescription Opioid Industry Revenue (Million), by Receptor Binding 2024 & 2032
- Figure 92: South America Prescription Opioid Industry Volume (K Unit), by Receptor Binding 2024 & 2032
- Figure 93: South America Prescription Opioid Industry Revenue Share (%), by Receptor Binding 2024 & 2032
- Figure 94: South America Prescription Opioid Industry Volume Share (%), by Receptor Binding 2024 & 2032
- Figure 95: South America Prescription Opioid Industry Revenue (Million), by Application 2024 & 2032
- Figure 96: South America Prescription Opioid Industry Volume (K Unit), by Application 2024 & 2032
- Figure 97: South America Prescription Opioid Industry Revenue Share (%), by Application 2024 & 2032
- Figure 98: South America Prescription Opioid Industry Volume Share (%), by Application 2024 & 2032
- Figure 99: South America Prescription Opioid Industry Revenue (Million), by Country 2024 & 2032
- Figure 100: South America Prescription Opioid Industry Volume (K Unit), by Country 2024 & 2032
- Figure 101: South America Prescription Opioid Industry Revenue Share (%), by Country 2024 & 2032
- Figure 102: South America Prescription Opioid Industry Volume Share (%), by Country 2024 & 2032
List of Tables
- Table 1: Global Prescription Opioid Industry Revenue Million Forecast, by Region 2019 & 2032
- Table 2: Global Prescription Opioid Industry Volume K Unit Forecast, by Region 2019 & 2032
- Table 3: Global Prescription Opioid Industry Revenue Million Forecast, by Product Type 2019 & 2032
- Table 4: Global Prescription Opioid Industry Volume K Unit Forecast, by Product Type 2019 & 2032
- Table 5: Global Prescription Opioid Industry Revenue Million Forecast, by Receptor Binding 2019 & 2032
- Table 6: Global Prescription Opioid Industry Volume K Unit Forecast, by Receptor Binding 2019 & 2032
- Table 7: Global Prescription Opioid Industry Revenue Million Forecast, by Application 2019 & 2032
- Table 8: Global Prescription Opioid Industry Volume K Unit Forecast, by Application 2019 & 2032
- Table 9: Global Prescription Opioid Industry Revenue Million Forecast, by Region 2019 & 2032
- Table 10: Global Prescription Opioid Industry Volume K Unit Forecast, by Region 2019 & 2032
- Table 11: Global Prescription Opioid Industry Revenue Million Forecast, by Country 2019 & 2032
- Table 12: Global Prescription Opioid Industry Volume K Unit Forecast, by Country 2019 & 2032
- Table 13: Global Prescription Opioid Industry Revenue Million Forecast, by Country 2019 & 2032
- Table 14: Global Prescription Opioid Industry Volume K Unit Forecast, by Country 2019 & 2032
- Table 15: Global Prescription Opioid Industry Revenue Million Forecast, by Country 2019 & 2032
- Table 16: Global Prescription Opioid Industry Volume K Unit Forecast, by Country 2019 & 2032
- Table 17: Global Prescription Opioid Industry Revenue Million Forecast, by Country 2019 & 2032
- Table 18: Global Prescription Opioid Industry Volume K Unit Forecast, by Country 2019 & 2032
- Table 19: Global Prescription Opioid Industry Revenue Million Forecast, by Country 2019 & 2032
- Table 20: Global Prescription Opioid Industry Volume K Unit Forecast, by Country 2019 & 2032
- Table 21: Global Prescription Opioid Industry Revenue Million Forecast, by Product Type 2019 & 2032
- Table 22: Global Prescription Opioid Industry Volume K Unit Forecast, by Product Type 2019 & 2032
- Table 23: Global Prescription Opioid Industry Revenue Million Forecast, by Receptor Binding 2019 & 2032
- Table 24: Global Prescription Opioid Industry Volume K Unit Forecast, by Receptor Binding 2019 & 2032
- Table 25: Global Prescription Opioid Industry Revenue Million Forecast, by Application 2019 & 2032
- Table 26: Global Prescription Opioid Industry Volume K Unit Forecast, by Application 2019 & 2032
- Table 27: Global Prescription Opioid Industry Revenue Million Forecast, by Country 2019 & 2032
- Table 28: Global Prescription Opioid Industry Volume K Unit Forecast, by Country 2019 & 2032
- Table 29: United States Prescription Opioid Industry Revenue (Million) Forecast, by Application 2019 & 2032
- Table 30: United States Prescription Opioid Industry Volume (K Unit) Forecast, by Application 2019 & 2032
- Table 31: Canada Prescription Opioid Industry Revenue (Million) Forecast, by Application 2019 & 2032
- Table 32: Canada Prescription Opioid Industry Volume (K Unit) Forecast, by Application 2019 & 2032
- Table 33: Mexico Prescription Opioid Industry Revenue (Million) Forecast, by Application 2019 & 2032
- Table 34: Mexico Prescription Opioid Industry Volume (K Unit) Forecast, by Application 2019 & 2032
- Table 35: Global Prescription Opioid Industry Revenue Million Forecast, by Product Type 2019 & 2032
- Table 36: Global Prescription Opioid Industry Volume K Unit Forecast, by Product Type 2019 & 2032
- Table 37: Global Prescription Opioid Industry Revenue Million Forecast, by Receptor Binding 2019 & 2032
- Table 38: Global Prescription Opioid Industry Volume K Unit Forecast, by Receptor Binding 2019 & 2032
- Table 39: Global Prescription Opioid Industry Revenue Million Forecast, by Application 2019 & 2032
- Table 40: Global Prescription Opioid Industry Volume K Unit Forecast, by Application 2019 & 2032
- Table 41: Global Prescription Opioid Industry Revenue Million Forecast, by Country 2019 & 2032
- Table 42: Global Prescription Opioid Industry Volume K Unit Forecast, by Country 2019 & 2032
- Table 43: Germany Prescription Opioid Industry Revenue (Million) Forecast, by Application 2019 & 2032
- Table 44: Germany Prescription Opioid Industry Volume (K Unit) Forecast, by Application 2019 & 2032
- Table 45: United Kingdom Prescription Opioid Industry Revenue (Million) Forecast, by Application 2019 & 2032
- Table 46: United Kingdom Prescription Opioid Industry Volume (K Unit) Forecast, by Application 2019 & 2032
- Table 47: France Prescription Opioid Industry Revenue (Million) Forecast, by Application 2019 & 2032
- Table 48: France Prescription Opioid Industry Volume (K Unit) Forecast, by Application 2019 & 2032
- Table 49: Italy Prescription Opioid Industry Revenue (Million) Forecast, by Application 2019 & 2032
- Table 50: Italy Prescription Opioid Industry Volume (K Unit) Forecast, by Application 2019 & 2032
- Table 51: Spain Prescription Opioid Industry Revenue (Million) Forecast, by Application 2019 & 2032
- Table 52: Spain Prescription Opioid Industry Volume (K Unit) Forecast, by Application 2019 & 2032
- Table 53: Rest of Europe Prescription Opioid Industry Revenue (Million) Forecast, by Application 2019 & 2032
- Table 54: Rest of Europe Prescription Opioid Industry Volume (K Unit) Forecast, by Application 2019 & 2032
- Table 55: Global Prescription Opioid Industry Revenue Million Forecast, by Product Type 2019 & 2032
- Table 56: Global Prescription Opioid Industry Volume K Unit Forecast, by Product Type 2019 & 2032
- Table 57: Global Prescription Opioid Industry Revenue Million Forecast, by Receptor Binding 2019 & 2032
- Table 58: Global Prescription Opioid Industry Volume K Unit Forecast, by Receptor Binding 2019 & 2032
- Table 59: Global Prescription Opioid Industry Revenue Million Forecast, by Application 2019 & 2032
- Table 60: Global Prescription Opioid Industry Volume K Unit Forecast, by Application 2019 & 2032
- Table 61: Global Prescription Opioid Industry Revenue Million Forecast, by Country 2019 & 2032
- Table 62: Global Prescription Opioid Industry Volume K Unit Forecast, by Country 2019 & 2032
- Table 63: China Prescription Opioid Industry Revenue (Million) Forecast, by Application 2019 & 2032
- Table 64: China Prescription Opioid Industry Volume (K Unit) Forecast, by Application 2019 & 2032
- Table 65: Japan Prescription Opioid Industry Revenue (Million) Forecast, by Application 2019 & 2032
- Table 66: Japan Prescription Opioid Industry Volume (K Unit) Forecast, by Application 2019 & 2032
- Table 67: India Prescription Opioid Industry Revenue (Million) Forecast, by Application 2019 & 2032
- Table 68: India Prescription Opioid Industry Volume (K Unit) Forecast, by Application 2019 & 2032
- Table 69: Australia Prescription Opioid Industry Revenue (Million) Forecast, by Application 2019 & 2032
- Table 70: Australia Prescription Opioid Industry Volume (K Unit) Forecast, by Application 2019 & 2032
- Table 71: South Korea Prescription Opioid Industry Revenue (Million) Forecast, by Application 2019 & 2032
- Table 72: South Korea Prescription Opioid Industry Volume (K Unit) Forecast, by Application 2019 & 2032
- Table 73: Rest of Asia Pacific Prescription Opioid Industry Revenue (Million) Forecast, by Application 2019 & 2032
- Table 74: Rest of Asia Pacific Prescription Opioid Industry Volume (K Unit) Forecast, by Application 2019 & 2032
- Table 75: Global Prescription Opioid Industry Revenue Million Forecast, by Product Type 2019 & 2032
- Table 76: Global Prescription Opioid Industry Volume K Unit Forecast, by Product Type 2019 & 2032
- Table 77: Global Prescription Opioid Industry Revenue Million Forecast, by Receptor Binding 2019 & 2032
- Table 78: Global Prescription Opioid Industry Volume K Unit Forecast, by Receptor Binding 2019 & 2032
- Table 79: Global Prescription Opioid Industry Revenue Million Forecast, by Application 2019 & 2032
- Table 80: Global Prescription Opioid Industry Volume K Unit Forecast, by Application 2019 & 2032
- Table 81: Global Prescription Opioid Industry Revenue Million Forecast, by Country 2019 & 2032
- Table 82: Global Prescription Opioid Industry Volume K Unit Forecast, by Country 2019 & 2032
- Table 83: GCC Prescription Opioid Industry Revenue (Million) Forecast, by Application 2019 & 2032
- Table 84: GCC Prescription Opioid Industry Volume (K Unit) Forecast, by Application 2019 & 2032
- Table 85: South Africa Prescription Opioid Industry Revenue (Million) Forecast, by Application 2019 & 2032
- Table 86: South Africa Prescription Opioid Industry Volume (K Unit) Forecast, by Application 2019 & 2032
- Table 87: Rest of Middle East and Africa Prescription Opioid Industry Revenue (Million) Forecast, by Application 2019 & 2032
- Table 88: Rest of Middle East and Africa Prescription Opioid Industry Volume (K Unit) Forecast, by Application 2019 & 2032
- Table 89: Global Prescription Opioid Industry Revenue Million Forecast, by Product Type 2019 & 2032
- Table 90: Global Prescription Opioid Industry Volume K Unit Forecast, by Product Type 2019 & 2032
- Table 91: Global Prescription Opioid Industry Revenue Million Forecast, by Receptor Binding 2019 & 2032
- Table 92: Global Prescription Opioid Industry Volume K Unit Forecast, by Receptor Binding 2019 & 2032
- Table 93: Global Prescription Opioid Industry Revenue Million Forecast, by Application 2019 & 2032
- Table 94: Global Prescription Opioid Industry Volume K Unit Forecast, by Application 2019 & 2032
- Table 95: Global Prescription Opioid Industry Revenue Million Forecast, by Country 2019 & 2032
- Table 96: Global Prescription Opioid Industry Volume K Unit Forecast, by Country 2019 & 2032
- Table 97: Brazil Prescription Opioid Industry Revenue (Million) Forecast, by Application 2019 & 2032
- Table 98: Brazil Prescription Opioid Industry Volume (K Unit) Forecast, by Application 2019 & 2032
- Table 99: Argentina Prescription Opioid Industry Revenue (Million) Forecast, by Application 2019 & 2032
- Table 100: Argentina Prescription Opioid Industry Volume (K Unit) Forecast, by Application 2019 & 2032
- Table 101: Rest of South America Prescription Opioid Industry Revenue (Million) Forecast, by Application 2019 & 2032
- Table 102: Rest of South America Prescription Opioid Industry Volume (K Unit) Forecast, by Application 2019 & 2032
Frequently Asked Questions
1. What is the projected Compound Annual Growth Rate (CAGR) of the Prescription Opioid Industry?
The projected CAGR is approximately 3.75%.
2. Which companies are prominent players in the Prescription Opioid Industry?
Key companies in the market include Teva Pharmaceuticals Inc, Mallinckrodt Pharmaceuticals LLC, Purdue Pharmaceuticals L P, AcelRx Pharmaceuticals Inc, Zyla Life Sciences (Egalet Corporation), Alcaliber SA, Hikma Pharmaceuticals PLC, Johnson and Johnson, Amneal Pharmaceuticals Inc, Vertice Pharma LLC, AbbVie Inc (Allergan PLC), Endo Pharmaceuticals Inc, Sun Pharmaceutical Industries Ltd, Pfizer Inc.
3. What are the main segments of the Prescription Opioid Industry?
The market segments include Product Type, Receptor Binding, Application.
4. Can you provide details about the market size?
The market size is estimated to be USD 23.94 Million as of 2022.
5. What are some drivers contributing to market growth?
Rising Prevalence of Orthopedic Diseases and Chronic Pain; Inclination toward Extended Release Formulations from Immediate Release of Opioids; Rising Focus on Abuse-deterrent Formulation (ADF) by Generic Manufacturers.
6. What are the notable trends driving market growth?
Strong Agonists are Expected to Hold Significant Market Share in the Receptor Binding Segment.
7. Are there any restraints impacting market growth?
Advent and Legalization of Cannabis as an Alternative to Opioids; Prescription Drug Abuse.
8. Can you provide examples of recent developments in the market?
In January 2022, Trevena, Inc. announced that China's National Medical Products Administration (NMPA) has accepted the submission of a New Drug Application (NDA) for OLINVYK (oliceridine) injection, a novel IV analgesic that has been approved in the United States by the Food and Drug Administration (FDA) for use in adults for the management of acute pain severe enough to require an intravenous opioid analgesic
9. What pricing options are available for accessing the report?
Pricing options include single-user, multi-user, and enterprise licenses priced at USD 4750, USD 5250, and USD 8750 respectively.
10. Is the market size provided in terms of value or volume?
The market size is provided in terms of value, measured in Million and volume, measured in K Unit.
11. Are there any specific market keywords associated with the report?
Yes, the market keyword associated with the report is "Prescription Opioid Industry," which aids in identifying and referencing the specific market segment covered.
12. How do I determine which pricing option suits my needs best?
The pricing options vary based on user requirements and access needs. Individual users may opt for single-user licenses, while businesses requiring broader access may choose multi-user or enterprise licenses for cost-effective access to the report.
13. Are there any additional resources or data provided in the Prescription Opioid Industry report?
While the report offers comprehensive insights, it's advisable to review the specific contents or supplementary materials provided to ascertain if additional resources or data are available.
14. How can I stay updated on further developments or reports in the Prescription Opioid Industry?
To stay informed about further developments, trends, and reports in the Prescription Opioid Industry, consider subscribing to industry newsletters, following relevant companies and organizations, or regularly checking reputable industry news sources and publications.
Methodology
Step 1 - Identification of Relevant Samples Size from Population Database


Step 2 - Approaches for Defining Global Market Size (Value, Volume* & Price*)

Note*: In applicable scenarios
Step 3 - Data Sources
Primary Research
- Web Analytics
- Survey Reports
- Research Institute
- Latest Research Reports
- Opinion Leaders
Secondary Research
- Annual Reports
- White Paper
- Latest Press Release
- Industry Association
- Paid Database
- Investor Presentations

Step 4 - Data Triangulation
Involves using different sources of information in order to increase the validity of a study
These sources are likely to be stakeholders in a program - participants, other researchers, program staff, other community members, and so on.
Then we put all data in single framework & apply various statistical tools to find out the dynamic on the market.
During the analysis stage, feedback from the stakeholder groups would be compared to determine areas of agreement as well as areas of divergence


