

Key Insights
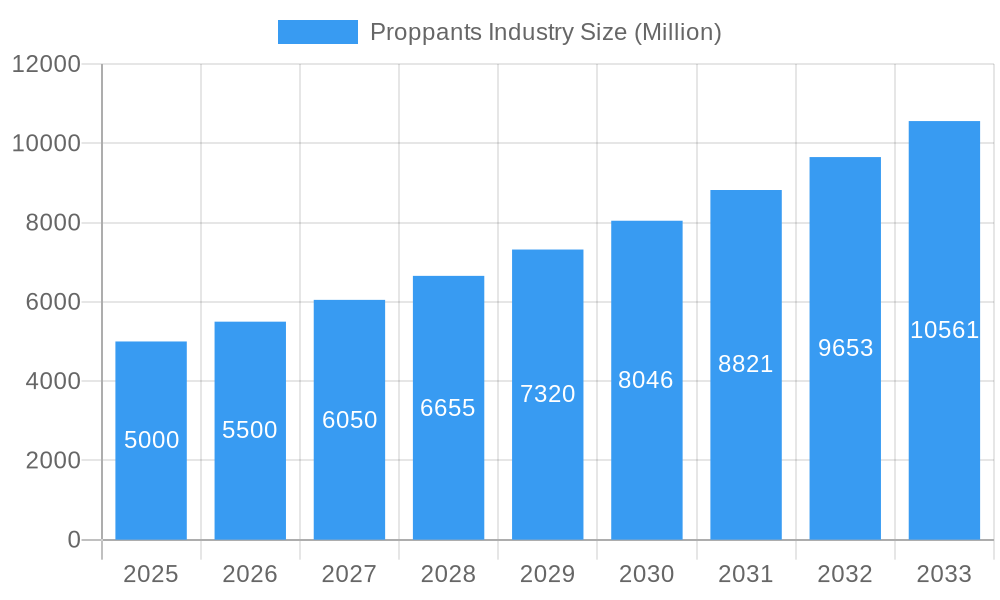
The global proppants market, essential for optimizing oil and gas extraction from shale formations, is poised for significant expansion. Driven by the sustained and increasing adoption of hydraulic fracturing ("fracking") worldwide, the market is projected to reach a value of $8.902 billion by 2025, exhibiting a compound annual growth rate (CAGR) of 9.97%. This robust growth trajectory is expected to continue through 2033, fueled by ongoing exploration and production activities, particularly in North America and other regions with substantial shale reserves.
Proppants Industry Market Size (In Billion)
Key factors influencing the proppants market include: oil and natural gas price fluctuations impacting fracking investment and proppant demand; evolving environmental regulations governing fracking operations; technological advancements in proppant materials, such as ceramic proppants, for enhanced performance and reduced environmental footprint; and increasing competition among manufacturers. These dynamic forces will collectively shape the market's future size and growth rate.
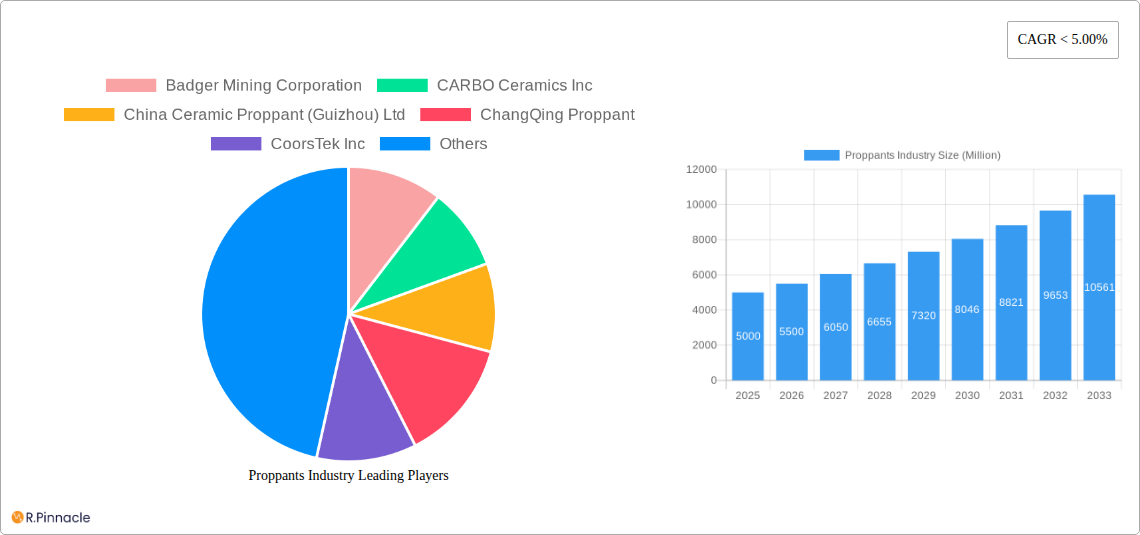
Proppants Industry Company Market Share
Proppants Industry Market Report: 2019-2033
This comprehensive report provides an in-depth analysis of the global proppants industry, offering actionable insights for industry professionals, investors, and strategic decision-makers. With a study period spanning 2019-2033, a base year of 2025, and a forecast period of 2025-2033, this report leverages rigorous data analysis to project future market trends and growth opportunities. The report covers a market valued at several billion dollars and examines key players such as Badger Mining Corporation, CARBO Ceramics Inc, and U.S. Silica, among others.
Proppants Industry Market Structure & Innovation Trends
The proppants market exhibits a moderately concentrated structure, with several major players holding significant market share. While precise market share figures vary by segment and year, U.S. Silica, Unimin Energy Solutions, and Preferred Sands LLC historically held prominent positions. However, the market is dynamic, with ongoing consolidation through mergers and acquisitions (M&A). Innovation is driven by the need for enhanced proppant performance, particularly in unconventional reservoirs requiring higher fracture conductivity and proppant strength. Regulatory frameworks, particularly those concerning environmental impact and safety, are significant influences. Product substitutes, such as alternative fracturing fluids, exert competitive pressure, while the end-user demographics (primarily oil and gas exploration and production companies) largely dictate market demand.
- Market Concentration: Moderately concentrated, with a few dominant players.
- Innovation Drivers: Enhanced proppant performance (strength, conductivity), cost reduction, environmental considerations.
- Regulatory Frameworks: Stringent environmental and safety regulations impact operational costs and product development.
- M&A Activities: Significant M&A activity shaping market structure; total deal values exceeding $XX billion in the historical period (2019-2024). Examples include CARBO Ceramics' acquisition of Pinnacle Technologies (see Key Developments).
Proppants Industry Market Dynamics & Trends
The proppants market demonstrates consistent growth, driven primarily by increasing global oil and gas production. Technological advancements, such as the development of high-strength ceramic proppants and resin-coated sand, are enhancing market penetration. The industry faces challenges from fluctuating commodity prices and competition from alternative fracturing technologies. However, the long-term outlook remains positive, fueled by ongoing exploration and production activities, particularly in unconventional shale gas and tight oil reservoirs. The CAGR for the forecast period (2025-2033) is projected to be xx%. Market penetration rates in specific regions vary, with mature markets demonstrating higher saturation levels than emerging markets. The competitive landscape is characterized by intense price competition and technological innovation.
Dominant Regions & Segments in Proppants Industry
North America, specifically the United States, historically dominated the proppants market, driven by extensive shale gas and tight oil production. This dominance is attributed to factors including:
- Abundant Resources: Significant deposits of high-quality frac sand.
- Established Infrastructure: Well-developed transportation and logistics networks.
- Supportive Regulatory Environment: Facilitates exploration and production activities.
Within product types, frac sand maintains the largest market share due to its cost-effectiveness. However, resin-coated proppants and ceramics are gaining traction due to their superior performance characteristics in challenging reservoir conditions. The growth of the resin-coated and ceramic segments is projected at xx% and yy% CAGR respectively during the forecast period.
Proppants Industry Product Innovations
Recent innovations focus on enhancing proppant strength, conductivity, and proppant embedment. The development of high-strength ceramic proppants and advanced resin coatings addresses the demand for improved performance in high-pressure and high-temperature applications. The market is witnessing a shift towards more sustainable and environmentally friendly proppants, addressing concerns related to dust emissions and water usage. These innovations aim to enhance the overall effectiveness and cost-efficiency of hydraulic fracturing operations, while improving well production yields.
Report Scope & Segmentation Analysis
This report segments the proppants market primarily by product type: Frac Sand, Resin Coated, and Ceramics.
Frac Sand: This segment comprises the largest market share, driven by its lower cost. Growth is projected to be moderately steady, with a projected market size of $XX billion by 2033.
Resin Coated: This segment demonstrates faster growth driven by performance advantages. The projected market size is $XX billion by 2033.
Ceramics: This segment experiences the highest growth rate, driven by its suitability for demanding applications. The projected market size is $XX billion by 2033.
Key Drivers of Proppants Industry Growth
Growth is fueled by increasing oil and gas demand, the expansion of unconventional resource development (shale gas and tight oil), and technological advancements leading to improved proppant performance and efficiency. Government policies supporting energy independence also contribute.
Challenges in the Proppants Industry Sector
The industry faces challenges from fluctuating oil and gas prices, environmental concerns, and intense competition. Supply chain disruptions and transportation costs also impact profitability. These factors can lead to reduced demand, pricing pressures, and operational inefficiencies.
Emerging Opportunities in Proppants Industry
Emerging opportunities lie in the development of novel proppant materials, advanced resin coatings, and sustainable manufacturing processes. Expanding into new geographic markets with significant unconventional resource potential also presents significant growth prospects.
Leading Players in the Proppants Industry Market
- Badger Mining Corporation
- CARBO Ceramics Inc
- China Ceramic Proppant (Guizhou) Ltd
- ChangQing Proppant
- CoorsTek Inc
- Covia Holdings LLC
- Eagle Materials Inc
- Emerge Energy Services (Superior Silica Sands)
- Epic Ceramic Proppants Inc
- Fores LTD
- General Electric (Baker Hughes Company)
- Gongyi Yuanyang Ceramsite Co Ltd
- Halliburton
- Henan Tianxiang New Materials Co Ltd
- Hexion
- Nika Petrotech
- Preferred Sands LLC
- Saint-Gobain
- Unimin Energy Solutions (Sibelco)
- U S Silica
- Wanli Proppant (List Not Exhaustive)
Key Developments in Proppants Industry
- May 2022: CARBO Ceramics Inc. acquired Pinnacle Technologies Inc., enhancing its product portfolio with fracture diagnostic, mapping, and simulation services. This acquisition strengthens CARBO Ceramics' position in the proppants market by providing enhanced data-driven solutions for optimizing proppant selection and placement.
Future Outlook for Proppants Industry Market
The proppants market is poised for continued growth, driven by the ongoing development of unconventional resources and the adoption of advanced fracturing technologies. Strategic investments in research and development, coupled with a focus on sustainability and cost optimization, will be crucial for capturing market share and maximizing profitability in the years to come.
Proppants Industry Segmentation
-
1. Product Type
- 1.1. Frac Sand
- 1.2. Resin Coated
- 1.3. Ceramics
Proppants Industry Segmentation By Geography
-
1. Asia Pacific
- 1.1. China
- 1.2. India
- 1.3. Indonesia
- 1.4. Malaysia
- 1.5. Thailand
- 1.6. Vietnam
- 1.7. Rest of Asia Pacific
-
2. North America
- 2.1. United States
- 2.2. Canada
- 2.3. Mexico
-
3. Europe
- 3.1. Germany
- 3.2. United Kingdom
- 3.3. Russia
- 3.4. Norway
- 3.5. Rest of Europe
-
4. South America
- 4.1. Brazil
- 4.2. Argentina
- 4.3. Rest of South America
-
5. Middle East and Africa
- 5.1. Saudi Arabia
- 5.2. South Africa
- 5.3. Rest of Middle East and Africa
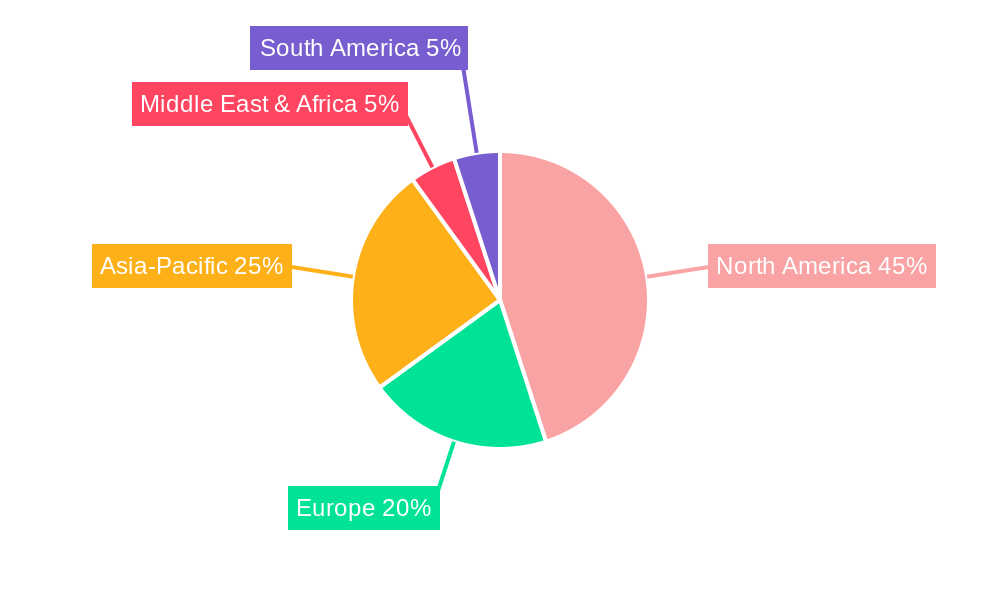
Proppants Industry Regional Market Share
Geographic Coverage of Proppants Industry
Proppants Industry REPORT HIGHLIGHTS
| Aspects | Details |
|---|---|
| Study Period | 2020-2034 |
| Base Year | 2025 |
| Estimated Year | 2026 |
| Forecast Period | 2026-2034 |
| Historical Period | 2020-2025 |
| Growth Rate | CAGR of 9.97% from 2020-2034 |
| Segmentation |
|
Table of Contents
- 1. Introduction
- 1.1. Research Scope
- 1.2. Market Segmentation
- 1.3. Research Objective
- 1.4. Definitions and Assumptions
- 2. Executive Summary
- 2.1. Market Snapshot
- 3. Market Dynamics
- 3.1. Market Drivers
- 3.2. Market Restrains
- 3.3. Market Trends
- 3.4. Market Opportunities
- 4. Market Factor Analysis
- 4.1. Porters Five Forces
- 4.1.1. Bargaining Power of Suppliers
- 4.1.2. Bargaining Power of Buyers
- 4.1.3. Threat of New Entrants
- 4.1.4. Threat of Substitutes
- 4.1.5. Competitive Rivalry
- 4.2. PESTEL analysis
- 4.3. BCG Analysis
- 4.3.1. Stars (High Growth, High Market Share)
- 4.3.2. Cash Cows (Low Growth, High Market Share)
- 4.3.3. Question Mark (High Growth, Low Market Share)
- 4.3.4. Dogs (Low Growth, Low Market Share)
- 4.4. Ansoff Matrix Analysis
- 4.5. Supply Chain Analysis
- 4.6. Regulatory Landscape
- 4.7. Current Market Potential and Opportunity Assessment (TAM–SAM–SOM Framework)
- 4.8. PRI Analyst Note
- 4.1. Porters Five Forces
- 5. Market Analysis, Insights and Forecast 2021-2033
- 5.1. Market Analysis, Insights and Forecast - by Product Type
- 5.1.1. Frac Sand
- 5.1.2. Resin Coated
- 5.1.3. Ceramics
- 5.2. Market Analysis, Insights and Forecast - by Region
- 5.2.1. Asia Pacific
- 5.2.2. North America
- 5.2.3. Europe
- 5.2.4. South America
- 5.2.5. Middle East and Africa
- 5.1. Market Analysis, Insights and Forecast - by Product Type
- 6. Global Proppants Industry Analysis, Insights and Forecast, 2021-2033
- 6.1. Market Analysis, Insights and Forecast - by Product Type
- 6.1.1. Frac Sand
- 6.1.2. Resin Coated
- 6.1.3. Ceramics
- 6.1. Market Analysis, Insights and Forecast - by Product Type
- 7. Asia Pacific Proppants Industry Analysis, Insights and Forecast, 2020-2032
- 7.1. Market Analysis, Insights and Forecast - by Product Type
- 7.1.1. Frac Sand
- 7.1.2. Resin Coated
- 7.1.3. Ceramics
- 7.1. Market Analysis, Insights and Forecast - by Product Type
- 8. North America Proppants Industry Analysis, Insights and Forecast, 2020-2032
- 8.1. Market Analysis, Insights and Forecast - by Product Type
- 8.1.1. Frac Sand
- 8.1.2. Resin Coated
- 8.1.3. Ceramics
- 8.1. Market Analysis, Insights and Forecast - by Product Type
- 9. Europe Proppants Industry Analysis, Insights and Forecast, 2020-2032
- 9.1. Market Analysis, Insights and Forecast - by Product Type
- 9.1.1. Frac Sand
- 9.1.2. Resin Coated
- 9.1.3. Ceramics
- 9.1. Market Analysis, Insights and Forecast - by Product Type
- 10. South America Proppants Industry Analysis, Insights and Forecast, 2020-2032
- 10.1. Market Analysis, Insights and Forecast - by Product Type
- 10.1.1. Frac Sand
- 10.1.2. Resin Coated
- 10.1.3. Ceramics
- 10.1. Market Analysis, Insights and Forecast - by Product Type
- 11. Middle East and Africa Proppants Industry Analysis, Insights and Forecast, 2020-2032
- 11.1. Market Analysis, Insights and Forecast - by Product Type
- 11.1.1. Frac Sand
- 11.1.2. Resin Coated
- 11.1.3. Ceramics
- 11.1. Market Analysis, Insights and Forecast - by Product Type
- 12. Competitive Analysis
- 12.1. Company Profiles
- 12.1.1 Badger Mining Corporation
- 12.1.1.1. Company Overview
- 12.1.1.2. Products
- 12.1.1.3. Company Financials
- 12.1.1.4. SWOT Analysis
- 12.1.2 CARBO Ceramics Inc
- 12.1.2.1. Company Overview
- 12.1.2.2. Products
- 12.1.2.3. Company Financials
- 12.1.2.4. SWOT Analysis
- 12.1.3 China Ceramic Proppant (Guizhou) Ltd
- 12.1.3.1. Company Overview
- 12.1.3.2. Products
- 12.1.3.3. Company Financials
- 12.1.3.4. SWOT Analysis
- 12.1.4 ChangQing Proppant
- 12.1.4.1. Company Overview
- 12.1.4.2. Products
- 12.1.4.3. Company Financials
- 12.1.4.4. SWOT Analysis
- 12.1.5 CoorsTek Inc
- 12.1.5.1. Company Overview
- 12.1.5.2. Products
- 12.1.5.3. Company Financials
- 12.1.5.4. SWOT Analysis
- 12.1.6 Covia Holdings LLC
- 12.1.6.1. Company Overview
- 12.1.6.2. Products
- 12.1.6.3. Company Financials
- 12.1.6.4. SWOT Analysis
- 12.1.7 Eagle Materials Inc
- 12.1.7.1. Company Overview
- 12.1.7.2. Products
- 12.1.7.3. Company Financials
- 12.1.7.4. SWOT Analysis
- 12.1.8 Emerge Energy Services (Superior Silica Sands)
- 12.1.8.1. Company Overview
- 12.1.8.2. Products
- 12.1.8.3. Company Financials
- 12.1.8.4. SWOT Analysis
- 12.1.9 Epic Ceramic Proppants Inc
- 12.1.9.1. Company Overview
- 12.1.9.2. Products
- 12.1.9.3. Company Financials
- 12.1.9.4. SWOT Analysis
- 12.1.10 Fores LTD
- 12.1.10.1. Company Overview
- 12.1.10.2. Products
- 12.1.10.3. Company Financials
- 12.1.10.4. SWOT Analysis
- 12.1.11 General Electric (Baker Hughes Company)
- 12.1.11.1. Company Overview
- 12.1.11.2. Products
- 12.1.11.3. Company Financials
- 12.1.11.4. SWOT Analysis
- 12.1.12 Gongyi Yuanyang Ceramsite Co Ltd
- 12.1.12.1. Company Overview
- 12.1.12.2. Products
- 12.1.12.3. Company Financials
- 12.1.12.4. SWOT Analysis
- 12.1.13 Halliburton
- 12.1.13.1. Company Overview
- 12.1.13.2. Products
- 12.1.13.3. Company Financials
- 12.1.13.4. SWOT Analysis
- 12.1.14 Henan Tianxiang New Materials Co Ltd
- 12.1.14.1. Company Overview
- 12.1.14.2. Products
- 12.1.14.3. Company Financials
- 12.1.14.4. SWOT Analysis
- 12.1.15 Hexion
- 12.1.15.1. Company Overview
- 12.1.15.2. Products
- 12.1.15.3. Company Financials
- 12.1.15.4. SWOT Analysis
- 12.1.16 Nika Petrotech
- 12.1.16.1. Company Overview
- 12.1.16.2. Products
- 12.1.16.3. Company Financials
- 12.1.16.4. SWOT Analysis
- 12.1.17 Preferred Sands LLC
- 12.1.17.1. Company Overview
- 12.1.17.2. Products
- 12.1.17.3. Company Financials
- 12.1.17.4. SWOT Analysis
- 12.1.18 Saint-Gobain
- 12.1.18.1. Company Overview
- 12.1.18.2. Products
- 12.1.18.3. Company Financials
- 12.1.18.4. SWOT Analysis
- 12.1.19 Unimin Energy Solutions (Sibelco)
- 12.1.19.1. Company Overview
- 12.1.19.2. Products
- 12.1.19.3. Company Financials
- 12.1.19.4. SWOT Analysis
- 12.1.20 U S Silica
- 12.1.20.1. Company Overview
- 12.1.20.2. Products
- 12.1.20.3. Company Financials
- 12.1.20.4. SWOT Analysis
- 12.1.21 Wanli Proppant*List Not Exhaustive
- 12.1.21.1. Company Overview
- 12.1.21.2. Products
- 12.1.21.3. Company Financials
- 12.1.21.4. SWOT Analysis
- 12.1.1 Badger Mining Corporation
- 12.2. Market Entropy
- 12.2.1 Company's Key Areas Served
- 12.2.2 Recent Developments
- 12.3. Company Market Share Analysis 2025
- 12.3.1 Top 5 Companies Market Share Analysis
- 12.3.2 Top 3 Companies Market Share Analysis
- 12.4. List of Potential Customers
- 13. Research Methodology
List of Figures
- Figure 1: Global Proppants Industry Revenue Breakdown (billion, %) by Region 2025 & 2033
- Figure 2: Asia Pacific Proppants Industry Revenue (billion), by Product Type 2025 & 2033
- Figure 3: Asia Pacific Proppants Industry Revenue Share (%), by Product Type 2025 & 2033
- Figure 4: Asia Pacific Proppants Industry Revenue (billion), by Country 2025 & 2033
- Figure 5: Asia Pacific Proppants Industry Revenue Share (%), by Country 2025 & 2033
- Figure 6: North America Proppants Industry Revenue (billion), by Product Type 2025 & 2033
- Figure 7: North America Proppants Industry Revenue Share (%), by Product Type 2025 & 2033
- Figure 8: North America Proppants Industry Revenue (billion), by Country 2025 & 2033
- Figure 9: North America Proppants Industry Revenue Share (%), by Country 2025 & 2033
- Figure 10: Europe Proppants Industry Revenue (billion), by Product Type 2025 & 2033
- Figure 11: Europe Proppants Industry Revenue Share (%), by Product Type 2025 & 2033
- Figure 12: Europe Proppants Industry Revenue (billion), by Country 2025 & 2033
- Figure 13: Europe Proppants Industry Revenue Share (%), by Country 2025 & 2033
- Figure 14: South America Proppants Industry Revenue (billion), by Product Type 2025 & 2033
- Figure 15: South America Proppants Industry Revenue Share (%), by Product Type 2025 & 2033
- Figure 16: South America Proppants Industry Revenue (billion), by Country 2025 & 2033
- Figure 17: South America Proppants Industry Revenue Share (%), by Country 2025 & 2033
- Figure 18: Middle East and Africa Proppants Industry Revenue (billion), by Product Type 2025 & 2033
- Figure 19: Middle East and Africa Proppants Industry Revenue Share (%), by Product Type 2025 & 2033
- Figure 20: Middle East and Africa Proppants Industry Revenue (billion), by Country 2025 & 2033
- Figure 21: Middle East and Africa Proppants Industry Revenue Share (%), by Country 2025 & 2033
List of Tables
- Table 1: Global Proppants Industry Revenue billion Forecast, by Product Type 2020 & 2033
- Table 2: Global Proppants Industry Revenue billion Forecast, by Region 2020 & 2033
- Table 3: Global Proppants Industry Revenue billion Forecast, by Product Type 2020 & 2033
- Table 4: Global Proppants Industry Revenue billion Forecast, by Country 2020 & 2033
- Table 5: China Proppants Industry Revenue (billion) Forecast, by Application 2020 & 2033
- Table 6: India Proppants Industry Revenue (billion) Forecast, by Application 2020 & 2033
- Table 7: Indonesia Proppants Industry Revenue (billion) Forecast, by Application 2020 & 2033
- Table 8: Malaysia Proppants Industry Revenue (billion) Forecast, by Application 2020 & 2033
- Table 9: Thailand Proppants Industry Revenue (billion) Forecast, by Application 2020 & 2033
- Table 10: Vietnam Proppants Industry Revenue (billion) Forecast, by Application 2020 & 2033
- Table 11: Rest of Asia Pacific Proppants Industry Revenue (billion) Forecast, by Application 2020 & 2033
- Table 12: Global Proppants Industry Revenue billion Forecast, by Product Type 2020 & 2033
- Table 13: Global Proppants Industry Revenue billion Forecast, by Country 2020 & 2033
- Table 14: United States Proppants Industry Revenue (billion) Forecast, by Application 2020 & 2033
- Table 15: Canada Proppants Industry Revenue (billion) Forecast, by Application 2020 & 2033
- Table 16: Mexico Proppants Industry Revenue (billion) Forecast, by Application 2020 & 2033
- Table 17: Global Proppants Industry Revenue billion Forecast, by Product Type 2020 & 2033
- Table 18: Global Proppants Industry Revenue billion Forecast, by Country 2020 & 2033
- Table 19: Germany Proppants Industry Revenue (billion) Forecast, by Application 2020 & 2033
- Table 20: United Kingdom Proppants Industry Revenue (billion) Forecast, by Application 2020 & 2033
- Table 21: Russia Proppants Industry Revenue (billion) Forecast, by Application 2020 & 2033
- Table 22: Norway Proppants Industry Revenue (billion) Forecast, by Application 2020 & 2033
- Table 23: Rest of Europe Proppants Industry Revenue (billion) Forecast, by Application 2020 & 2033
- Table 24: Global Proppants Industry Revenue billion Forecast, by Product Type 2020 & 2033
- Table 25: Global Proppants Industry Revenue billion Forecast, by Country 2020 & 2033
- Table 26: Brazil Proppants Industry Revenue (billion) Forecast, by Application 2020 & 2033
- Table 27: Argentina Proppants Industry Revenue (billion) Forecast, by Application 2020 & 2033
- Table 28: Rest of South America Proppants Industry Revenue (billion) Forecast, by Application 2020 & 2033
- Table 29: Global Proppants Industry Revenue billion Forecast, by Product Type 2020 & 2033
- Table 30: Global Proppants Industry Revenue billion Forecast, by Country 2020 & 2033
- Table 31: Saudi Arabia Proppants Industry Revenue (billion) Forecast, by Application 2020 & 2033
- Table 32: South Africa Proppants Industry Revenue (billion) Forecast, by Application 2020 & 2033
- Table 33: Rest of Middle East and Africa Proppants Industry Revenue (billion) Forecast, by Application 2020 & 2033
Frequently Asked Questions
1. What is the projected Compound Annual Growth Rate (CAGR) of the Proppants Industry?
The projected CAGR is approximately 9.97%.
2. Which companies are prominent players in the Proppants Industry?
Key companies in the market include Badger Mining Corporation, CARBO Ceramics Inc, China Ceramic Proppant (Guizhou) Ltd, ChangQing Proppant, CoorsTek Inc, Covia Holdings LLC, Eagle Materials Inc, Emerge Energy Services (Superior Silica Sands), Epic Ceramic Proppants Inc, Fores LTD, General Electric (Baker Hughes Company), Gongyi Yuanyang Ceramsite Co Ltd, Halliburton, Henan Tianxiang New Materials Co Ltd, Hexion, Nika Petrotech, Preferred Sands LLC, Saint-Gobain, Unimin Energy Solutions (Sibelco), U S Silica, Wanli Proppant*List Not Exhaustive.
3. What are the main segments of the Proppants Industry?
The market segments include Product Type.
4. Can you provide details about the market size?
The market size is estimated to be USD 8.902 billion as of 2022.
5. What are some drivers contributing to market growth?
Improvements in Fracking Technology; Increasing Shale Gas Production Activities.
6. What are the notable trends driving market growth?
Frac Sand Segment Expected to Dominate the Market.
7. Are there any restraints impacting market growth?
Improvements in Fracking Technology; Increasing Shale Gas Production Activities.
8. Can you provide examples of recent developments in the market?
May 2022: CARBO Ceramics Inc. announced the acquisition of Pinnacle Technologies Inc., which provides fracture diagnostic services, fracture mapping services, and fracture simulation models. It will enhance the company's product portfolio for the proppants market.
9. What pricing options are available for accessing the report?
Pricing options include single-user, multi-user, and enterprise licenses priced at USD 4750, USD 5250, and USD 8750 respectively.
10. Is the market size provided in terms of value or volume?
The market size is provided in terms of value, measured in billion.
11. Are there any specific market keywords associated with the report?
Yes, the market keyword associated with the report is "Proppants Industry," which aids in identifying and referencing the specific market segment covered.
12. How do I determine which pricing option suits my needs best?
The pricing options vary based on user requirements and access needs. Individual users may opt for single-user licenses, while businesses requiring broader access may choose multi-user or enterprise licenses for cost-effective access to the report.
13. Are there any additional resources or data provided in the Proppants Industry report?
While the report offers comprehensive insights, it's advisable to review the specific contents or supplementary materials provided to ascertain if additional resources or data are available.
14. How can I stay updated on further developments or reports in the Proppants Industry?
To stay informed about further developments, trends, and reports in the Proppants Industry, consider subscribing to industry newsletters, following relevant companies and organizations, or regularly checking reputable industry news sources and publications.
Methodology
Step 1 - Identification of Relevant Samples Size from Population Database


Step 2 - Approaches for Defining Global Market Size (Value, Volume* & Price*)

Note*: In applicable scenarios
Step 3 - Data Sources
Primary Research
- Web Analytics
- Survey Reports
- Research Institute
- Latest Research Reports
- Opinion Leaders
Secondary Research
- Annual Reports
- White Paper
- Latest Press Release
- Industry Association
- Paid Database
- Investor Presentations

Step 4 - Data Triangulation
Involves using different sources of information in order to increase the validity of a study
These sources are likely to be stakeholders in a program - participants, other researchers, program staff, other community members, and so on.
Then we put all data in single framework & apply various statistical tools to find out the dynamic on the market.
During the analysis stage, feedback from the stakeholder groups would be compared to determine areas of agreement as well as areas of divergence