Key Insights
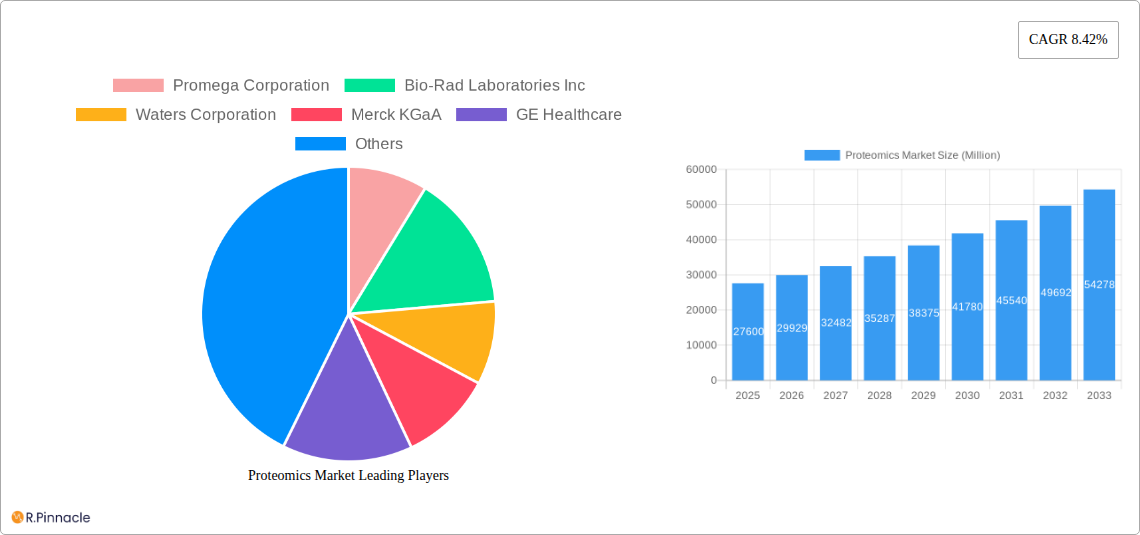
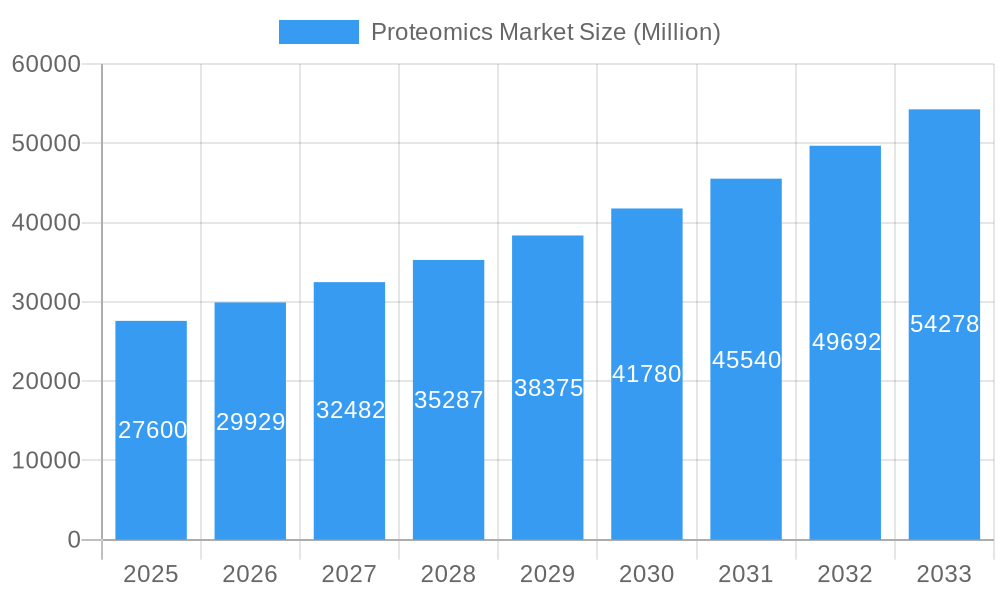
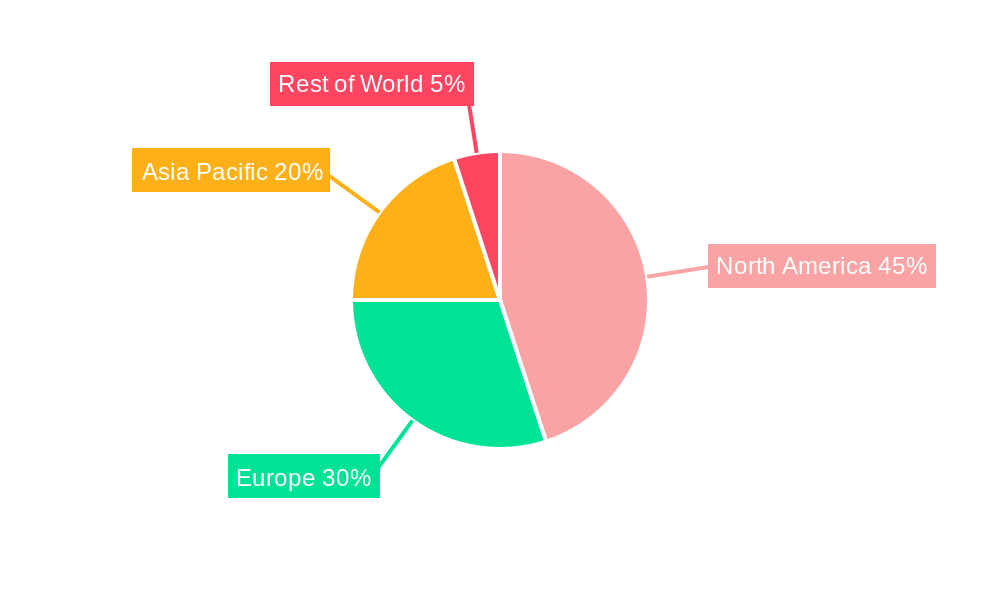
The global proteomics market, valued at $27.60 billion in 2025, is projected to experience robust growth, driven by the increasing prevalence of chronic diseases necessitating advanced diagnostic tools, the rising demand for personalized medicine, and significant advancements in proteomics technologies. This expanding market is segmented by product and services (instrumentation technology, reagents, software, and services) and applications (clinical diagnostics, drug discovery, and other applications). The strong CAGR of 8.42% indicates a substantial market expansion over the forecast period (2025-2033). Key players like Promega, Bio-Rad, Waters, Merck KGaA, and Thermo Fisher Scientific are driving innovation and competition, continually enhancing the sensitivity, speed, and affordability of proteomics technologies. The North American market currently holds a significant share, due to substantial research investments and the presence of key players, but regions like Asia-Pacific are expected to witness rapid growth fueled by expanding healthcare infrastructure and increasing awareness of proteomics applications. Growth is further stimulated by the continuous development of novel applications in areas such as biomarker discovery, disease diagnosis, and drug development.
Proteomics Market Market Size (In Billion)
The market's growth trajectory is influenced by several factors. Technological advancements, particularly in mass spectrometry and chromatography, are continuously improving the accuracy and efficiency of proteomic analysis. Simultaneously, decreasing costs of these technologies are making them more accessible to a wider range of research institutions and clinical laboratories. However, the market faces challenges including the complexity of proteomic data analysis and the need for highly skilled professionals to interpret results. Despite these restraints, the ongoing development of sophisticated bioinformatics tools and the growing collaboration between researchers and technology developers are anticipated to mitigate these challenges and facilitate broader market penetration. The long-term outlook for the proteomics market remains extremely positive, driven by its crucial role in transforming healthcare and life sciences research.
Proteomics Market Company Market Share
Proteomics Market: A Comprehensive Report (2019-2033)
This in-depth report provides a comprehensive analysis of the global Proteomics Market, offering invaluable insights for industry professionals, investors, and researchers. Covering the period from 2019 to 2033, with a base year of 2025, this report forecasts robust market growth, driven by technological advancements and increasing demand across diverse applications. The market is estimated at xx Million in 2025 and projected to reach xx Million by 2033, exhibiting a CAGR of xx%.
Proteomics Market Structure & Innovation Trends
The Proteomics market exhibits a moderately consolidated structure, with key players like Thermo Fisher Scientific Inc, Danaher Corporation, and Promega Corporation holding significant market share (estimated at xx% collectively in 2025). Innovation is primarily driven by advancements in mass spectrometry, chromatography, and bioinformatics. Stringent regulatory frameworks, particularly in clinical diagnostics, influence market dynamics. Product substitution is limited due to the specialized nature of proteomics technologies. The end-user demographics are diverse, encompassing pharmaceutical companies, academic institutions, and clinical diagnostic labs. M&A activity has been moderate, with deal values averaging xx Million in the past five years. Notable transactions include (list specific examples if available, otherwise state "Specific deal details are unavailable").
Proteomics Market Dynamics & Trends
The Proteomics market is experiencing significant growth fueled by the increasing prevalence of chronic diseases, the rising demand for personalized medicine, and substantial investments in research and development. Technological disruptions, particularly in high-throughput screening and data analysis, are accelerating market expansion. Consumer preferences are shifting towards more efficient, cost-effective, and user-friendly proteomics platforms. Competitive dynamics are characterized by continuous innovation, strategic partnerships, and a focus on expanding market access. The market penetration rate for proteomics technologies in clinical diagnostics is estimated at xx% in 2025, with substantial growth potential in emerging economies.
Dominant Regions & Segments in Proteomics Market
Leading Region: North America currently dominates the Proteomics market, driven by strong R&D investment and the presence of major players. Key drivers include robust healthcare infrastructure, favorable regulatory environments, and high healthcare expenditure. Europe follows as a significant market, while Asia-Pacific is projected to experience the fastest growth rate during the forecast period, fueled by expanding healthcare budgets and growing awareness of proteomics applications.
Dominant Segments:
- Product & Services: Instrumentation Technology currently holds the largest market share, driven by continuous improvements in mass spectrometry and chromatography technologies. Reagents, software, and services are also experiencing substantial growth, reflecting the increasing demand for comprehensive proteomics solutions.
- Application: Clinical diagnostics is a major application segment, with growing adoption of proteomics for disease diagnosis and biomarker discovery. Drug discovery is another significant segment, utilizing proteomics for target identification and validation. Other applications, including agricultural and environmental proteomics, are gaining traction.
The detailed dominance analysis shows a strong correlation between high R&D spending and market leadership. Government initiatives promoting personalized medicine further boost the market in key regions.
Proteomics Market Product Innovations
Recent advancements include the development of miniaturized proteomics platforms, improved software for data analysis, and novel reagents for enhanced sensitivity and specificity. These innovations offer enhanced throughput, reduced costs, and improved accuracy, making proteomics more accessible to a broader range of users. The market is witnessing a shift towards integrated solutions combining instrumentation, reagents, and software for streamlined workflows. This trend is driving market consolidation and creating new opportunities for specialized service providers.
Report Scope & Segmentation Analysis
This report segments the Proteomics market based on Product & Services (Instrumentation Technology, Other Instrumentation Technologies: Reagents, Software, and Services) and Application (Clinical Diagnostics, Drug Discovery, Other Applications). Each segment is analyzed in detail, providing insights into market size, growth projections, and competitive dynamics. The Instrumentation Technology segment is expected to maintain its dominance, while the reagents, software, and services segment is projected to exhibit the highest growth rate. Clinical diagnostics and drug discovery applications are the leading segments in terms of market size, with potential growth in other applications in the coming years.
Key Drivers of Proteomics Market Growth
Technological advancements in mass spectrometry, chromatography, and bioinformatics are key drivers, alongside the increasing prevalence of chronic diseases and the growing demand for personalized medicine. Government funding for proteomics research and the development of novel proteomics-based diagnostic tools further accelerate market growth.
Challenges in the Proteomics Market Sector
High initial investment costs for instrumentation and software can be a significant barrier for smaller companies and research labs. The complexity of data analysis and the need for skilled personnel pose another challenge. Furthermore, stringent regulatory requirements in the clinical diagnostics sector can slow market penetration. The supply chain disruptions related to critical components, such as specialized reagents, can affect market stability.
Emerging Opportunities in Proteomics Market
The growing demand for point-of-care diagnostics, the increasing use of proteomics in personalized oncology, and the expanding applications in agricultural and environmental sciences represent significant opportunities for market expansion. The development of novel bioinformatics tools and the integration of artificial intelligence are poised to transform data analysis and interpretation, driving further innovation and growth.
Leading Players in the Proteomics Market Market
- Promega Corporation
- Bio-Rad Laboratories Inc
- Waters Corporation
- Merck KGaA
- GE Healthcare
- Thermo Fisher Scientific Inc
- Danaher Corporation
- Agilent Technologies Inc
- Bruker Corporation
Key Developments in Proteomics Market Industry
- 2023-07: Thermo Fisher Scientific launched a new mass spectrometer, significantly improving sensitivity and throughput.
- 2022-11: Promega Corporation announced a partnership to develop novel reagents for clinical diagnostics.
- (Add further bullet points for other developments, specifying year and month. If details are unavailable, replace with "Further details unavailable".)
Future Outlook for Proteomics Market Market
The Proteomics market is poised for continued expansion, driven by technological advancements, rising healthcare expenditure, and growing demand for personalized medicine. Strategic partnerships, focused R&D investments, and expanding market access in emerging economies are expected to create significant growth opportunities in the coming years. The integration of artificial intelligence and machine learning in data analysis will further accelerate market expansion.
Proteomics Market Segmentation
-
1. Product & Services
-
1.1. Instrumentation Technology
- 1.1.1. Spectroscopy
- 1.1.2. Chromatography
- 1.1.3. Electrophoresis
- 1.1.4. Protein Microarrays
- 1.1.5. X-Ray Crystallography
- 1.1.6. Other Instrumentation Technologies
- 1.2. Reagents
- 1.3. Software and Services
-
1.1. Instrumentation Technology
-
2. Application
- 2.1. Clinical Diagnostics
- 2.2. Drug Discovery
- 2.3. Other Applications
Proteomics Market Segmentation By Geography
-
1. North America
- 1.1. United States
- 1.2. Canada
- 1.3. Mexico
-
2. Europe
- 2.1. Germany
- 2.2. United Kingdom
- 2.3. France
- 2.4. Italy
- 2.5. Spain
- 2.6. Rest of Europe
-
3. Asia Pacific
- 3.1. China
- 3.2. Japan
- 3.3. India
- 3.4. Australia
- 3.5. South Korea
- 3.6. Rest of Asia Pacific
- 4. Middle East
-
5. GCC
- 5.1. South Africa
- 5.2. Rest of Middle East
-
6. South America
- 6.1. Brazil
- 6.2. Argentina
- 6.3. Rest of South America
Proteomics Market Regional Market Share
Geographic Coverage of Proteomics Market
Proteomics Market REPORT HIGHLIGHTS
| Aspects | Details |
|---|---|
| Study Period | 2020-2034 |
| Base Year | 2025 |
| Estimated Year | 2026 |
| Forecast Period | 2026-2034 |
| Historical Period | 2020-2025 |
| Growth Rate | CAGR of 8.42% from 2020-2034 |
| Segmentation |
|
Table of Contents
- 1. Introduction
- 1.1. Research Scope
- 1.2. Market Segmentation
- 1.3. Research Methodology
- 1.4. Definitions and Assumptions
- 2. Executive Summary
- 2.1. Introduction
- 3. Market Dynamics
- 3.1. Introduction
- 3.2. Market Drivers
- 3.2.1. Rising Demand for Personalized Medicine; Increasing R&D Expenditure and Government Funding for Proteomics; Technological Advancements
- 3.3. Market Restrains
- 3.3.1. High Cost of Instruments
- 3.4. Market Trends
- 3.4.1. Drug Discovery is Expected to Witness Healthy CAGR in Future
- 4. Market Factor Analysis
- 4.1. Porters Five Forces
- 4.2. Supply/Value Chain
- 4.3. PESTEL analysis
- 4.4. Market Entropy
- 4.5. Patent/Trademark Analysis
- 5. Global Proteomics Market Analysis, Insights and Forecast, 2020-2032
- 5.1. Market Analysis, Insights and Forecast - by Product & Services
- 5.1.1. Instrumentation Technology
- 5.1.1.1. Spectroscopy
- 5.1.1.2. Chromatography
- 5.1.1.3. Electrophoresis
- 5.1.1.4. Protein Microarrays
- 5.1.1.5. X-Ray Crystallography
- 5.1.1.6. Other Instrumentation Technologies
- 5.1.2. Reagents
- 5.1.3. Software and Services
- 5.1.1. Instrumentation Technology
- 5.2. Market Analysis, Insights and Forecast - by Application
- 5.2.1. Clinical Diagnostics
- 5.2.2. Drug Discovery
- 5.2.3. Other Applications
- 5.3. Market Analysis, Insights and Forecast - by Region
- 5.3.1. North America
- 5.3.2. Europe
- 5.3.3. Asia Pacific
- 5.3.4. Middle East
- 5.3.5. GCC
- 5.3.6. South America
- 5.1. Market Analysis, Insights and Forecast - by Product & Services
- 6. North America Proteomics Market Analysis, Insights and Forecast, 2020-2032
- 6.1. Market Analysis, Insights and Forecast - by Product & Services
- 6.1.1. Instrumentation Technology
- 6.1.1.1. Spectroscopy
- 6.1.1.2. Chromatography
- 6.1.1.3. Electrophoresis
- 6.1.1.4. Protein Microarrays
- 6.1.1.5. X-Ray Crystallography
- 6.1.1.6. Other Instrumentation Technologies
- 6.1.2. Reagents
- 6.1.3. Software and Services
- 6.1.1. Instrumentation Technology
- 6.2. Market Analysis, Insights and Forecast - by Application
- 6.2.1. Clinical Diagnostics
- 6.2.2. Drug Discovery
- 6.2.3. Other Applications
- 6.1. Market Analysis, Insights and Forecast - by Product & Services
- 7. Europe Proteomics Market Analysis, Insights and Forecast, 2020-2032
- 7.1. Market Analysis, Insights and Forecast - by Product & Services
- 7.1.1. Instrumentation Technology
- 7.1.1.1. Spectroscopy
- 7.1.1.2. Chromatography
- 7.1.1.3. Electrophoresis
- 7.1.1.4. Protein Microarrays
- 7.1.1.5. X-Ray Crystallography
- 7.1.1.6. Other Instrumentation Technologies
- 7.1.2. Reagents
- 7.1.3. Software and Services
- 7.1.1. Instrumentation Technology
- 7.2. Market Analysis, Insights and Forecast - by Application
- 7.2.1. Clinical Diagnostics
- 7.2.2. Drug Discovery
- 7.2.3. Other Applications
- 7.1. Market Analysis, Insights and Forecast - by Product & Services
- 8. Asia Pacific Proteomics Market Analysis, Insights and Forecast, 2020-2032
- 8.1. Market Analysis, Insights and Forecast - by Product & Services
- 8.1.1. Instrumentation Technology
- 8.1.1.1. Spectroscopy
- 8.1.1.2. Chromatography
- 8.1.1.3. Electrophoresis
- 8.1.1.4. Protein Microarrays
- 8.1.1.5. X-Ray Crystallography
- 8.1.1.6. Other Instrumentation Technologies
- 8.1.2. Reagents
- 8.1.3. Software and Services
- 8.1.1. Instrumentation Technology
- 8.2. Market Analysis, Insights and Forecast - by Application
- 8.2.1. Clinical Diagnostics
- 8.2.2. Drug Discovery
- 8.2.3. Other Applications
- 8.1. Market Analysis, Insights and Forecast - by Product & Services
- 9. Middle East Proteomics Market Analysis, Insights and Forecast, 2020-2032
- 9.1. Market Analysis, Insights and Forecast - by Product & Services
- 9.1.1. Instrumentation Technology
- 9.1.1.1. Spectroscopy
- 9.1.1.2. Chromatography
- 9.1.1.3. Electrophoresis
- 9.1.1.4. Protein Microarrays
- 9.1.1.5. X-Ray Crystallography
- 9.1.1.6. Other Instrumentation Technologies
- 9.1.2. Reagents
- 9.1.3. Software and Services
- 9.1.1. Instrumentation Technology
- 9.2. Market Analysis, Insights and Forecast - by Application
- 9.2.1. Clinical Diagnostics
- 9.2.2. Drug Discovery
- 9.2.3. Other Applications
- 9.1. Market Analysis, Insights and Forecast - by Product & Services
- 10. GCC Proteomics Market Analysis, Insights and Forecast, 2020-2032
- 10.1. Market Analysis, Insights and Forecast - by Product & Services
- 10.1.1. Instrumentation Technology
- 10.1.1.1. Spectroscopy
- 10.1.1.2. Chromatography
- 10.1.1.3. Electrophoresis
- 10.1.1.4. Protein Microarrays
- 10.1.1.5. X-Ray Crystallography
- 10.1.1.6. Other Instrumentation Technologies
- 10.1.2. Reagents
- 10.1.3. Software and Services
- 10.1.1. Instrumentation Technology
- 10.2. Market Analysis, Insights and Forecast - by Application
- 10.2.1. Clinical Diagnostics
- 10.2.2. Drug Discovery
- 10.2.3. Other Applications
- 10.1. Market Analysis, Insights and Forecast - by Product & Services
- 11. South America Proteomics Market Analysis, Insights and Forecast, 2020-2032
- 11.1. Market Analysis, Insights and Forecast - by Product & Services
- 11.1.1. Instrumentation Technology
- 11.1.1.1. Spectroscopy
- 11.1.1.2. Chromatography
- 11.1.1.3. Electrophoresis
- 11.1.1.4. Protein Microarrays
- 11.1.1.5. X-Ray Crystallography
- 11.1.1.6. Other Instrumentation Technologies
- 11.1.2. Reagents
- 11.1.3. Software and Services
- 11.1.1. Instrumentation Technology
- 11.2. Market Analysis, Insights and Forecast - by Application
- 11.2.1. Clinical Diagnostics
- 11.2.2. Drug Discovery
- 11.2.3. Other Applications
- 11.1. Market Analysis, Insights and Forecast - by Product & Services
- 12. Competitive Analysis
- 12.1. Global Market Share Analysis 2025
- 12.2. Company Profiles
- 12.2.1 Promega Corporation
- 12.2.1.1. Overview
- 12.2.1.2. Products
- 12.2.1.3. SWOT Analysis
- 12.2.1.4. Recent Developments
- 12.2.1.5. Financials (Based on Availability)
- 12.2.2 Bio-Rad Laboratories Inc
- 12.2.2.1. Overview
- 12.2.2.2. Products
- 12.2.2.3. SWOT Analysis
- 12.2.2.4. Recent Developments
- 12.2.2.5. Financials (Based on Availability)
- 12.2.3 Waters Corporation
- 12.2.3.1. Overview
- 12.2.3.2. Products
- 12.2.3.3. SWOT Analysis
- 12.2.3.4. Recent Developments
- 12.2.3.5. Financials (Based on Availability)
- 12.2.4 Merck KGaA
- 12.2.4.1. Overview
- 12.2.4.2. Products
- 12.2.4.3. SWOT Analysis
- 12.2.4.4. Recent Developments
- 12.2.4.5. Financials (Based on Availability)
- 12.2.5 GE Healthcare
- 12.2.5.1. Overview
- 12.2.5.2. Products
- 12.2.5.3. SWOT Analysis
- 12.2.5.4. Recent Developments
- 12.2.5.5. Financials (Based on Availability)
- 12.2.6 Thermo Fisher Scientific Inc
- 12.2.6.1. Overview
- 12.2.6.2. Products
- 12.2.6.3. SWOT Analysis
- 12.2.6.4. Recent Developments
- 12.2.6.5. Financials (Based on Availability)
- 12.2.7 Danaher Corporation
- 12.2.7.1. Overview
- 12.2.7.2. Products
- 12.2.7.3. SWOT Analysis
- 12.2.7.4. Recent Developments
- 12.2.7.5. Financials (Based on Availability)
- 12.2.8 Agilent Technologies Inc
- 12.2.8.1. Overview
- 12.2.8.2. Products
- 12.2.8.3. SWOT Analysis
- 12.2.8.4. Recent Developments
- 12.2.8.5. Financials (Based on Availability)
- 12.2.9 Bruker Corporation
- 12.2.9.1. Overview
- 12.2.9.2. Products
- 12.2.9.3. SWOT Analysis
- 12.2.9.4. Recent Developments
- 12.2.9.5. Financials (Based on Availability)
- 12.2.1 Promega Corporation
List of Figures
- Figure 1: Global Proteomics Market Revenue Breakdown (Million, %) by Region 2025 & 2033
- Figure 2: Global Proteomics Market Volume Breakdown (K Unit, %) by Region 2025 & 2033
- Figure 3: North America Proteomics Market Revenue (Million), by Product & Services 2025 & 2033
- Figure 4: North America Proteomics Market Volume (K Unit), by Product & Services 2025 & 2033
- Figure 5: North America Proteomics Market Revenue Share (%), by Product & Services 2025 & 2033
- Figure 6: North America Proteomics Market Volume Share (%), by Product & Services 2025 & 2033
- Figure 7: North America Proteomics Market Revenue (Million), by Application 2025 & 2033
- Figure 8: North America Proteomics Market Volume (K Unit), by Application 2025 & 2033
- Figure 9: North America Proteomics Market Revenue Share (%), by Application 2025 & 2033
- Figure 10: North America Proteomics Market Volume Share (%), by Application 2025 & 2033
- Figure 11: North America Proteomics Market Revenue (Million), by Country 2025 & 2033
- Figure 12: North America Proteomics Market Volume (K Unit), by Country 2025 & 2033
- Figure 13: North America Proteomics Market Revenue Share (%), by Country 2025 & 2033
- Figure 14: North America Proteomics Market Volume Share (%), by Country 2025 & 2033
- Figure 15: Europe Proteomics Market Revenue (Million), by Product & Services 2025 & 2033
- Figure 16: Europe Proteomics Market Volume (K Unit), by Product & Services 2025 & 2033
- Figure 17: Europe Proteomics Market Revenue Share (%), by Product & Services 2025 & 2033
- Figure 18: Europe Proteomics Market Volume Share (%), by Product & Services 2025 & 2033
- Figure 19: Europe Proteomics Market Revenue (Million), by Application 2025 & 2033
- Figure 20: Europe Proteomics Market Volume (K Unit), by Application 2025 & 2033
- Figure 21: Europe Proteomics Market Revenue Share (%), by Application 2025 & 2033
- Figure 22: Europe Proteomics Market Volume Share (%), by Application 2025 & 2033
- Figure 23: Europe Proteomics Market Revenue (Million), by Country 2025 & 2033
- Figure 24: Europe Proteomics Market Volume (K Unit), by Country 2025 & 2033
- Figure 25: Europe Proteomics Market Revenue Share (%), by Country 2025 & 2033
- Figure 26: Europe Proteomics Market Volume Share (%), by Country 2025 & 2033
- Figure 27: Asia Pacific Proteomics Market Revenue (Million), by Product & Services 2025 & 2033
- Figure 28: Asia Pacific Proteomics Market Volume (K Unit), by Product & Services 2025 & 2033
- Figure 29: Asia Pacific Proteomics Market Revenue Share (%), by Product & Services 2025 & 2033
- Figure 30: Asia Pacific Proteomics Market Volume Share (%), by Product & Services 2025 & 2033
- Figure 31: Asia Pacific Proteomics Market Revenue (Million), by Application 2025 & 2033
- Figure 32: Asia Pacific Proteomics Market Volume (K Unit), by Application 2025 & 2033
- Figure 33: Asia Pacific Proteomics Market Revenue Share (%), by Application 2025 & 2033
- Figure 34: Asia Pacific Proteomics Market Volume Share (%), by Application 2025 & 2033
- Figure 35: Asia Pacific Proteomics Market Revenue (Million), by Country 2025 & 2033
- Figure 36: Asia Pacific Proteomics Market Volume (K Unit), by Country 2025 & 2033
- Figure 37: Asia Pacific Proteomics Market Revenue Share (%), by Country 2025 & 2033
- Figure 38: Asia Pacific Proteomics Market Volume Share (%), by Country 2025 & 2033
- Figure 39: Middle East Proteomics Market Revenue (Million), by Product & Services 2025 & 2033
- Figure 40: Middle East Proteomics Market Volume (K Unit), by Product & Services 2025 & 2033
- Figure 41: Middle East Proteomics Market Revenue Share (%), by Product & Services 2025 & 2033
- Figure 42: Middle East Proteomics Market Volume Share (%), by Product & Services 2025 & 2033
- Figure 43: Middle East Proteomics Market Revenue (Million), by Application 2025 & 2033
- Figure 44: Middle East Proteomics Market Volume (K Unit), by Application 2025 & 2033
- Figure 45: Middle East Proteomics Market Revenue Share (%), by Application 2025 & 2033
- Figure 46: Middle East Proteomics Market Volume Share (%), by Application 2025 & 2033
- Figure 47: Middle East Proteomics Market Revenue (Million), by Country 2025 & 2033
- Figure 48: Middle East Proteomics Market Volume (K Unit), by Country 2025 & 2033
- Figure 49: Middle East Proteomics Market Revenue Share (%), by Country 2025 & 2033
- Figure 50: Middle East Proteomics Market Volume Share (%), by Country 2025 & 2033
- Figure 51: GCC Proteomics Market Revenue (Million), by Product & Services 2025 & 2033
- Figure 52: GCC Proteomics Market Volume (K Unit), by Product & Services 2025 & 2033
- Figure 53: GCC Proteomics Market Revenue Share (%), by Product & Services 2025 & 2033
- Figure 54: GCC Proteomics Market Volume Share (%), by Product & Services 2025 & 2033
- Figure 55: GCC Proteomics Market Revenue (Million), by Application 2025 & 2033
- Figure 56: GCC Proteomics Market Volume (K Unit), by Application 2025 & 2033
- Figure 57: GCC Proteomics Market Revenue Share (%), by Application 2025 & 2033
- Figure 58: GCC Proteomics Market Volume Share (%), by Application 2025 & 2033
- Figure 59: GCC Proteomics Market Revenue (Million), by Country 2025 & 2033
- Figure 60: GCC Proteomics Market Volume (K Unit), by Country 2025 & 2033
- Figure 61: GCC Proteomics Market Revenue Share (%), by Country 2025 & 2033
- Figure 62: GCC Proteomics Market Volume Share (%), by Country 2025 & 2033
- Figure 63: South America Proteomics Market Revenue (Million), by Product & Services 2025 & 2033
- Figure 64: South America Proteomics Market Volume (K Unit), by Product & Services 2025 & 2033
- Figure 65: South America Proteomics Market Revenue Share (%), by Product & Services 2025 & 2033
- Figure 66: South America Proteomics Market Volume Share (%), by Product & Services 2025 & 2033
- Figure 67: South America Proteomics Market Revenue (Million), by Application 2025 & 2033
- Figure 68: South America Proteomics Market Volume (K Unit), by Application 2025 & 2033
- Figure 69: South America Proteomics Market Revenue Share (%), by Application 2025 & 2033
- Figure 70: South America Proteomics Market Volume Share (%), by Application 2025 & 2033
- Figure 71: South America Proteomics Market Revenue (Million), by Country 2025 & 2033
- Figure 72: South America Proteomics Market Volume (K Unit), by Country 2025 & 2033
- Figure 73: South America Proteomics Market Revenue Share (%), by Country 2025 & 2033
- Figure 74: South America Proteomics Market Volume Share (%), by Country 2025 & 2033
List of Tables
- Table 1: Global Proteomics Market Revenue Million Forecast, by Product & Services 2020 & 2033
- Table 2: Global Proteomics Market Volume K Unit Forecast, by Product & Services 2020 & 2033
- Table 3: Global Proteomics Market Revenue Million Forecast, by Application 2020 & 2033
- Table 4: Global Proteomics Market Volume K Unit Forecast, by Application 2020 & 2033
- Table 5: Global Proteomics Market Revenue Million Forecast, by Region 2020 & 2033
- Table 6: Global Proteomics Market Volume K Unit Forecast, by Region 2020 & 2033
- Table 7: Global Proteomics Market Revenue Million Forecast, by Product & Services 2020 & 2033
- Table 8: Global Proteomics Market Volume K Unit Forecast, by Product & Services 2020 & 2033
- Table 9: Global Proteomics Market Revenue Million Forecast, by Application 2020 & 2033
- Table 10: Global Proteomics Market Volume K Unit Forecast, by Application 2020 & 2033
- Table 11: Global Proteomics Market Revenue Million Forecast, by Country 2020 & 2033
- Table 12: Global Proteomics Market Volume K Unit Forecast, by Country 2020 & 2033
- Table 13: United States Proteomics Market Revenue (Million) Forecast, by Application 2020 & 2033
- Table 14: United States Proteomics Market Volume (K Unit) Forecast, by Application 2020 & 2033
- Table 15: Canada Proteomics Market Revenue (Million) Forecast, by Application 2020 & 2033
- Table 16: Canada Proteomics Market Volume (K Unit) Forecast, by Application 2020 & 2033
- Table 17: Mexico Proteomics Market Revenue (Million) Forecast, by Application 2020 & 2033
- Table 18: Mexico Proteomics Market Volume (K Unit) Forecast, by Application 2020 & 2033
- Table 19: Global Proteomics Market Revenue Million Forecast, by Product & Services 2020 & 2033
- Table 20: Global Proteomics Market Volume K Unit Forecast, by Product & Services 2020 & 2033
- Table 21: Global Proteomics Market Revenue Million Forecast, by Application 2020 & 2033
- Table 22: Global Proteomics Market Volume K Unit Forecast, by Application 2020 & 2033
- Table 23: Global Proteomics Market Revenue Million Forecast, by Country 2020 & 2033
- Table 24: Global Proteomics Market Volume K Unit Forecast, by Country 2020 & 2033
- Table 25: Germany Proteomics Market Revenue (Million) Forecast, by Application 2020 & 2033
- Table 26: Germany Proteomics Market Volume (K Unit) Forecast, by Application 2020 & 2033
- Table 27: United Kingdom Proteomics Market Revenue (Million) Forecast, by Application 2020 & 2033
- Table 28: United Kingdom Proteomics Market Volume (K Unit) Forecast, by Application 2020 & 2033
- Table 29: France Proteomics Market Revenue (Million) Forecast, by Application 2020 & 2033
- Table 30: France Proteomics Market Volume (K Unit) Forecast, by Application 2020 & 2033
- Table 31: Italy Proteomics Market Revenue (Million) Forecast, by Application 2020 & 2033
- Table 32: Italy Proteomics Market Volume (K Unit) Forecast, by Application 2020 & 2033
- Table 33: Spain Proteomics Market Revenue (Million) Forecast, by Application 2020 & 2033
- Table 34: Spain Proteomics Market Volume (K Unit) Forecast, by Application 2020 & 2033
- Table 35: Rest of Europe Proteomics Market Revenue (Million) Forecast, by Application 2020 & 2033
- Table 36: Rest of Europe Proteomics Market Volume (K Unit) Forecast, by Application 2020 & 2033
- Table 37: Global Proteomics Market Revenue Million Forecast, by Product & Services 2020 & 2033
- Table 38: Global Proteomics Market Volume K Unit Forecast, by Product & Services 2020 & 2033
- Table 39: Global Proteomics Market Revenue Million Forecast, by Application 2020 & 2033
- Table 40: Global Proteomics Market Volume K Unit Forecast, by Application 2020 & 2033
- Table 41: Global Proteomics Market Revenue Million Forecast, by Country 2020 & 2033
- Table 42: Global Proteomics Market Volume K Unit Forecast, by Country 2020 & 2033
- Table 43: China Proteomics Market Revenue (Million) Forecast, by Application 2020 & 2033
- Table 44: China Proteomics Market Volume (K Unit) Forecast, by Application 2020 & 2033
- Table 45: Japan Proteomics Market Revenue (Million) Forecast, by Application 2020 & 2033
- Table 46: Japan Proteomics Market Volume (K Unit) Forecast, by Application 2020 & 2033
- Table 47: India Proteomics Market Revenue (Million) Forecast, by Application 2020 & 2033
- Table 48: India Proteomics Market Volume (K Unit) Forecast, by Application 2020 & 2033
- Table 49: Australia Proteomics Market Revenue (Million) Forecast, by Application 2020 & 2033
- Table 50: Australia Proteomics Market Volume (K Unit) Forecast, by Application 2020 & 2033
- Table 51: South Korea Proteomics Market Revenue (Million) Forecast, by Application 2020 & 2033
- Table 52: South Korea Proteomics Market Volume (K Unit) Forecast, by Application 2020 & 2033
- Table 53: Rest of Asia Pacific Proteomics Market Revenue (Million) Forecast, by Application 2020 & 2033
- Table 54: Rest of Asia Pacific Proteomics Market Volume (K Unit) Forecast, by Application 2020 & 2033
- Table 55: Global Proteomics Market Revenue Million Forecast, by Product & Services 2020 & 2033
- Table 56: Global Proteomics Market Volume K Unit Forecast, by Product & Services 2020 & 2033
- Table 57: Global Proteomics Market Revenue Million Forecast, by Application 2020 & 2033
- Table 58: Global Proteomics Market Volume K Unit Forecast, by Application 2020 & 2033
- Table 59: Global Proteomics Market Revenue Million Forecast, by Country 2020 & 2033
- Table 60: Global Proteomics Market Volume K Unit Forecast, by Country 2020 & 2033
- Table 61: Global Proteomics Market Revenue Million Forecast, by Product & Services 2020 & 2033
- Table 62: Global Proteomics Market Volume K Unit Forecast, by Product & Services 2020 & 2033
- Table 63: Global Proteomics Market Revenue Million Forecast, by Application 2020 & 2033
- Table 64: Global Proteomics Market Volume K Unit Forecast, by Application 2020 & 2033
- Table 65: Global Proteomics Market Revenue Million Forecast, by Country 2020 & 2033
- Table 66: Global Proteomics Market Volume K Unit Forecast, by Country 2020 & 2033
- Table 67: South Africa Proteomics Market Revenue (Million) Forecast, by Application 2020 & 2033
- Table 68: South Africa Proteomics Market Volume (K Unit) Forecast, by Application 2020 & 2033
- Table 69: Rest of Middle East Proteomics Market Revenue (Million) Forecast, by Application 2020 & 2033
- Table 70: Rest of Middle East Proteomics Market Volume (K Unit) Forecast, by Application 2020 & 2033
- Table 71: Global Proteomics Market Revenue Million Forecast, by Product & Services 2020 & 2033
- Table 72: Global Proteomics Market Volume K Unit Forecast, by Product & Services 2020 & 2033
- Table 73: Global Proteomics Market Revenue Million Forecast, by Application 2020 & 2033
- Table 74: Global Proteomics Market Volume K Unit Forecast, by Application 2020 & 2033
- Table 75: Global Proteomics Market Revenue Million Forecast, by Country 2020 & 2033
- Table 76: Global Proteomics Market Volume K Unit Forecast, by Country 2020 & 2033
- Table 77: Brazil Proteomics Market Revenue (Million) Forecast, by Application 2020 & 2033
- Table 78: Brazil Proteomics Market Volume (K Unit) Forecast, by Application 2020 & 2033
- Table 79: Argentina Proteomics Market Revenue (Million) Forecast, by Application 2020 & 2033
- Table 80: Argentina Proteomics Market Volume (K Unit) Forecast, by Application 2020 & 2033
- Table 81: Rest of South America Proteomics Market Revenue (Million) Forecast, by Application 2020 & 2033
- Table 82: Rest of South America Proteomics Market Volume (K Unit) Forecast, by Application 2020 & 2033
Frequently Asked Questions
1. What is the projected Compound Annual Growth Rate (CAGR) of the Proteomics Market?
The projected CAGR is approximately 8.42%.
2. Which companies are prominent players in the Proteomics Market?
Key companies in the market include Promega Corporation, Bio-Rad Laboratories Inc, Waters Corporation, Merck KGaA, GE Healthcare, Thermo Fisher Scientific Inc, Danaher Corporation, Agilent Technologies Inc, Bruker Corporation.
3. What are the main segments of the Proteomics Market?
The market segments include Product & Services, Application.
4. Can you provide details about the market size?
The market size is estimated to be USD 27.60 Million as of 2022.
5. What are some drivers contributing to market growth?
Rising Demand for Personalized Medicine; Increasing R&D Expenditure and Government Funding for Proteomics; Technological Advancements.
6. What are the notable trends driving market growth?
Drug Discovery is Expected to Witness Healthy CAGR in Future.
7. Are there any restraints impacting market growth?
High Cost of Instruments.
8. Can you provide examples of recent developments in the market?
N/A
9. What pricing options are available for accessing the report?
Pricing options include single-user, multi-user, and enterprise licenses priced at USD 4750, USD 5250, and USD 8750 respectively.
10. Is the market size provided in terms of value or volume?
The market size is provided in terms of value, measured in Million and volume, measured in K Unit.
11. Are there any specific market keywords associated with the report?
Yes, the market keyword associated with the report is "Proteomics Market," which aids in identifying and referencing the specific market segment covered.
12. How do I determine which pricing option suits my needs best?
The pricing options vary based on user requirements and access needs. Individual users may opt for single-user licenses, while businesses requiring broader access may choose multi-user or enterprise licenses for cost-effective access to the report.
13. Are there any additional resources or data provided in the Proteomics Market report?
While the report offers comprehensive insights, it's advisable to review the specific contents or supplementary materials provided to ascertain if additional resources or data are available.
14. How can I stay updated on further developments or reports in the Proteomics Market?
To stay informed about further developments, trends, and reports in the Proteomics Market, consider subscribing to industry newsletters, following relevant companies and organizations, or regularly checking reputable industry news sources and publications.
Methodology
Step 1 - Identification of Relevant Samples Size from Population Database


Step 2 - Approaches for Defining Global Market Size (Value, Volume* & Price*)

Note*: In applicable scenarios
Step 3 - Data Sources
Primary Research
- Web Analytics
- Survey Reports
- Research Institute
- Latest Research Reports
- Opinion Leaders
Secondary Research
- Annual Reports
- White Paper
- Latest Press Release
- Industry Association
- Paid Database
- Investor Presentations

Step 4 - Data Triangulation
Involves using different sources of information in order to increase the validity of a study
These sources are likely to be stakeholders in a program - participants, other researchers, program staff, other community members, and so on.
Then we put all data in single framework & apply various statistical tools to find out the dynamic on the market.
During the analysis stage, feedback from the stakeholder groups would be compared to determine areas of agreement as well as areas of divergence

