

Key Insights
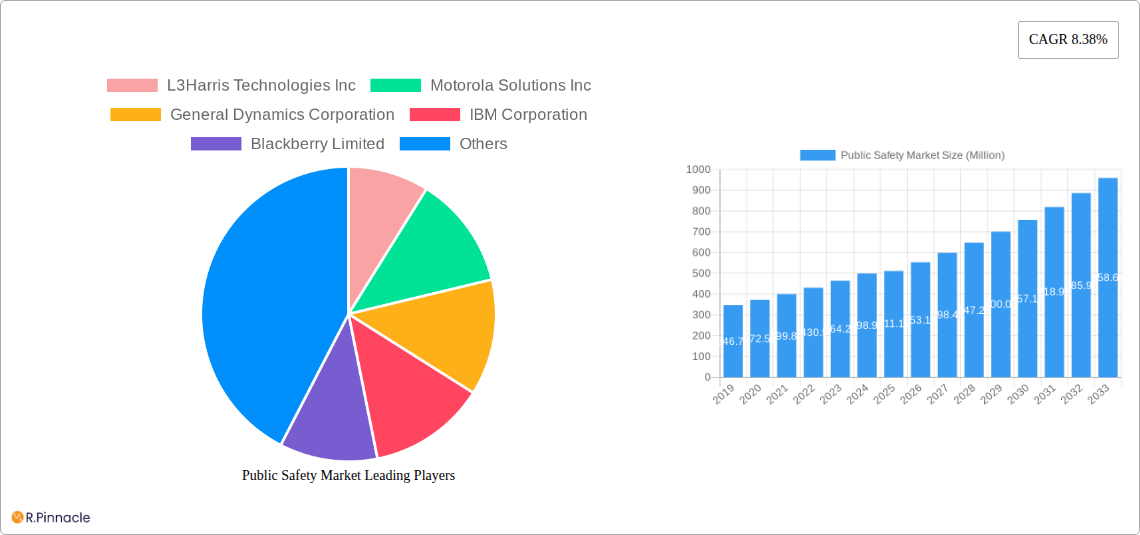
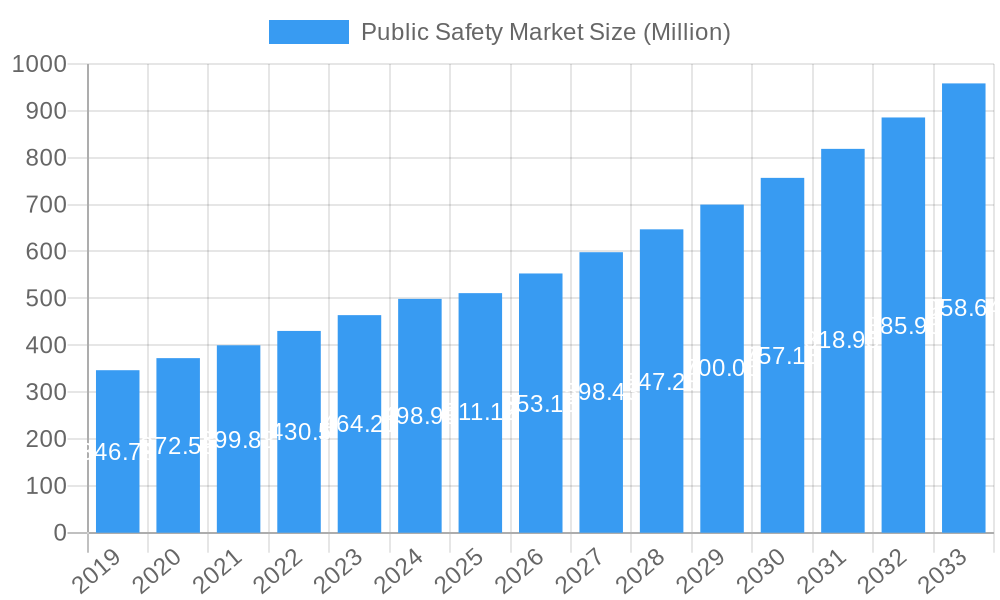
The Public Safety Market is projected for robust growth, with a current market size of approximately $511.12 million and a Compound Annual Growth Rate (CAGR) of 8.38% anticipated through 2033. This expansion is fueled by a confluence of factors, prominently the increasing demand for advanced communication systems and integrated solutions across various public safety sectors. Innovations in AI-powered analytics for threat detection, real-time situational awareness platforms, and the widespread adoption of cloud-based deployments are key drivers. The integration of sophisticated components like advanced sensors, communication hardware, and comprehensive software solutions is enabling faster response times and more effective resource allocation for law enforcement, emergency medical services, firefighting, and transportation safety. The ongoing digital transformation within government agencies and the critical need to enhance citizen security in the face of evolving threats are further bolstering market penetration.
Public Safety Market Market Size (In Million)
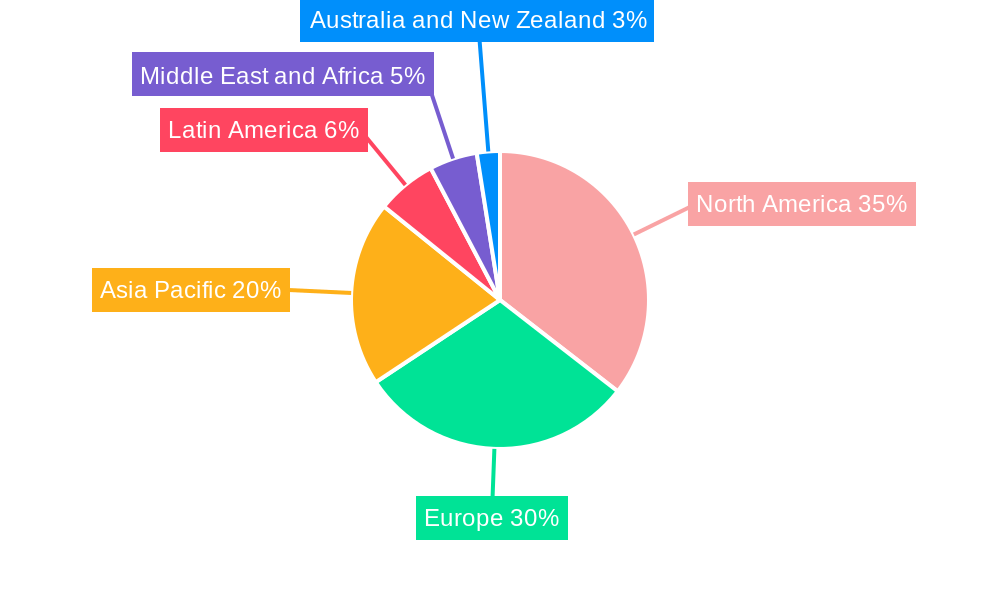
The market is strategically segmented into key areas, including specialized components such as cutting-edge solutions and essential services, alongside deployment types like flexible on-premise systems and scalable cloud-based infrastructure. Leading end-user verticals such as Law Enforcement, Medical, Firefighting, and Transportation are driving significant investment, with Disaster Management also emerging as a crucial segment. Geographically, North America and Europe are expected to lead market adoption due to established technological infrastructure and substantial government spending on public safety initiatives. However, the Asia-Pacific region is anticipated to exhibit the highest growth rate, driven by increasing urbanization, a rising awareness of safety concerns, and significant investments in smart city projects. Restraints such as high initial implementation costs for advanced technologies and data privacy concerns are being addressed through the development of more cost-effective solutions and stringent data security protocols, ensuring sustained market momentum.
Public Safety Market Company Market Share
This in-depth report provides a strategic analysis of the global Public Safety Market, offering actionable insights for industry stakeholders. Leveraging a study period from 2019 to 2033, with a base year of 2025 and a forecast period of 2025–2033, this report delves into market structure, dynamics, dominant regions, product innovations, growth drivers, challenges, emerging opportunities, leading players, and key industry developments. Our research empowers you to navigate the evolving landscape of public safety technology and solutions, ensuring optimal decision-making in this critical sector.
Public Safety Market Market Structure & Innovation Trends
The Public Safety Market exhibits a dynamic structure characterized by a moderate level of concentration. Key players like L3Harris Technologies Inc., Motorola Solutions Inc., and General Dynamics Corporation hold significant market share, driven by extensive product portfolios and established client relationships. Innovation is a crucial differentiator, with companies investing heavily in advanced technologies such as AI, IoT, and cloud computing to enhance situational awareness, response times, and data analysis capabilities. Regulatory frameworks play a vital role, influencing the adoption of interoperable communication systems and data security standards. While product substitutes exist, the critical nature of public safety functions limits their widespread adoption. End-user demographics are shifting towards data-driven decision-making, demanding more sophisticated and integrated solutions. Mergers and acquisitions (M&A) activity is notable, with deal values in the tens to hundreds of millions of dollars, as larger entities seek to acquire innovative technologies and expand their market reach. For instance, strategic acquisitions aim to consolidate offerings in areas like emergency response software and surveillance technology. The market is continuously evolving to meet the growing demands for faster, more effective, and more connected public safety operations globally.
Public Safety Market Market Dynamics & Trends
The Public Safety Market is experiencing robust growth, propelled by an escalating need for enhanced security, crime prevention, and emergency response capabilities worldwide. A significant CAGR is projected over the forecast period, driven by increasing global concerns regarding terrorism, natural disasters, and urban crime rates. Technological advancements are at the forefront of market expansion. The integration of Artificial Intelligence (AI) and Machine Learning (ML) into public safety solutions is revolutionizing surveillance, predictive policing, and emergency dispatch systems, enabling faster and more accurate decision-making. The proliferation of the Internet of Things (IoT) is creating a network of interconnected devices, from smart sensors to body-worn cameras, providing real-time data streams for improved situational awareness. Cloud computing adoption is another major trend, offering scalability, accessibility, and cost-effectiveness for public safety agencies, facilitating seamless data management and collaborative operations. Consumer preferences are leaning towards integrated and user-friendly solutions that simplify complex workflows and improve officer and responder efficiency. This includes a demand for interoperable communication platforms that can seamlessly connect different agencies and first responders. The competitive dynamics within the market are intense, with established players continuously innovating and emerging companies offering niche solutions. This competitive landscape fosters rapid technological development and a drive towards more comprehensive and sophisticated public safety ecosystems. The increasing adoption of smart city initiatives further fuels market penetration, as these initiatives inherently rely on advanced public safety technologies for citizen protection and efficient urban management. Government investments in homeland security and critical infrastructure protection are also substantial, contributing significantly to market growth and the widespread adoption of cutting-edge public safety solutions.
Dominant Regions & Segments in Public Safety Market
Leading Region: North America currently dominates the Public Safety Market, driven by significant government investments in homeland security, advanced law enforcement technologies, and well-established critical infrastructure protection programs. The United States, in particular, leads in the adoption of sophisticated public safety solutions due to its proactive approach to national security and emergency preparedness.
Dominant Segments Analysis:
Component: Solution
- Key Drivers: Demand for integrated command and control systems, advanced analytics for crime prediction, real-time communication platforms, and evidence management software.
- Dominance: This segment is the largest within the Public Safety Market due to its direct contribution to operational effectiveness. Agencies require comprehensive software solutions to manage diverse aspects of public safety, from initial incident response to post-event analysis. The increasing complexity of threats necessitates intelligent, data-driven solutions that can process vast amounts of information quickly and efficiently.
Deployment Type: Cloud
- Key Drivers: Scalability, cost-effectiveness, remote accessibility, enhanced data backup and recovery, and the ability to deploy updates and new features rapidly.
- Dominance: The cloud segment is experiencing rapid growth and is projected to overtake on-premise deployments in the coming years. Cloud-based solutions offer public safety agencies greater flexibility and agility, allowing them to scale their operations without significant upfront capital expenditure on hardware. This is particularly beneficial for smaller agencies or those with fluctuating needs. The recent development where CentralSquare Technologies is leveraging Amazon Web Services (AWS) for enhanced cloud migration guidance exemplifies this trend.
End-user Vertical: Law Enforcement
- Key Drivers: Rising crime rates, need for advanced surveillance and crime prevention tools, body-worn cameras, facial recognition technology, and digital evidence management.
- Dominance: Law enforcement agencies represent the largest end-user vertical in the Public Safety Market. They are continually seeking innovative technologies to improve officer safety, enhance investigative capabilities, and foster community engagement. The increasing use of data analytics and AI for predictive policing further solidifies their position as a primary driver of market growth. The contract awarded to GDIT (General Dynamics Information Technology) for upgrading the United States Central Command (CENTCOM) enterprise IT infrastructure, valued at USD 922 million, underscores the significant investments in this sector.
Public Safety Market Product Innovations
Product innovations in the Public Safety Market are centered around enhancing situational awareness, improving communication interoperability, and leveraging advanced analytics. Key developments include AI-powered video analytics for real-time threat detection, next-generation dispatch systems with integrated mapping and communication, and secure, cloud-based data management platforms for seamless information sharing. Innovations in body-worn cameras with enhanced audio-visual capabilities and extended battery life are also prominent. Furthermore, the focus on resilient communication networks, including 5G integration and satellite-based solutions, ensures operational continuity even in challenging environments. These innovations offer significant competitive advantages by enabling faster response times, more accurate decision-making, and improved officer and community safety.
Report Scope & Segmentation Analysis
This report segments the Public Safety Market across key categories to provide granular insights.
- Component: The market is analyzed by Solution (software, hardware) and Services (maintenance, consulting, integration). The Solution segment is expected to dominate due to the continuous demand for advanced software platforms and integrated hardware.
- Deployment Type: The analysis covers On-premise and Cloud deployments. The Cloud segment is experiencing substantial growth, driven by its scalability and cost-effectiveness.
- End-user Vertical: Key verticals examined include Law Enforcement, Medical, Firefighting, Transportation, Disaster Management, and Other End-user Verticals. Law Enforcement is the largest vertical, with significant projected growth across all verticals due to increasing security needs.
Key Drivers of Public Safety Market Growth
Several factors are propelling the growth of the Public Safety Market:
- Increasing Terrorism and Crime Rates: Global concerns over terrorism, organized crime, and civil unrest necessitate advanced security and surveillance solutions.
- Technological Advancements: The integration of AI, IoT, 5G, and cloud computing enables more sophisticated and effective public safety operations. Cisco's partnership with over 200 AI stakeholders to promote reliable and secure AI deployment highlights this trend.
- Government Investments: Substantial government spending on homeland security, defense, and emergency preparedness initiatives fuels market demand.
- Need for Interoperability: The drive for seamless communication and data sharing between different agencies and first responders is a critical growth catalyst.
- Urbanization and Smart City Initiatives: Growing urban populations and the adoption of smart city technologies require robust public safety infrastructure.
Challenges in the Public Safety Market Sector
Despite robust growth, the Public Safety Market faces several challenges:
- High Implementation Costs: The initial investment for advanced public safety technologies can be substantial, posing a barrier for some agencies.
- Data Security and Privacy Concerns: Protecting sensitive data and ensuring compliance with privacy regulations is a constant challenge.
- Interoperability Issues: Achieving seamless integration between legacy systems and new technologies remains a complex hurdle.
- Skilled Workforce Shortage: A lack of trained personnel to operate and maintain advanced public safety systems can hinder adoption.
- Regulatory Hurdles: Navigating diverse and evolving regulatory landscapes across different jurisdictions can be complex.
Emerging Opportunities in Public Safety Market
The Public Safety Market presents numerous emerging opportunities:
- AI-Powered Predictive Analytics: Leveraging AI for proactive crime prevention, disaster forecasting, and resource allocation offers significant potential.
- IoT Integration for Real-time Monitoring: Expanding the use of IoT sensors for environmental monitoring, infrastructure security, and public health surveillance.
- Enhanced Drone and UAV Applications: Utilizing drones for aerial surveillance, search and rescue, and incident assessment.
- Next-Generation Communication Systems: The rollout of 5G networks offers opportunities for high-speed, low-latency communication solutions.
- Cybersecurity for Critical Infrastructure: Increasing demand for advanced cybersecurity solutions to protect vital public infrastructure from cyber threats.
Leading Players in the Public Safety Market Market
- L3Harris Technologies Inc.
- Motorola Solutions Inc.
- General Dynamics Corporation
- IBM Corporation
- Blackberry Limited
- CentralSquare Technologies
- Thales Group
- Cisco Systems Inc.
- NICE Ltd
- Verint Systems Inc
- Atos SE
- Semtech Corporation
Key Developments in Public Safety Market Industry
- April 2024: CentralSquare Technologies announced it would leverage Amazon Web Services (AWS) to deliver enhanced cloud migration guidance and services through CentralSquare’s end-to-end public safety portfolio. By deploying CentralSquare on AWS, responders and officers spend less time reporting back, streamlining processes, engaging with the community, and building more robust, trusting connections with citizens.
- March 2024: GDIT (General Dynamics Information Technology), a business segment of General Dynamics, reported that it had been awarded a new contract of USD 922 million to upgrade the United States Central Command (CENTCOM) enterprise IT infrastructure. The new contract, awarded in February by the General Services Administration (GSA), has a base term of one year and five option years.
- February 2024: Cisco announced that it partnered with over 200 of the country’s top AI stakeholders to join the United States Department of Commerce (US Commerce) to promote reliable and secure AI deployment and development. Created by the Commerce Department’s NIST, the AISIC (AI Safety Institute Consortium) brings together AI developers, users, academia, government, industry, and civil society stakeholders to achieve this goal.
Future Outlook for Public Safety Market Market
The future outlook for the Public Safety Market is exceptionally promising, driven by continuous technological advancements and a persistent global demand for enhanced safety and security. The increasing adoption of AI, IoT, and cloud computing will lead to more intelligent, proactive, and integrated public safety systems. Smart city initiatives worldwide will further accelerate the deployment of these technologies. Investments in resilient communication infrastructure, such as 5G, will unlock new capabilities for real-time data transmission and collaboration. As governments and organizations prioritize citizen well-being and critical infrastructure protection, the market is poised for sustained, robust growth, offering significant strategic opportunities for innovation and expansion.
Public Safety Market Segmentation
-
1. Component
- 1.1. Solution
- 1.2. Services
-
2. Deployment Type
- 2.1. On-premise
- 2.2. Cloud
-
3. End-user Vertical
- 3.1. Law Enforcement
- 3.2. Medical
- 3.3. Firefighting
- 3.4. Transportation
- 3.5. Disaster Management
- 3.6. Other End-user Verticals
Public Safety Market Segmentation By Geography
- 1. North America
- 2. Europe
- 3. Asia
- 4. Australia and New Zealand
- 5. Middle East and Africa
- 6. Latin America
Public Safety Market Regional Market Share
Geographic Coverage of Public Safety Market
Public Safety Market REPORT HIGHLIGHTS
| Aspects | Details |
|---|---|
| Study Period | 2020-2034 |
| Base Year | 2025 |
| Estimated Year | 2026 |
| Forecast Period | 2026-2034 |
| Historical Period | 2020-2025 |
| Growth Rate | CAGR of 8.38% from 2020-2034 |
| Segmentation |
|
Table of Contents
- 1. Introduction
- 1.1. Research Scope
- 1.2. Market Segmentation
- 1.3. Research Objective
- 1.4. Definitions and Assumptions
- 2. Executive Summary
- 2.1. Market Snapshot
- 3. Market Dynamics
- 3.1. Market Drivers
- 3.2. Market Restrains
- 3.3. Market Trends
- 3.4. Market Opportunities
- 4. Market Factor Analysis
- 4.1. Porters Five Forces
- 4.1.1. Bargaining Power of Suppliers
- 4.1.2. Bargaining Power of Buyers
- 4.1.3. Threat of New Entrants
- 4.1.4. Threat of Substitutes
- 4.1.5. Competitive Rivalry
- 4.2. PESTEL analysis
- 4.3. BCG Analysis
- 4.3.1. Stars (High Growth, High Market Share)
- 4.3.2. Cash Cows (Low Growth, High Market Share)
- 4.3.3. Question Mark (High Growth, Low Market Share)
- 4.3.4. Dogs (Low Growth, Low Market Share)
- 4.4. Ansoff Matrix Analysis
- 4.5. Supply Chain Analysis
- 4.6. Regulatory Landscape
- 4.7. Current Market Potential and Opportunity Assessment (TAM–SAM–SOM Framework)
- 4.8. PRI Analyst Note
- 4.1. Porters Five Forces
- 5. Market Analysis, Insights and Forecast 2021-2033
- 5.1. Market Analysis, Insights and Forecast - by Component
- 5.1.1. Solution
- 5.1.2. Services
- 5.2. Market Analysis, Insights and Forecast - by Deployment Type
- 5.2.1. On-premise
- 5.2.2. Cloud
- 5.3. Market Analysis, Insights and Forecast - by End-user Vertical
- 5.3.1. Law Enforcement
- 5.3.2. Medical
- 5.3.3. Firefighting
- 5.3.4. Transportation
- 5.3.5. Disaster Management
- 5.3.6. Other End-user Verticals
- 5.4. Market Analysis, Insights and Forecast - by Region
- 5.4.1. North America
- 5.4.2. Europe
- 5.4.3. Asia
- 5.4.4. Australia and New Zealand
- 5.4.5. Middle East and Africa
- 5.4.6. Latin America
- 5.1. Market Analysis, Insights and Forecast - by Component
- 6. Global Public Safety Market Analysis, Insights and Forecast, 2021-2033
- 6.1. Market Analysis, Insights and Forecast - by Component
- 6.1.1. Solution
- 6.1.2. Services
- 6.2. Market Analysis, Insights and Forecast - by Deployment Type
- 6.2.1. On-premise
- 6.2.2. Cloud
- 6.3. Market Analysis, Insights and Forecast - by End-user Vertical
- 6.3.1. Law Enforcement
- 6.3.2. Medical
- 6.3.3. Firefighting
- 6.3.4. Transportation
- 6.3.5. Disaster Management
- 6.3.6. Other End-user Verticals
- 6.1. Market Analysis, Insights and Forecast - by Component
- 7. North America Public Safety Market Analysis, Insights and Forecast, 2020-2032
- 7.1. Market Analysis, Insights and Forecast - by Component
- 7.1.1. Solution
- 7.1.2. Services
- 7.2. Market Analysis, Insights and Forecast - by Deployment Type
- 7.2.1. On-premise
- 7.2.2. Cloud
- 7.3. Market Analysis, Insights and Forecast - by End-user Vertical
- 7.3.1. Law Enforcement
- 7.3.2. Medical
- 7.3.3. Firefighting
- 7.3.4. Transportation
- 7.3.5. Disaster Management
- 7.3.6. Other End-user Verticals
- 7.1. Market Analysis, Insights and Forecast - by Component
- 8. Europe Public Safety Market Analysis, Insights and Forecast, 2020-2032
- 8.1. Market Analysis, Insights and Forecast - by Component
- 8.1.1. Solution
- 8.1.2. Services
- 8.2. Market Analysis, Insights and Forecast - by Deployment Type
- 8.2.1. On-premise
- 8.2.2. Cloud
- 8.3. Market Analysis, Insights and Forecast - by End-user Vertical
- 8.3.1. Law Enforcement
- 8.3.2. Medical
- 8.3.3. Firefighting
- 8.3.4. Transportation
- 8.3.5. Disaster Management
- 8.3.6. Other End-user Verticals
- 8.1. Market Analysis, Insights and Forecast - by Component
- 9. Asia Public Safety Market Analysis, Insights and Forecast, 2020-2032
- 9.1. Market Analysis, Insights and Forecast - by Component
- 9.1.1. Solution
- 9.1.2. Services
- 9.2. Market Analysis, Insights and Forecast - by Deployment Type
- 9.2.1. On-premise
- 9.2.2. Cloud
- 9.3. Market Analysis, Insights and Forecast - by End-user Vertical
- 9.3.1. Law Enforcement
- 9.3.2. Medical
- 9.3.3. Firefighting
- 9.3.4. Transportation
- 9.3.5. Disaster Management
- 9.3.6. Other End-user Verticals
- 9.1. Market Analysis, Insights and Forecast - by Component
- 10. Australia and New Zealand Public Safety Market Analysis, Insights and Forecast, 2020-2032
- 10.1. Market Analysis, Insights and Forecast - by Component
- 10.1.1. Solution
- 10.1.2. Services
- 10.2. Market Analysis, Insights and Forecast - by Deployment Type
- 10.2.1. On-premise
- 10.2.2. Cloud
- 10.3. Market Analysis, Insights and Forecast - by End-user Vertical
- 10.3.1. Law Enforcement
- 10.3.2. Medical
- 10.3.3. Firefighting
- 10.3.4. Transportation
- 10.3.5. Disaster Management
- 10.3.6. Other End-user Verticals
- 10.1. Market Analysis, Insights and Forecast - by Component
- 11. Middle East and Africa Public Safety Market Analysis, Insights and Forecast, 2020-2032
- 11.1. Market Analysis, Insights and Forecast - by Component
- 11.1.1. Solution
- 11.1.2. Services
- 11.2. Market Analysis, Insights and Forecast - by Deployment Type
- 11.2.1. On-premise
- 11.2.2. Cloud
- 11.3. Market Analysis, Insights and Forecast - by End-user Vertical
- 11.3.1. Law Enforcement
- 11.3.2. Medical
- 11.3.3. Firefighting
- 11.3.4. Transportation
- 11.3.5. Disaster Management
- 11.3.6. Other End-user Verticals
- 11.1. Market Analysis, Insights and Forecast - by Component
- 12. Latin America Public Safety Market Analysis, Insights and Forecast, 2020-2032
- 12.1. Market Analysis, Insights and Forecast - by Component
- 12.1.1. Solution
- 12.1.2. Services
- 12.2. Market Analysis, Insights and Forecast - by Deployment Type
- 12.2.1. On-premise
- 12.2.2. Cloud
- 12.3. Market Analysis, Insights and Forecast - by End-user Vertical
- 12.3.1. Law Enforcement
- 12.3.2. Medical
- 12.3.3. Firefighting
- 12.3.4. Transportation
- 12.3.5. Disaster Management
- 12.3.6. Other End-user Verticals
- 12.1. Market Analysis, Insights and Forecast - by Component
- 13. Competitive Analysis
- 13.1. Company Profiles
- 13.1.1 L3Harris Technologies Inc
- 13.1.1.1. Company Overview
- 13.1.1.2. Products
- 13.1.1.3. Company Financials
- 13.1.1.4. SWOT Analysis
- 13.1.2 Motorola Solutions Inc
- 13.1.2.1. Company Overview
- 13.1.2.2. Products
- 13.1.2.3. Company Financials
- 13.1.2.4. SWOT Analysis
- 13.1.3 General Dynamics Corporation
- 13.1.3.1. Company Overview
- 13.1.3.2. Products
- 13.1.3.3. Company Financials
- 13.1.3.4. SWOT Analysis
- 13.1.4 IBM Corporation
- 13.1.4.1. Company Overview
- 13.1.4.2. Products
- 13.1.4.3. Company Financials
- 13.1.4.4. SWOT Analysis
- 13.1.5 Blackberry Limited
- 13.1.5.1. Company Overview
- 13.1.5.2. Products
- 13.1.5.3. Company Financials
- 13.1.5.4. SWOT Analysis
- 13.1.6 CentralSquare Technologies
- 13.1.6.1. Company Overview
- 13.1.6.2. Products
- 13.1.6.3. Company Financials
- 13.1.6.4. SWOT Analysis
- 13.1.7 Thales Group
- 13.1.7.1. Company Overview
- 13.1.7.2. Products
- 13.1.7.3. Company Financials
- 13.1.7.4. SWOT Analysis
- 13.1.8 Cisco Systems Inc
- 13.1.8.1. Company Overview
- 13.1.8.2. Products
- 13.1.8.3. Company Financials
- 13.1.8.4. SWOT Analysis
- 13.1.9 NICE Ltd
- 13.1.9.1. Company Overview
- 13.1.9.2. Products
- 13.1.9.3. Company Financials
- 13.1.9.4. SWOT Analysis
- 13.1.10 Verint Systems Inc
- 13.1.10.1. Company Overview
- 13.1.10.2. Products
- 13.1.10.3. Company Financials
- 13.1.10.4. SWOT Analysis
- 13.1.11 Atos SE
- 13.1.11.1. Company Overview
- 13.1.11.2. Products
- 13.1.11.3. Company Financials
- 13.1.11.4. SWOT Analysis
- 13.1.12 Semtech Corporatio
- 13.1.12.1. Company Overview
- 13.1.12.2. Products
- 13.1.12.3. Company Financials
- 13.1.12.4. SWOT Analysis
- 13.1.1 L3Harris Technologies Inc
- 13.2. Market Entropy
- 13.2.1 Company's Key Areas Served
- 13.2.2 Recent Developments
- 13.3. Company Market Share Analysis 2025
- 13.3.1 Top 5 Companies Market Share Analysis
- 13.3.2 Top 3 Companies Market Share Analysis
- 13.4. List of Potential Customers
- 14. Research Methodology
List of Figures
- Figure 1: Global Public Safety Market Revenue Breakdown (Million, %) by Region 2025 & 2033
- Figure 2: North America Public Safety Market Revenue (Million), by Component 2025 & 2033
- Figure 3: North America Public Safety Market Revenue Share (%), by Component 2025 & 2033
- Figure 4: North America Public Safety Market Revenue (Million), by Deployment Type 2025 & 2033
- Figure 5: North America Public Safety Market Revenue Share (%), by Deployment Type 2025 & 2033
- Figure 6: North America Public Safety Market Revenue (Million), by End-user Vertical 2025 & 2033
- Figure 7: North America Public Safety Market Revenue Share (%), by End-user Vertical 2025 & 2033
- Figure 8: North America Public Safety Market Revenue (Million), by Country 2025 & 2033
- Figure 9: North America Public Safety Market Revenue Share (%), by Country 2025 & 2033
- Figure 10: Europe Public Safety Market Revenue (Million), by Component 2025 & 2033
- Figure 11: Europe Public Safety Market Revenue Share (%), by Component 2025 & 2033
- Figure 12: Europe Public Safety Market Revenue (Million), by Deployment Type 2025 & 2033
- Figure 13: Europe Public Safety Market Revenue Share (%), by Deployment Type 2025 & 2033
- Figure 14: Europe Public Safety Market Revenue (Million), by End-user Vertical 2025 & 2033
- Figure 15: Europe Public Safety Market Revenue Share (%), by End-user Vertical 2025 & 2033
- Figure 16: Europe Public Safety Market Revenue (Million), by Country 2025 & 2033
- Figure 17: Europe Public Safety Market Revenue Share (%), by Country 2025 & 2033
- Figure 18: Asia Public Safety Market Revenue (Million), by Component 2025 & 2033
- Figure 19: Asia Public Safety Market Revenue Share (%), by Component 2025 & 2033
- Figure 20: Asia Public Safety Market Revenue (Million), by Deployment Type 2025 & 2033
- Figure 21: Asia Public Safety Market Revenue Share (%), by Deployment Type 2025 & 2033
- Figure 22: Asia Public Safety Market Revenue (Million), by End-user Vertical 2025 & 2033
- Figure 23: Asia Public Safety Market Revenue Share (%), by End-user Vertical 2025 & 2033
- Figure 24: Asia Public Safety Market Revenue (Million), by Country 2025 & 2033
- Figure 25: Asia Public Safety Market Revenue Share (%), by Country 2025 & 2033
- Figure 26: Australia and New Zealand Public Safety Market Revenue (Million), by Component 2025 & 2033
- Figure 27: Australia and New Zealand Public Safety Market Revenue Share (%), by Component 2025 & 2033
- Figure 28: Australia and New Zealand Public Safety Market Revenue (Million), by Deployment Type 2025 & 2033
- Figure 29: Australia and New Zealand Public Safety Market Revenue Share (%), by Deployment Type 2025 & 2033
- Figure 30: Australia and New Zealand Public Safety Market Revenue (Million), by End-user Vertical 2025 & 2033
- Figure 31: Australia and New Zealand Public Safety Market Revenue Share (%), by End-user Vertical 2025 & 2033
- Figure 32: Australia and New Zealand Public Safety Market Revenue (Million), by Country 2025 & 2033
- Figure 33: Australia and New Zealand Public Safety Market Revenue Share (%), by Country 2025 & 2033
- Figure 34: Middle East and Africa Public Safety Market Revenue (Million), by Component 2025 & 2033
- Figure 35: Middle East and Africa Public Safety Market Revenue Share (%), by Component 2025 & 2033
- Figure 36: Middle East and Africa Public Safety Market Revenue (Million), by Deployment Type 2025 & 2033
- Figure 37: Middle East and Africa Public Safety Market Revenue Share (%), by Deployment Type 2025 & 2033
- Figure 38: Middle East and Africa Public Safety Market Revenue (Million), by End-user Vertical 2025 & 2033
- Figure 39: Middle East and Africa Public Safety Market Revenue Share (%), by End-user Vertical 2025 & 2033
- Figure 40: Middle East and Africa Public Safety Market Revenue (Million), by Country 2025 & 2033
- Figure 41: Middle East and Africa Public Safety Market Revenue Share (%), by Country 2025 & 2033
- Figure 42: Latin America Public Safety Market Revenue (Million), by Component 2025 & 2033
- Figure 43: Latin America Public Safety Market Revenue Share (%), by Component 2025 & 2033
- Figure 44: Latin America Public Safety Market Revenue (Million), by Deployment Type 2025 & 2033
- Figure 45: Latin America Public Safety Market Revenue Share (%), by Deployment Type 2025 & 2033
- Figure 46: Latin America Public Safety Market Revenue (Million), by End-user Vertical 2025 & 2033
- Figure 47: Latin America Public Safety Market Revenue Share (%), by End-user Vertical 2025 & 2033
- Figure 48: Latin America Public Safety Market Revenue (Million), by Country 2025 & 2033
- Figure 49: Latin America Public Safety Market Revenue Share (%), by Country 2025 & 2033
List of Tables
- Table 1: Global Public Safety Market Revenue Million Forecast, by Component 2020 & 2033
- Table 2: Global Public Safety Market Revenue Million Forecast, by Deployment Type 2020 & 2033
- Table 3: Global Public Safety Market Revenue Million Forecast, by End-user Vertical 2020 & 2033
- Table 4: Global Public Safety Market Revenue Million Forecast, by Region 2020 & 2033
- Table 5: Global Public Safety Market Revenue Million Forecast, by Component 2020 & 2033
- Table 6: Global Public Safety Market Revenue Million Forecast, by Deployment Type 2020 & 2033
- Table 7: Global Public Safety Market Revenue Million Forecast, by End-user Vertical 2020 & 2033
- Table 8: Global Public Safety Market Revenue Million Forecast, by Country 2020 & 2033
- Table 9: Global Public Safety Market Revenue Million Forecast, by Component 2020 & 2033
- Table 10: Global Public Safety Market Revenue Million Forecast, by Deployment Type 2020 & 2033
- Table 11: Global Public Safety Market Revenue Million Forecast, by End-user Vertical 2020 & 2033
- Table 12: Global Public Safety Market Revenue Million Forecast, by Country 2020 & 2033
- Table 13: Global Public Safety Market Revenue Million Forecast, by Component 2020 & 2033
- Table 14: Global Public Safety Market Revenue Million Forecast, by Deployment Type 2020 & 2033
- Table 15: Global Public Safety Market Revenue Million Forecast, by End-user Vertical 2020 & 2033
- Table 16: Global Public Safety Market Revenue Million Forecast, by Country 2020 & 2033
- Table 17: Global Public Safety Market Revenue Million Forecast, by Component 2020 & 2033
- Table 18: Global Public Safety Market Revenue Million Forecast, by Deployment Type 2020 & 2033
- Table 19: Global Public Safety Market Revenue Million Forecast, by End-user Vertical 2020 & 2033
- Table 20: Global Public Safety Market Revenue Million Forecast, by Country 2020 & 2033
- Table 21: Global Public Safety Market Revenue Million Forecast, by Component 2020 & 2033
- Table 22: Global Public Safety Market Revenue Million Forecast, by Deployment Type 2020 & 2033
- Table 23: Global Public Safety Market Revenue Million Forecast, by End-user Vertical 2020 & 2033
- Table 24: Global Public Safety Market Revenue Million Forecast, by Country 2020 & 2033
- Table 25: Global Public Safety Market Revenue Million Forecast, by Component 2020 & 2033
- Table 26: Global Public Safety Market Revenue Million Forecast, by Deployment Type 2020 & 2033
- Table 27: Global Public Safety Market Revenue Million Forecast, by End-user Vertical 2020 & 2033
- Table 28: Global Public Safety Market Revenue Million Forecast, by Country 2020 & 2033
Frequently Asked Questions
1. What is the projected Compound Annual Growth Rate (CAGR) of the Public Safety Market?
The projected CAGR is approximately 8.38%.
2. Which companies are prominent players in the Public Safety Market?
Key companies in the market include L3Harris Technologies Inc, Motorola Solutions Inc, General Dynamics Corporation, IBM Corporation, Blackberry Limited, CentralSquare Technologies, Thales Group, Cisco Systems Inc, NICE Ltd, Verint Systems Inc, Atos SE, Semtech Corporatio.
3. What are the main segments of the Public Safety Market?
The market segments include Component, Deployment Type, End-user Vertical.
4. Can you provide details about the market size?
The market size is estimated to be USD 511.12 Million as of 2022.
5. What are some drivers contributing to market growth?
Growing Number of Global Catastrophic Accidents. Crime Rates. and Terrorist Activities; Rising Adoption of Advanced Technologies and Growth in Smart Cities.
6. What are the notable trends driving market growth?
Law Enforcement to be the Largest End-user Vertical.
7. Are there any restraints impacting market growth?
Lack of Cybersecurity Professionals; High Reliance on Traditional Authentication Methods and Low Preparedness.
8. Can you provide examples of recent developments in the market?
April 2024 - CentralSquare Technologies announced it would leverage Amazon Web Services (AWS) to deliver enhanced cloud migration guidance and services through CentralSquare’s end-to-end public safety portfolio. By deploying CentralSquare on AWS, responders and officers spend less time reporting back, streamlining processes, engaging with the community, and building more robust, trusting connections with citizens.
9. What pricing options are available for accessing the report?
Pricing options include single-user, multi-user, and enterprise licenses priced at USD 4750, USD 5250, and USD 8750 respectively.
10. Is the market size provided in terms of value or volume?
The market size is provided in terms of value, measured in Million.
11. Are there any specific market keywords associated with the report?
Yes, the market keyword associated with the report is "Public Safety Market," which aids in identifying and referencing the specific market segment covered.
12. How do I determine which pricing option suits my needs best?
The pricing options vary based on user requirements and access needs. Individual users may opt for single-user licenses, while businesses requiring broader access may choose multi-user or enterprise licenses for cost-effective access to the report.
13. Are there any additional resources or data provided in the Public Safety Market report?
While the report offers comprehensive insights, it's advisable to review the specific contents or supplementary materials provided to ascertain if additional resources or data are available.
14. How can I stay updated on further developments or reports in the Public Safety Market?
To stay informed about further developments, trends, and reports in the Public Safety Market, consider subscribing to industry newsletters, following relevant companies and organizations, or regularly checking reputable industry news sources and publications.
Methodology
Step 1 - Identification of Relevant Samples Size from Population Database


Step 2 - Approaches for Defining Global Market Size (Value, Volume* & Price*)

Note*: In applicable scenarios
Step 3 - Data Sources
Primary Research
- Web Analytics
- Survey Reports
- Research Institute
- Latest Research Reports
- Opinion Leaders
Secondary Research
- Annual Reports
- White Paper
- Latest Press Release
- Industry Association
- Paid Database
- Investor Presentations

Step 4 - Data Triangulation
Involves using different sources of information in order to increase the validity of a study
These sources are likely to be stakeholders in a program - participants, other researchers, program staff, other community members, and so on.
Then we put all data in single framework & apply various statistical tools to find out the dynamic on the market.
During the analysis stage, feedback from the stakeholder groups would be compared to determine areas of agreement as well as areas of divergence