

Key Insights
The global pump jack market is experiencing robust growth, driven by increasing oil and gas exploration and production activities worldwide. The market's Compound Annual Growth Rate (CAGR) exceeding 3% indicates a sustained upward trajectory projected through 2033. Key growth drivers include rising energy demand, particularly in developing economies, coupled with ongoing investments in conventional oil and gas extraction methods. The market is segmented by well type (vertical and horizontal) and application (onshore and offshore), with the onshore segment currently dominating due to its established infrastructure and accessibility. Technological advancements in pump jack design, focusing on enhanced efficiency and reduced maintenance costs, are further fueling market expansion. While fluctuating oil prices present a potential restraint, the long-term outlook remains positive, anticipating consistent growth driven by the unwavering global need for energy. Major players such as Baker Hughes, Halliburton, and Schlumberger are actively shaping the market landscape through technological innovations, strategic acquisitions, and geographic expansion. The regional distribution reveals a strong presence in North America and the Asia-Pacific region, reflecting the concentration of oil and gas activities in these areas. However, emerging markets in regions like the Middle East and Africa present significant growth opportunities as these regions invest further in their energy sectors. The market is expected to witness increased competition as new entrants and existing players strive for market share, prompting innovation and potential price adjustments.
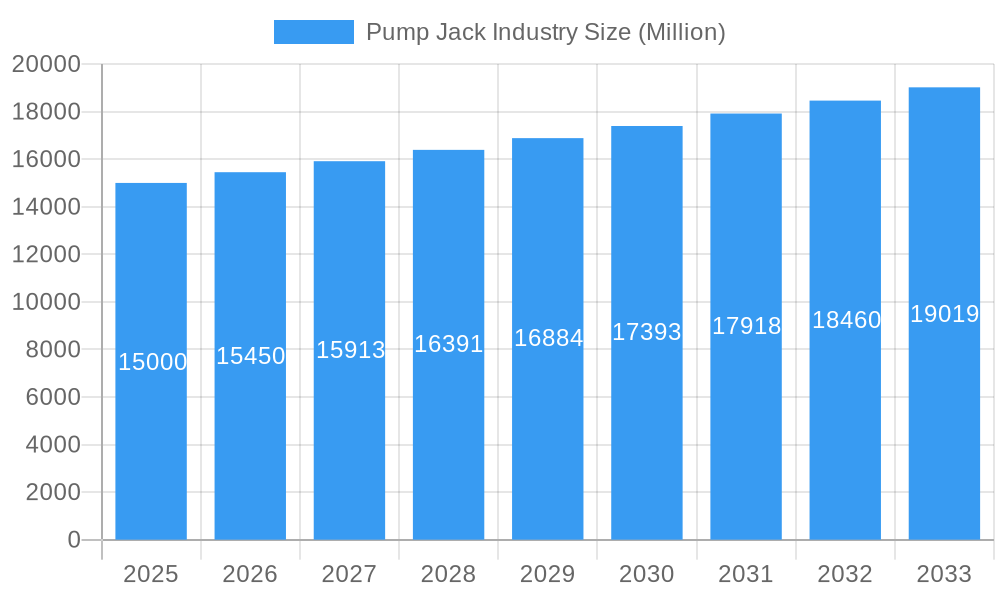
Pump Jack Industry Market Size (In Billion)
The forecast period from 2025 to 2033 suggests a substantial increase in market size, with a significant contribution from both onshore and offshore applications. Horizontal well drilling, requiring more sophisticated pump jack technologies, will likely experience faster growth than vertical well drilling. Market trends indicate a preference for higher-efficiency, lower-maintenance pump jacks, leading to further technological development and product differentiation among industry players. Regional market share is expected to shift somewhat, with Asia-Pacific and the Middle East and Africa potentially experiencing faster growth compared to mature markets in North America and Europe. This projected growth, though subject to global economic conditions and oil price volatility, reflects the continued reliance on conventional oil and gas extraction, creating sustained demand for efficient and reliable pump jack systems for the foreseeable future.
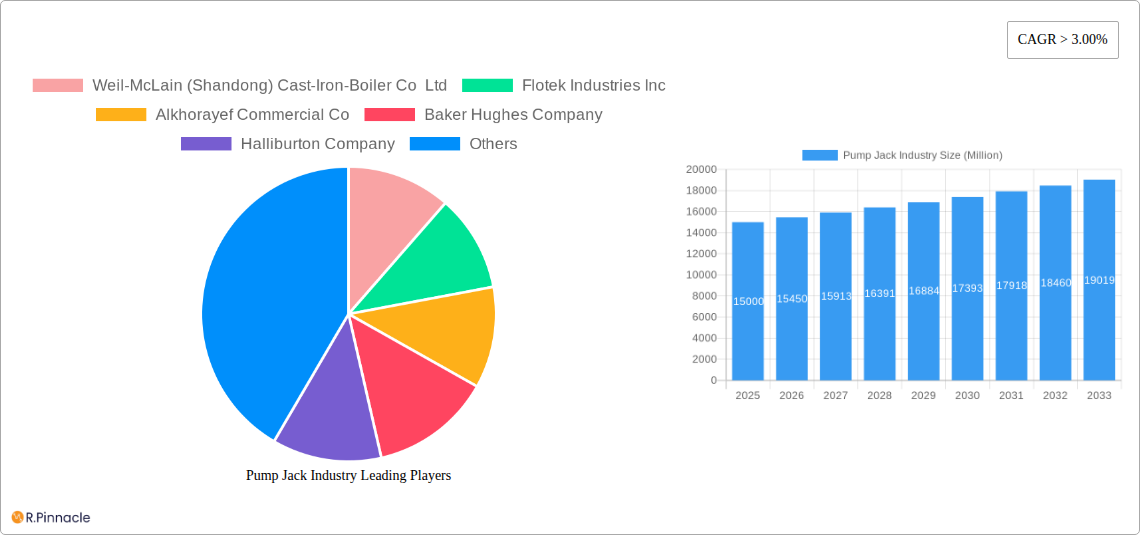
Pump Jack Industry Company Market Share
Pump Jack Industry Market Report: 2019-2033 Forecast
This comprehensive report provides an in-depth analysis of the global Pump Jack industry, offering valuable insights for industry professionals, investors, and strategic decision-makers. The study covers the period 2019-2033, with a base year of 2025 and a forecast period of 2025-2033. The report leverages extensive primary and secondary research to deliver a precise and actionable understanding of this dynamic market. Market values are expressed in Millions.
Pump Jack Industry Market Structure & Innovation Trends
This section analyzes the competitive landscape of the Pump Jack industry, detailing market concentration, innovation drivers, regulatory influences, and key market activities. The report assesses the market share of major players, including Baker Hughes Company, Halliburton Company, National-Oilwell Varco Inc, Weatherford International Ltd, Schlumberger Limited, and Dover Corp, among others. The analysis includes an examination of mergers and acquisitions (M&A) activity within the industry, evaluating deal values and their impact on market dynamics. For example, xx Million in M&A deals were recorded during the historical period (2019-2024), contributing to market consolidation. The report further explores the impact of regulatory frameworks, the presence of substitute products, and end-user demographics on market growth.
- Market Concentration: xx% controlled by top 5 players (2024).
- M&A Deal Value (2019-2024): xx Million
- Innovation Drivers: Technological advancements in pump jack design and automation.
- Regulatory Impact: Stringent environmental regulations influence market dynamics.
Pump Jack Industry Market Dynamics & Trends
This section delves into the key drivers and trends shaping the Pump Jack industry's growth trajectory. The report examines market growth drivers, including increasing oil and gas exploration and production activities globally, alongside technological advancements that enhance efficiency and reduce operational costs. It further analyzes the impact of technological disruptions, evolving consumer preferences, and intense competitive dynamics. The analysis includes specific metrics such as the Compound Annual Growth Rate (CAGR) and market penetration rates. The projected CAGR for the forecast period (2025-2033) is estimated at xx%, driven by factors such as [insert specific factors driving growth, e.g., rising demand for energy, government incentives for oil and gas exploration]. Market penetration is expected to reach xx% by 2033.
Dominant Regions & Segments in Pump Jack Industry
This section identifies the leading regions and segments within the Pump Jack industry. Detailed analysis examines regional dominance, focusing on key factors such as economic policies, infrastructure development, and oil & gas production levels. The report segments the market by well type (Vertical Well, Horizontal Well) and application (Offshore, Onshore).
- Leading Region: North America is expected to remain the dominant region throughout the forecast period due to [insert specific reasons, e.g., established oil and gas infrastructure, higher exploration activity].
- Dominant Segment (Type): Horizontal Well segment is anticipated to exhibit higher growth due to [insert specific reasons, e.g., increasing exploitation of unconventional oil and gas resources].
- Dominant Segment (Application): Onshore segment holds a larger market share owing to [insert specific reasons, e.g., lower operational costs compared to offshore operations].
Further analysis is provided for each segment, highlighting specific growth drivers and competitive dynamics.
Pump Jack Industry Product Innovations
Recent product developments in the Pump Jack industry focus on enhancing efficiency, durability, and automation. Innovations include the integration of advanced materials for improved longevity, automated control systems for optimized performance, and remote monitoring capabilities for enhanced operational efficiency. These innovations cater to the demand for cost-effective and environmentally friendly solutions in the oil and gas sector.
Report Scope & Segmentation Analysis
The report provides a comprehensive market segmentation analysis based on well type (Vertical Well, Horizontal Well) and application (Offshore, Onshore). Each segment's growth projections, market sizes, and competitive dynamics are analyzed.
- Vertical Well Segment: This segment is projected to witness steady growth, driven by [insert reasons]. The market size for 2025 is estimated at xx Million.
- Horizontal Well Segment: This segment is expected to exhibit faster growth owing to [insert reasons]. The 2025 market size is estimated at xx Million.
- Offshore Segment: The offshore segment will experience growth driven by [insert reasons]. The 2025 market size is estimated at xx Million.
- Onshore Segment: The onshore segment will continue to dominate, driven by [insert reasons]. The 2025 market size is estimated at xx Million.
Key Drivers of Pump Jack Industry Growth
The Pump Jack industry's growth is primarily fueled by the rising global demand for energy, particularly oil and gas. Technological advancements, such as improved pump jack designs and automation, contribute to efficiency gains. Furthermore, favorable government policies and investments in oil and gas exploration and production further stimulate market expansion.
Challenges in the Pump Jack Industry Sector
The Pump Jack industry faces several challenges, including fluctuating oil and gas prices impacting investment decisions. Supply chain disruptions can also hinder production and profitability. Moreover, increasing environmental regulations and stringent safety standards necessitate significant investments in compliance measures.
Emerging Opportunities in Pump Jack Industry
Emerging opportunities lie in the development of sustainable and environmentally friendly pump jack technologies. The adoption of advanced materials and automation offers significant potential for cost reduction and improved efficiency. Expansion into new geographical markets with significant oil and gas reserves presents further growth prospects.
Leading Players in the Pump Jack Industry Market
- Weil-McLain (Shandong) Cast-Iron-Boiler Co Ltd
- Flotek Industries Inc
- Alkhorayef Commercial Co
- Baker Hughes Company
- Halliburton Company
- National-Oilwell Varco Inc
- Borets International Ltd
- Weatherford International Ltd
- Schlumberger Limited
- Dover Corp
Key Developments in Pump Jack Industry
- 2022 Q4: Baker Hughes announced a new line of high-efficiency pump jacks.
- 2023 Q1: A major merger between two mid-sized pump jack manufacturers resulted in increased market consolidation.
- 2024 Q2: New regulations regarding emissions from pump jacks were implemented in several key markets. (Further specific developments would be listed here)
Future Outlook for Pump Jack Industry Market
The Pump Jack industry is poised for continued growth, driven by the long-term demand for oil and gas. Technological innovation, particularly in automation and sustainability, will shape future market dynamics. Strategic alliances and M&A activities will play a vital role in shaping the competitive landscape and driving further expansion.
Pump Jack Industry Segmentation
-
1. Type
- 1.1. Vertical Well
- 1.2. Horizontal Well
-
2. Application
- 2.1. Offshore
- 2.2. Onshore
Pump Jack Industry Segmentation By Geography
- 1. North America
- 2. Asia Pacific
- 3. Europe
- 4. South America
- 5. Middle East and Africa
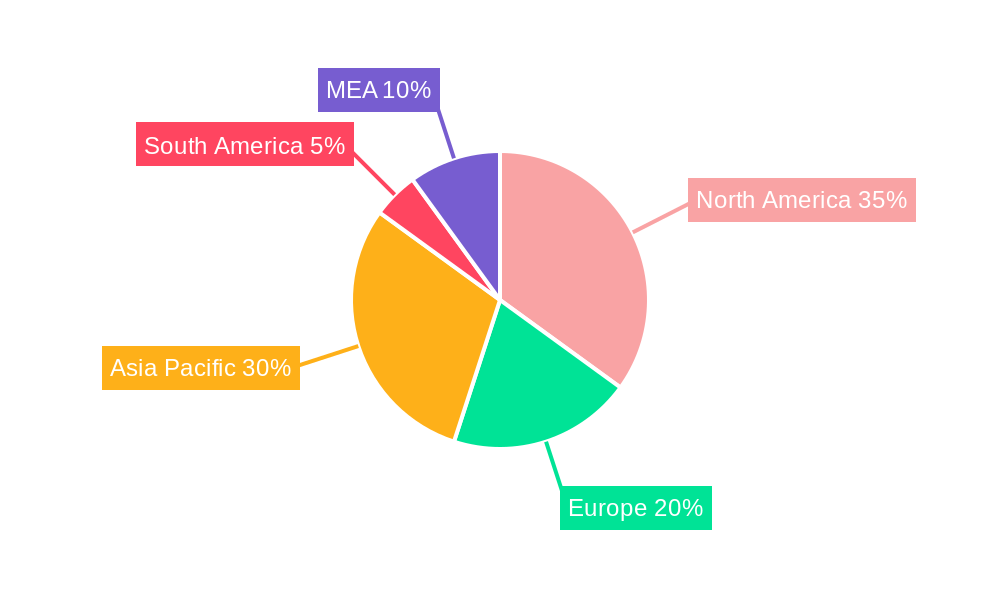
Pump Jack Industry Regional Market Share
Geographic Coverage of Pump Jack Industry
Pump Jack Industry REPORT HIGHLIGHTS
| Aspects | Details |
|---|---|
| Study Period | 2020-2034 |
| Base Year | 2025 |
| Estimated Year | 2026 |
| Forecast Period | 2026-2034 |
| Historical Period | 2020-2025 |
| Growth Rate | CAGR of 5.7% from 2020-2034 |
| Segmentation |
|
Table of Contents
- 1. Introduction
- 1.1. Research Scope
- 1.2. Market Segmentation
- 1.3. Research Objective
- 1.4. Definitions and Assumptions
- 2. Executive Summary
- 2.1. Market Snapshot
- 3. Market Dynamics
- 3.1. Market Drivers
- 3.2. Market Restrains
- 3.3. Market Trends
- 3.4. Market Opportunities
- 4. Market Factor Analysis
- 4.1. Porters Five Forces
- 4.1.1. Bargaining Power of Suppliers
- 4.1.2. Bargaining Power of Buyers
- 4.1.3. Threat of New Entrants
- 4.1.4. Threat of Substitutes
- 4.1.5. Competitive Rivalry
- 4.2. PESTEL analysis
- 4.3. BCG Analysis
- 4.3.1. Stars (High Growth, High Market Share)
- 4.3.2. Cash Cows (Low Growth, High Market Share)
- 4.3.3. Question Mark (High Growth, Low Market Share)
- 4.3.4. Dogs (Low Growth, Low Market Share)
- 4.4. Ansoff Matrix Analysis
- 4.5. Supply Chain Analysis
- 4.6. Regulatory Landscape
- 4.7. Current Market Potential and Opportunity Assessment (TAM–SAM–SOM Framework)
- 4.8. PRI Analyst Note
- 4.1. Porters Five Forces
- 5. Market Analysis, Insights and Forecast 2021-2033
- 5.1. Market Analysis, Insights and Forecast - by Type
- 5.1.1. Vertical Well
- 5.1.2. Horizontal Well
- 5.2. Market Analysis, Insights and Forecast - by Application
- 5.2.1. Offshore
- 5.2.2. Onshore
- 5.3. Market Analysis, Insights and Forecast - by Region
- 5.3.1. North America
- 5.3.2. Asia Pacific
- 5.3.3. Europe
- 5.3.4. South America
- 5.3.5. Middle East and Africa
- 5.1. Market Analysis, Insights and Forecast - by Type
- 6. Global Pump Jack Industry Analysis, Insights and Forecast, 2021-2033
- 6.1. Market Analysis, Insights and Forecast - by Type
- 6.1.1. Vertical Well
- 6.1.2. Horizontal Well
- 6.2. Market Analysis, Insights and Forecast - by Application
- 6.2.1. Offshore
- 6.2.2. Onshore
- 6.1. Market Analysis, Insights and Forecast - by Type
- 7. North America Pump Jack Industry Analysis, Insights and Forecast, 2020-2032
- 7.1. Market Analysis, Insights and Forecast - by Type
- 7.1.1. Vertical Well
- 7.1.2. Horizontal Well
- 7.2. Market Analysis, Insights and Forecast - by Application
- 7.2.1. Offshore
- 7.2.2. Onshore
- 7.1. Market Analysis, Insights and Forecast - by Type
- 8. Asia Pacific Pump Jack Industry Analysis, Insights and Forecast, 2020-2032
- 8.1. Market Analysis, Insights and Forecast - by Type
- 8.1.1. Vertical Well
- 8.1.2. Horizontal Well
- 8.2. Market Analysis, Insights and Forecast - by Application
- 8.2.1. Offshore
- 8.2.2. Onshore
- 8.1. Market Analysis, Insights and Forecast - by Type
- 9. Europe Pump Jack Industry Analysis, Insights and Forecast, 2020-2032
- 9.1. Market Analysis, Insights and Forecast - by Type
- 9.1.1. Vertical Well
- 9.1.2. Horizontal Well
- 9.2. Market Analysis, Insights and Forecast - by Application
- 9.2.1. Offshore
- 9.2.2. Onshore
- 9.1. Market Analysis, Insights and Forecast - by Type
- 10. South America Pump Jack Industry Analysis, Insights and Forecast, 2020-2032
- 10.1. Market Analysis, Insights and Forecast - by Type
- 10.1.1. Vertical Well
- 10.1.2. Horizontal Well
- 10.2. Market Analysis, Insights and Forecast - by Application
- 10.2.1. Offshore
- 10.2.2. Onshore
- 10.1. Market Analysis, Insights and Forecast - by Type
- 11. Middle East and Africa Pump Jack Industry Analysis, Insights and Forecast, 2020-2032
- 11.1. Market Analysis, Insights and Forecast - by Type
- 11.1.1. Vertical Well
- 11.1.2. Horizontal Well
- 11.2. Market Analysis, Insights and Forecast - by Application
- 11.2.1. Offshore
- 11.2.2. Onshore
- 11.1. Market Analysis, Insights and Forecast - by Type
- 12. Competitive Analysis
- 12.1. Company Profiles
- 12.1.1 Weil-McLain (Shandong) Cast-Iron-Boiler Co Ltd
- 12.1.1.1. Company Overview
- 12.1.1.2. Products
- 12.1.1.3. Company Financials
- 12.1.1.4. SWOT Analysis
- 12.1.2 Flotek Industries Inc
- 12.1.2.1. Company Overview
- 12.1.2.2. Products
- 12.1.2.3. Company Financials
- 12.1.2.4. SWOT Analysis
- 12.1.3 Alkhorayef Commercial Co
- 12.1.3.1. Company Overview
- 12.1.3.2. Products
- 12.1.3.3. Company Financials
- 12.1.3.4. SWOT Analysis
- 12.1.4 Baker Hughes Company
- 12.1.4.1. Company Overview
- 12.1.4.2. Products
- 12.1.4.3. Company Financials
- 12.1.4.4. SWOT Analysis
- 12.1.5 Halliburton Company
- 12.1.5.1. Company Overview
- 12.1.5.2. Products
- 12.1.5.3. Company Financials
- 12.1.5.4. SWOT Analysis
- 12.1.6 National-Oilwell Varco Inc
- 12.1.6.1. Company Overview
- 12.1.6.2. Products
- 12.1.6.3. Company Financials
- 12.1.6.4. SWOT Analysis
- 12.1.7 Borets International Ltd
- 12.1.7.1. Company Overview
- 12.1.7.2. Products
- 12.1.7.3. Company Financials
- 12.1.7.4. SWOT Analysis
- 12.1.8 Weatherford International Ltd
- 12.1.8.1. Company Overview
- 12.1.8.2. Products
- 12.1.8.3. Company Financials
- 12.1.8.4. SWOT Analysis
- 12.1.9 Schlumberger Limited
- 12.1.9.1. Company Overview
- 12.1.9.2. Products
- 12.1.9.3. Company Financials
- 12.1.9.4. SWOT Analysis
- 12.1.10 Dover Corp
- 12.1.10.1. Company Overview
- 12.1.10.2. Products
- 12.1.10.3. Company Financials
- 12.1.10.4. SWOT Analysis
- 12.1.1 Weil-McLain (Shandong) Cast-Iron-Boiler Co Ltd
- 12.2. Market Entropy
- 12.2.1 Company's Key Areas Served
- 12.2.2 Recent Developments
- 12.3. Company Market Share Analysis 2025
- 12.3.1 Top 5 Companies Market Share Analysis
- 12.3.2 Top 3 Companies Market Share Analysis
- 12.4. List of Potential Customers
- 13. Research Methodology
List of Figures
- Figure 1: Global Pump Jack Industry Revenue Breakdown (million, %) by Region 2025 & 2033
- Figure 2: North America Pump Jack Industry Revenue (million), by Type 2025 & 2033
- Figure 3: North America Pump Jack Industry Revenue Share (%), by Type 2025 & 2033
- Figure 4: North America Pump Jack Industry Revenue (million), by Application 2025 & 2033
- Figure 5: North America Pump Jack Industry Revenue Share (%), by Application 2025 & 2033
- Figure 6: North America Pump Jack Industry Revenue (million), by Country 2025 & 2033
- Figure 7: North America Pump Jack Industry Revenue Share (%), by Country 2025 & 2033
- Figure 8: Asia Pacific Pump Jack Industry Revenue (million), by Type 2025 & 2033
- Figure 9: Asia Pacific Pump Jack Industry Revenue Share (%), by Type 2025 & 2033
- Figure 10: Asia Pacific Pump Jack Industry Revenue (million), by Application 2025 & 2033
- Figure 11: Asia Pacific Pump Jack Industry Revenue Share (%), by Application 2025 & 2033
- Figure 12: Asia Pacific Pump Jack Industry Revenue (million), by Country 2025 & 2033
- Figure 13: Asia Pacific Pump Jack Industry Revenue Share (%), by Country 2025 & 2033
- Figure 14: Europe Pump Jack Industry Revenue (million), by Type 2025 & 2033
- Figure 15: Europe Pump Jack Industry Revenue Share (%), by Type 2025 & 2033
- Figure 16: Europe Pump Jack Industry Revenue (million), by Application 2025 & 2033
- Figure 17: Europe Pump Jack Industry Revenue Share (%), by Application 2025 & 2033
- Figure 18: Europe Pump Jack Industry Revenue (million), by Country 2025 & 2033
- Figure 19: Europe Pump Jack Industry Revenue Share (%), by Country 2025 & 2033
- Figure 20: South America Pump Jack Industry Revenue (million), by Type 2025 & 2033
- Figure 21: South America Pump Jack Industry Revenue Share (%), by Type 2025 & 2033
- Figure 22: South America Pump Jack Industry Revenue (million), by Application 2025 & 2033
- Figure 23: South America Pump Jack Industry Revenue Share (%), by Application 2025 & 2033
- Figure 24: South America Pump Jack Industry Revenue (million), by Country 2025 & 2033
- Figure 25: South America Pump Jack Industry Revenue Share (%), by Country 2025 & 2033
- Figure 26: Middle East and Africa Pump Jack Industry Revenue (million), by Type 2025 & 2033
- Figure 27: Middle East and Africa Pump Jack Industry Revenue Share (%), by Type 2025 & 2033
- Figure 28: Middle East and Africa Pump Jack Industry Revenue (million), by Application 2025 & 2033
- Figure 29: Middle East and Africa Pump Jack Industry Revenue Share (%), by Application 2025 & 2033
- Figure 30: Middle East and Africa Pump Jack Industry Revenue (million), by Country 2025 & 2033
- Figure 31: Middle East and Africa Pump Jack Industry Revenue Share (%), by Country 2025 & 2033
List of Tables
- Table 1: Global Pump Jack Industry Revenue million Forecast, by Type 2020 & 2033
- Table 2: Global Pump Jack Industry Revenue million Forecast, by Application 2020 & 2033
- Table 3: Global Pump Jack Industry Revenue million Forecast, by Region 2020 & 2033
- Table 4: Global Pump Jack Industry Revenue million Forecast, by Type 2020 & 2033
- Table 5: Global Pump Jack Industry Revenue million Forecast, by Application 2020 & 2033
- Table 6: Global Pump Jack Industry Revenue million Forecast, by Country 2020 & 2033
- Table 7: Global Pump Jack Industry Revenue million Forecast, by Type 2020 & 2033
- Table 8: Global Pump Jack Industry Revenue million Forecast, by Application 2020 & 2033
- Table 9: Global Pump Jack Industry Revenue million Forecast, by Country 2020 & 2033
- Table 10: Global Pump Jack Industry Revenue million Forecast, by Type 2020 & 2033
- Table 11: Global Pump Jack Industry Revenue million Forecast, by Application 2020 & 2033
- Table 12: Global Pump Jack Industry Revenue million Forecast, by Country 2020 & 2033
- Table 13: Global Pump Jack Industry Revenue million Forecast, by Type 2020 & 2033
- Table 14: Global Pump Jack Industry Revenue million Forecast, by Application 2020 & 2033
- Table 15: Global Pump Jack Industry Revenue million Forecast, by Country 2020 & 2033
- Table 16: Global Pump Jack Industry Revenue million Forecast, by Type 2020 & 2033
- Table 17: Global Pump Jack Industry Revenue million Forecast, by Application 2020 & 2033
- Table 18: Global Pump Jack Industry Revenue million Forecast, by Country 2020 & 2033
Frequently Asked Questions
1. What is the projected Compound Annual Growth Rate (CAGR) of the Pump Jack Industry?
The projected CAGR is approximately 5.7%.
2. Which companies are prominent players in the Pump Jack Industry?
Key companies in the market include Weil-McLain (Shandong) Cast-Iron-Boiler Co Ltd, Flotek Industries Inc, Alkhorayef Commercial Co, Baker Hughes Company, Halliburton Company, National-Oilwell Varco Inc, Borets International Ltd, Weatherford International Ltd, Schlumberger Limited, Dover Corp.
3. What are the main segments of the Pump Jack Industry?
The market segments include Type, Application.
4. Can you provide details about the market size?
The market size is estimated to be USD 3687.6 million as of 2022.
5. What are some drivers contributing to market growth?
4.; Focus On Unconventional Resources4.; Global Energy Demand And Exploration Activities.
6. What are the notable trends driving market growth?
Onshore Application to Dominate the Market.
7. Are there any restraints impacting market growth?
4.; High Implementation Costs.
8. Can you provide examples of recent developments in the market?
N/A
9. What pricing options are available for accessing the report?
Pricing options include single-user, multi-user, and enterprise licenses priced at USD 4750, USD 5250, and USD 8750 respectively.
10. Is the market size provided in terms of value or volume?
The market size is provided in terms of value, measured in million.
11. Are there any specific market keywords associated with the report?
Yes, the market keyword associated with the report is "Pump Jack Industry," which aids in identifying and referencing the specific market segment covered.
12. How do I determine which pricing option suits my needs best?
The pricing options vary based on user requirements and access needs. Individual users may opt for single-user licenses, while businesses requiring broader access may choose multi-user or enterprise licenses for cost-effective access to the report.
13. Are there any additional resources or data provided in the Pump Jack Industry report?
While the report offers comprehensive insights, it's advisable to review the specific contents or supplementary materials provided to ascertain if additional resources or data are available.
14. How can I stay updated on further developments or reports in the Pump Jack Industry?
To stay informed about further developments, trends, and reports in the Pump Jack Industry, consider subscribing to industry newsletters, following relevant companies and organizations, or regularly checking reputable industry news sources and publications.
Methodology
Step 1 - Identification of Relevant Samples Size from Population Database


Step 2 - Approaches for Defining Global Market Size (Value, Volume* & Price*)

Note*: In applicable scenarios
Step 3 - Data Sources
Primary Research
- Web Analytics
- Survey Reports
- Research Institute
- Latest Research Reports
- Opinion Leaders
Secondary Research
- Annual Reports
- White Paper
- Latest Press Release
- Industry Association
- Paid Database
- Investor Presentations

Step 4 - Data Triangulation
Involves using different sources of information in order to increase the validity of a study
These sources are likely to be stakeholders in a program - participants, other researchers, program staff, other community members, and so on.
Then we put all data in single framework & apply various statistical tools to find out the dynamic on the market.
During the analysis stage, feedback from the stakeholder groups would be compared to determine areas of agreement as well as areas of divergence