

Key Insights
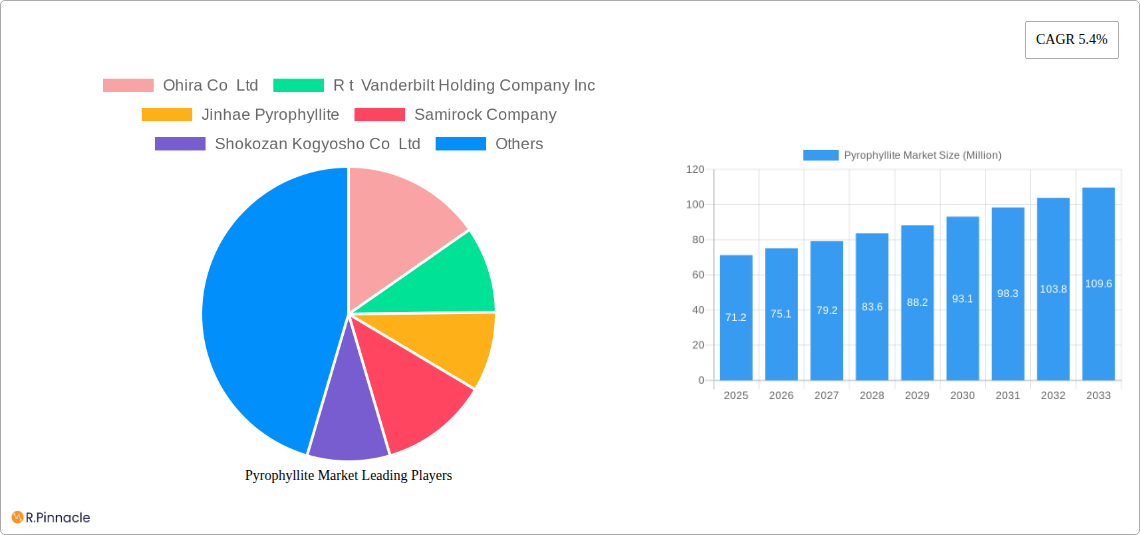
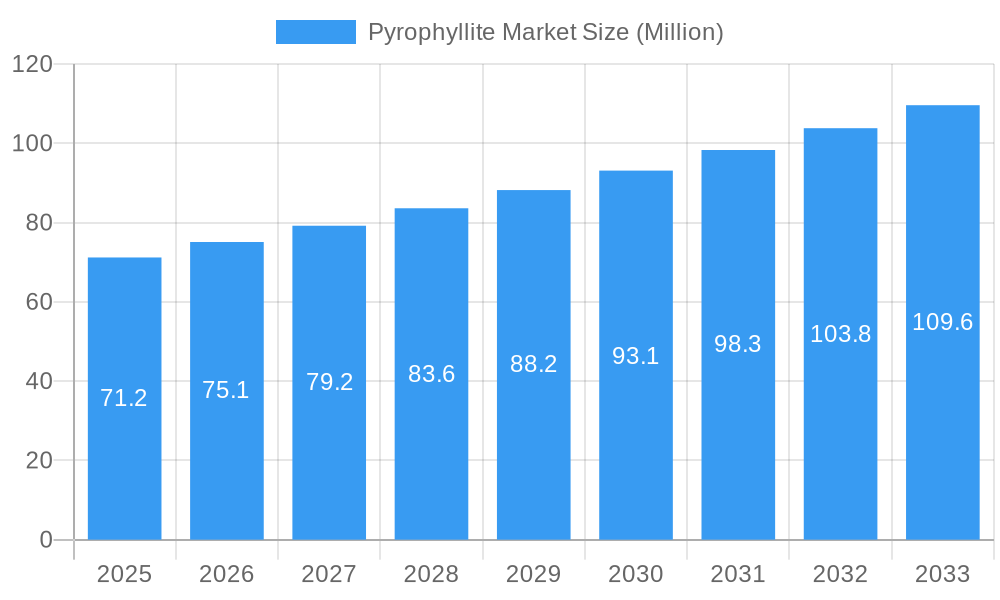
The global pyrophyllite market, valued at $71.2 million in 2025, is projected to experience robust growth, driven by its increasing applications across diverse industries. A compound annual growth rate (CAGR) of 5.4% from 2025 to 2033 indicates a significant market expansion, reaching an estimated value exceeding $110 million by 2033. Key drivers include the rising demand for pyrophyllite in the ceramics industry, where its unique properties enhance product durability and performance. The growing construction sector further fuels demand, particularly in the production of fiberglass and filler materials for paints and insecticides. The use of pyrophyllite as a soil conditioner in fertilizers is also gaining traction, contributing to market growth. While supply chain disruptions and fluctuating raw material prices pose potential challenges, the market's overall positive trajectory is bolstered by continuous innovation in pyrophyllite processing and application techniques, leading to the development of advanced ceramit formulations like Pyrophyllite Ceramit 10 and 14, catering to specialized needs within specific applications. Furthermore, exploration of new applications in areas such as ornamental stones and refractories is expected to expand the market's reach and diversify its revenue streams in the coming years.
Pyrophyllite Market Market Size (In Million)
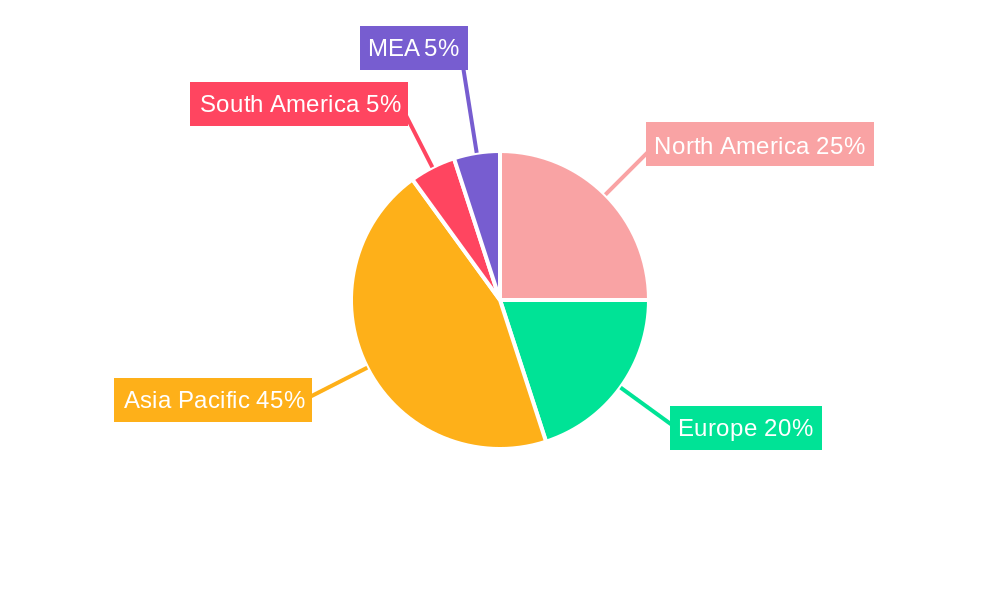
The market is segmented by type (Pyrophyllite Natural, Pyrophyllite Ceramit 10, Pyrophyllite Ceramit 14) and application (Ceramics, Fiberglass, Filler Materials, Fertilizer, Rubber & Roofing, Refractory, Ornamental Stones, Other Applications). The ceramics segment currently holds a significant market share, but the rising demand for sustainable and eco-friendly construction materials is driving increased adoption of pyrophyllite in fiberglass and filler applications. Geographical distribution reflects significant market presence in Asia-Pacific, driven by robust industrial growth in countries like China and India. North America and Europe also hold considerable market shares, fueled by demand from established industries in these regions. Key players such as Ohira Co Ltd, R.T. Vanderbilt Holding Company Inc., and Jinhae Pyrophyllite are actively shaping market dynamics through strategic expansions, technological advancements, and competitive pricing strategies. The market's future growth trajectory is closely tied to global economic conditions, technological innovations, and environmental regulations influencing material choices across diverse industries.
Pyrophyllite Market Company Market Share
Pyrophyllite Market Report: A Comprehensive Analysis (2019-2033)
This in-depth report provides a comprehensive analysis of the global Pyrophyllite market, offering invaluable insights for industry professionals, investors, and strategic decision-makers. Covering the period from 2019 to 2033, with a focus on 2025, this report delves into market dynamics, segmentation, leading players, and future growth potential. Expect detailed data, precise forecasts, and actionable recommendations to navigate the evolving landscape of the Pyrophyllite market. The market is projected to reach xx Million by 2033.
Pyrophyllite Market Structure & Innovation Trends
This section analyzes the competitive landscape of the Pyrophyllite market, exploring market concentration, innovation drivers, regulatory frameworks, and industry dynamics. We examine the impact of mergers and acquisitions (M&A) activity, providing insights into deal values and market share shifts.
Market Concentration: The Pyrophyllite market exhibits a [Describe Market Concentration - e.g., moderately concentrated] structure, with key players holding [XX]% of the overall market share in 2024. Smaller players account for the remaining [XX]%.
Innovation Drivers: Continuous innovation in processing techniques, expansion into new applications, and the development of value-added products drive market growth. Focus is on enhancing product quality, reducing costs, and meeting diverse industry demands.
Regulatory Frameworks: Government regulations related to environmental protection and material safety significantly impact market dynamics. Compliance costs and stringent norms influence business strategies and product development.
Product Substitutes: [List and discuss key substitute materials and their market impact]. The competitive pressure from substitutes is [Describe the intensity of competition - e.g., moderate] and varies across different applications.
End-User Demographics: The primary end-users of pyrophyllite are in the [List key end-user industries with percentage breakdown]. Growth in these sectors fuels demand for pyrophyllite.
M&A Activities: Significant M&A activity has been observed in recent years, with [Number] deals valued at approximately [XX] Million in the period 2019-2024. These mergers and acquisitions have resulted in [Describe the impact of M&A activity - e.g., increased market consolidation and expansion into new geographical regions].
Pyrophyllite Market Dynamics & Trends
This section details the factors influencing the growth and trajectory of the Pyrophyllite market. We analyze market growth drivers, technological advancements, evolving consumer preferences, and competitive pressures, providing insights into the overall market dynamics. The market exhibits a CAGR of [XX]% during the forecast period (2025-2033), with market penetration in key applications continuously expanding. [Detailed analysis of market growth drivers, technological disruptions, consumer preferences and competitive dynamics. Include specific metrics like CAGR and market penetration for each factor].
Dominant Regions & Segments in Pyrophyllite Market
This section identifies the leading regions and segments within the Pyrophyllite market. We analyze the key factors driving dominance in specific geographical locations and application areas.
Leading Region/Country: [Name the leading region/country and explain the reasons for its dominance].
Dominant Segments:
Type: [Analyze the market share and growth prospects of Pyrophyllite Natural, Pyrophyllite Ceramit 10, and Pyrophyllite Ceramit 14. Identify the dominant type and explain the reasons for its dominance].
Application: [Analyze the market share and growth prospects of Ceramics, Fiberglass, Filler Materials, Fertilizer, Rubber and Roofing, Refractory, Ornamental Stones, and Other Applications. Identify the dominant application(s) and explain the reasons for their dominance].
Key Drivers (Bullet Points):
- [List bullet points of key economic policies, infrastructure developments, and other factors driving growth in the dominant region/segment.]
[Detailed dominance analysis paragraphs]
Pyrophyllite Market Product Innovations
Recent years have witnessed significant innovations in pyrophyllite processing and applications. These developments focus on enhanced performance characteristics, wider applicability, and cost-effectiveness. [Describe specific examples of product innovations, highlighting their competitive advantages and market fit]. Technological trends are steering the development of [mention key technological trends like nano-pyrophyllite, etc.].
Report Scope & Segmentation Analysis
This report segments the Pyrophyllite market by type (Pyrophyllite Natural, Pyrophyllite Ceramit 10, Pyrophyllite Ceramit 14) and application (Ceramics, Fiberglass, Filler Materials, Fertilizer, Rubber and Roofing, Refractory, Ornamental Stones, Other Applications). Each segment is analyzed in terms of growth projections, market size, and competitive dynamics. [Paragraph for each segment detailing growth projections, market sizes, and competitive dynamics].
Key Drivers of Pyrophyllite Market Growth
The growth of the Pyrophyllite market is driven by several factors: [Explain technological advancements, expanding industrialization, increasing demand in key application sectors, and favorable government policies, with specific examples].
Challenges in the Pyrophyllite Market Sector
The Pyrophyllite market faces challenges, including [Discuss regulatory hurdles, fluctuations in raw material prices, supply chain disruptions, and intense competition, with quantifiable impacts].
Emerging Opportunities in Pyrophyllite Market
Emerging opportunities lie in [Highlight new applications in emerging economies, the development of innovative product formulations, and technological advancements that improve product performance or reduce costs].
Leading Players in the Pyrophyllite Market Market
- Ohira Co Ltd
- R t Vanderbilt Holding Company Inc
- Jinhae Pyrophyllite
- Samirock Company
- Shokozan Kogyosho Co Ltd
- Hankook Mineral Powder Co Ltd
- Anand Talc
- Wonderstone
- Pt Gunung Bale
- Minkyung Industrial Co Ltd
- SKKU Minerals
- Idwala Industrial Holdings (Pty) Ltd
- Shinagawa Shirenga Co Ltd
Key Developments in Pyrophyllite Market Industry
- [List key developments with year/month, emphasizing their impact on market dynamics. Examples include product launches, mergers, acquisitions, etc.]
Future Outlook for Pyrophyllite Market Market
The future of the Pyrophyllite market appears promising, driven by [Summarize growth accelerators such as continuous innovation, expansion into new applications, and growth in key end-use sectors]. The market is poised for significant growth, presenting numerous strategic opportunities for businesses to capitalize on.
Pyrophyllite Market Segmentation
-
1. Type
- 1.1. Pyrophyllite Natural
- 1.2. Other Grades (Ceramit 10, Ceramit 14, etc.)
-
2. Application
- 2.1. Ceramics
- 2.2. Fiberglass
- 2.3. Filler Materials (Paper, Insecticides, Paints)
- 2.4. Fertilizer (Soil Conditioner)
- 2.5. Rubber and Roofing (As Dusting Agents)
- 2.6. Refractory
- 2.7. Ornamental Stones
- 2.8. Other Applications
Pyrophyllite Market Segmentation By Geography
-
1. Asia Pacific
- 1.1. China
- 1.2. India
- 1.3. Japan
- 1.4. South Korea
- 1.5. Malaysia
- 1.6. Thailand
- 1.7. Indonesia
- 1.8. Vietnam
- 1.9. Rest of Asia Pacific
-
2. North America
- 2.1. United States
- 2.2. Canada
- 2.3. Mexico
-
3. Europe
- 3.1. Germany
- 3.2. United Kingdom
- 3.3. France
- 3.4. Italy
- 3.5. Spain
- 3.6. NORDIC Countries
- 3.7. Turkey
- 3.8. Russia
- 3.9. Rest of Europe
-
4. South America
- 4.1. Brazil
- 4.2. Argentina
- 4.3. Colombia
- 4.4. Rest of South America
-
5. Middle East and Africa
- 5.1. Saudi Arabia
- 5.2. Qatar
- 5.3. United Arab Emirates
- 5.4. Nigeria
- 5.5. Egypt
- 5.6. South Africa
- 5.7. Rest of Middle East and Africa
Pyrophyllite Market Regional Market Share
Geographic Coverage of Pyrophyllite Market
Pyrophyllite Market REPORT HIGHLIGHTS
| Aspects | Details |
|---|---|
| Study Period | 2020-2034 |
| Base Year | 2025 |
| Estimated Year | 2026 |
| Forecast Period | 2026-2034 |
| Historical Period | 2020-2025 |
| Growth Rate | CAGR of 5.4% from 2020-2034 |
| Segmentation |
|
Table of Contents
- 1. Introduction
- 1.1. Research Scope
- 1.2. Market Segmentation
- 1.3. Research Objective
- 1.4. Definitions and Assumptions
- 2. Executive Summary
- 2.1. Market Snapshot
- 3. Market Dynamics
- 3.1. Market Drivers
- 3.2. Market Restrains
- 3.3. Market Trends
- 3.4. Market Opportunities
- 4. Market Factor Analysis
- 4.1. Porters Five Forces
- 4.1.1. Bargaining Power of Suppliers
- 4.1.2. Bargaining Power of Buyers
- 4.1.3. Threat of New Entrants
- 4.1.4. Threat of Substitutes
- 4.1.5. Competitive Rivalry
- 4.2. PESTEL analysis
- 4.3. BCG Analysis
- 4.3.1. Stars (High Growth, High Market Share)
- 4.3.2. Cash Cows (Low Growth, High Market Share)
- 4.3.3. Question Mark (High Growth, Low Market Share)
- 4.3.4. Dogs (Low Growth, Low Market Share)
- 4.4. Ansoff Matrix Analysis
- 4.5. Supply Chain Analysis
- 4.6. Regulatory Landscape
- 4.7. Current Market Potential and Opportunity Assessment (TAM–SAM–SOM Framework)
- 4.8. PRI Analyst Note
- 4.1. Porters Five Forces
- 5. Market Analysis, Insights and Forecast 2021-2033
- 5.1. Market Analysis, Insights and Forecast - by Type
- 5.1.1. Pyrophyllite Natural
- 5.1.2. Other Grades (Ceramit 10, Ceramit 14, etc.)
- 5.2. Market Analysis, Insights and Forecast - by Application
- 5.2.1. Ceramics
- 5.2.2. Fiberglass
- 5.2.3. Filler Materials (Paper, Insecticides, Paints)
- 5.2.4. Fertilizer (Soil Conditioner)
- 5.2.5. Rubber and Roofing (As Dusting Agents)
- 5.2.6. Refractory
- 5.2.7. Ornamental Stones
- 5.2.8. Other Applications
- 5.3. Market Analysis, Insights and Forecast - by Region
- 5.3.1. Asia Pacific
- 5.3.2. North America
- 5.3.3. Europe
- 5.3.4. South America
- 5.3.5. Middle East and Africa
- 5.1. Market Analysis, Insights and Forecast - by Type
- 6. Global Pyrophyllite Market Analysis, Insights and Forecast, 2021-2033
- 6.1. Market Analysis, Insights and Forecast - by Type
- 6.1.1. Pyrophyllite Natural
- 6.1.2. Other Grades (Ceramit 10, Ceramit 14, etc.)
- 6.2. Market Analysis, Insights and Forecast - by Application
- 6.2.1. Ceramics
- 6.2.2. Fiberglass
- 6.2.3. Filler Materials (Paper, Insecticides, Paints)
- 6.2.4. Fertilizer (Soil Conditioner)
- 6.2.5. Rubber and Roofing (As Dusting Agents)
- 6.2.6. Refractory
- 6.2.7. Ornamental Stones
- 6.2.8. Other Applications
- 6.1. Market Analysis, Insights and Forecast - by Type
- 7. Asia Pacific Pyrophyllite Market Analysis, Insights and Forecast, 2020-2032
- 7.1. Market Analysis, Insights and Forecast - by Type
- 7.1.1. Pyrophyllite Natural
- 7.1.2. Other Grades (Ceramit 10, Ceramit 14, etc.)
- 7.2. Market Analysis, Insights and Forecast - by Application
- 7.2.1. Ceramics
- 7.2.2. Fiberglass
- 7.2.3. Filler Materials (Paper, Insecticides, Paints)
- 7.2.4. Fertilizer (Soil Conditioner)
- 7.2.5. Rubber and Roofing (As Dusting Agents)
- 7.2.6. Refractory
- 7.2.7. Ornamental Stones
- 7.2.8. Other Applications
- 7.1. Market Analysis, Insights and Forecast - by Type
- 8. North America Pyrophyllite Market Analysis, Insights and Forecast, 2020-2032
- 8.1. Market Analysis, Insights and Forecast - by Type
- 8.1.1. Pyrophyllite Natural
- 8.1.2. Other Grades (Ceramit 10, Ceramit 14, etc.)
- 8.2. Market Analysis, Insights and Forecast - by Application
- 8.2.1. Ceramics
- 8.2.2. Fiberglass
- 8.2.3. Filler Materials (Paper, Insecticides, Paints)
- 8.2.4. Fertilizer (Soil Conditioner)
- 8.2.5. Rubber and Roofing (As Dusting Agents)
- 8.2.6. Refractory
- 8.2.7. Ornamental Stones
- 8.2.8. Other Applications
- 8.1. Market Analysis, Insights and Forecast - by Type
- 9. Europe Pyrophyllite Market Analysis, Insights and Forecast, 2020-2032
- 9.1. Market Analysis, Insights and Forecast - by Type
- 9.1.1. Pyrophyllite Natural
- 9.1.2. Other Grades (Ceramit 10, Ceramit 14, etc.)
- 9.2. Market Analysis, Insights and Forecast - by Application
- 9.2.1. Ceramics
- 9.2.2. Fiberglass
- 9.2.3. Filler Materials (Paper, Insecticides, Paints)
- 9.2.4. Fertilizer (Soil Conditioner)
- 9.2.5. Rubber and Roofing (As Dusting Agents)
- 9.2.6. Refractory
- 9.2.7. Ornamental Stones
- 9.2.8. Other Applications
- 9.1. Market Analysis, Insights and Forecast - by Type
- 10. South America Pyrophyllite Market Analysis, Insights and Forecast, 2020-2032
- 10.1. Market Analysis, Insights and Forecast - by Type
- 10.1.1. Pyrophyllite Natural
- 10.1.2. Other Grades (Ceramit 10, Ceramit 14, etc.)
- 10.2. Market Analysis, Insights and Forecast - by Application
- 10.2.1. Ceramics
- 10.2.2. Fiberglass
- 10.2.3. Filler Materials (Paper, Insecticides, Paints)
- 10.2.4. Fertilizer (Soil Conditioner)
- 10.2.5. Rubber and Roofing (As Dusting Agents)
- 10.2.6. Refractory
- 10.2.7. Ornamental Stones
- 10.2.8. Other Applications
- 10.1. Market Analysis, Insights and Forecast - by Type
- 11. Middle East and Africa Pyrophyllite Market Analysis, Insights and Forecast, 2020-2032
- 11.1. Market Analysis, Insights and Forecast - by Type
- 11.1.1. Pyrophyllite Natural
- 11.1.2. Other Grades (Ceramit 10, Ceramit 14, etc.)
- 11.2. Market Analysis, Insights and Forecast - by Application
- 11.2.1. Ceramics
- 11.2.2. Fiberglass
- 11.2.3. Filler Materials (Paper, Insecticides, Paints)
- 11.2.4. Fertilizer (Soil Conditioner)
- 11.2.5. Rubber and Roofing (As Dusting Agents)
- 11.2.6. Refractory
- 11.2.7. Ornamental Stones
- 11.2.8. Other Applications
- 11.1. Market Analysis, Insights and Forecast - by Type
- 12. Competitive Analysis
- 12.1. Company Profiles
- 12.1.1 Ohira Co Ltd
- 12.1.1.1. Company Overview
- 12.1.1.2. Products
- 12.1.1.3. Company Financials
- 12.1.1.4. SWOT Analysis
- 12.1.2 R t Vanderbilt Holding Company Inc
- 12.1.2.1. Company Overview
- 12.1.2.2. Products
- 12.1.2.3. Company Financials
- 12.1.2.4. SWOT Analysis
- 12.1.3 Jinhae Pyrophyllite
- 12.1.3.1. Company Overview
- 12.1.3.2. Products
- 12.1.3.3. Company Financials
- 12.1.3.4. SWOT Analysis
- 12.1.4 Samirock Company
- 12.1.4.1. Company Overview
- 12.1.4.2. Products
- 12.1.4.3. Company Financials
- 12.1.4.4. SWOT Analysis
- 12.1.5 Shokozan Kogyosho Co Ltd
- 12.1.5.1. Company Overview
- 12.1.5.2. Products
- 12.1.5.3. Company Financials
- 12.1.5.4. SWOT Analysis
- 12.1.6 Hankook Mineral Powder Co Ltd
- 12.1.6.1. Company Overview
- 12.1.6.2. Products
- 12.1.6.3. Company Financials
- 12.1.6.4. SWOT Analysis
- 12.1.7 Anand Talc
- 12.1.7.1. Company Overview
- 12.1.7.2. Products
- 12.1.7.3. Company Financials
- 12.1.7.4. SWOT Analysis
- 12.1.8 Wonderstone
- 12.1.8.1. Company Overview
- 12.1.8.2. Products
- 12.1.8.3. Company Financials
- 12.1.8.4. SWOT Analysis
- 12.1.9 Pt Gunung Bale
- 12.1.9.1. Company Overview
- 12.1.9.2. Products
- 12.1.9.3. Company Financials
- 12.1.9.4. SWOT Analysis
- 12.1.10 Minkyung Industrial Co Ltd
- 12.1.10.1. Company Overview
- 12.1.10.2. Products
- 12.1.10.3. Company Financials
- 12.1.10.4. SWOT Analysis
- 12.1.11 SKKU Minerals
- 12.1.11.1. Company Overview
- 12.1.11.2. Products
- 12.1.11.3. Company Financials
- 12.1.11.4. SWOT Analysis
- 12.1.12 Idwala Industrial Holdings (Pty) Ltd
- 12.1.12.1. Company Overview
- 12.1.12.2. Products
- 12.1.12.3. Company Financials
- 12.1.12.4. SWOT Analysis
- 12.1.13 Shinagawa Shirenga Co Ltd
- 12.1.13.1. Company Overview
- 12.1.13.2. Products
- 12.1.13.3. Company Financials
- 12.1.13.4. SWOT Analysis
- 12.1.1 Ohira Co Ltd
- 12.2. Market Entropy
- 12.2.1 Company's Key Areas Served
- 12.2.2 Recent Developments
- 12.3. Company Market Share Analysis 2025
- 12.3.1 Top 5 Companies Market Share Analysis
- 12.3.2 Top 3 Companies Market Share Analysis
- 12.4. List of Potential Customers
- 13. Research Methodology
List of Figures
- Figure 1: Global Pyrophyllite Market Revenue Breakdown (Million, %) by Region 2025 & 2033
- Figure 2: Global Pyrophyllite Market Volume Breakdown (K Tons, %) by Region 2025 & 2033
- Figure 3: Asia Pacific Pyrophyllite Market Revenue (Million), by Type 2025 & 2033
- Figure 4: Asia Pacific Pyrophyllite Market Volume (K Tons), by Type 2025 & 2033
- Figure 5: Asia Pacific Pyrophyllite Market Revenue Share (%), by Type 2025 & 2033
- Figure 6: Asia Pacific Pyrophyllite Market Volume Share (%), by Type 2025 & 2033
- Figure 7: Asia Pacific Pyrophyllite Market Revenue (Million), by Application 2025 & 2033
- Figure 8: Asia Pacific Pyrophyllite Market Volume (K Tons), by Application 2025 & 2033
- Figure 9: Asia Pacific Pyrophyllite Market Revenue Share (%), by Application 2025 & 2033
- Figure 10: Asia Pacific Pyrophyllite Market Volume Share (%), by Application 2025 & 2033
- Figure 11: Asia Pacific Pyrophyllite Market Revenue (Million), by Country 2025 & 2033
- Figure 12: Asia Pacific Pyrophyllite Market Volume (K Tons), by Country 2025 & 2033
- Figure 13: Asia Pacific Pyrophyllite Market Revenue Share (%), by Country 2025 & 2033
- Figure 14: Asia Pacific Pyrophyllite Market Volume Share (%), by Country 2025 & 2033
- Figure 15: North America Pyrophyllite Market Revenue (Million), by Type 2025 & 2033
- Figure 16: North America Pyrophyllite Market Volume (K Tons), by Type 2025 & 2033
- Figure 17: North America Pyrophyllite Market Revenue Share (%), by Type 2025 & 2033
- Figure 18: North America Pyrophyllite Market Volume Share (%), by Type 2025 & 2033
- Figure 19: North America Pyrophyllite Market Revenue (Million), by Application 2025 & 2033
- Figure 20: North America Pyrophyllite Market Volume (K Tons), by Application 2025 & 2033
- Figure 21: North America Pyrophyllite Market Revenue Share (%), by Application 2025 & 2033
- Figure 22: North America Pyrophyllite Market Volume Share (%), by Application 2025 & 2033
- Figure 23: North America Pyrophyllite Market Revenue (Million), by Country 2025 & 2033
- Figure 24: North America Pyrophyllite Market Volume (K Tons), by Country 2025 & 2033
- Figure 25: North America Pyrophyllite Market Revenue Share (%), by Country 2025 & 2033
- Figure 26: North America Pyrophyllite Market Volume Share (%), by Country 2025 & 2033
- Figure 27: Europe Pyrophyllite Market Revenue (Million), by Type 2025 & 2033
- Figure 28: Europe Pyrophyllite Market Volume (K Tons), by Type 2025 & 2033
- Figure 29: Europe Pyrophyllite Market Revenue Share (%), by Type 2025 & 2033
- Figure 30: Europe Pyrophyllite Market Volume Share (%), by Type 2025 & 2033
- Figure 31: Europe Pyrophyllite Market Revenue (Million), by Application 2025 & 2033
- Figure 32: Europe Pyrophyllite Market Volume (K Tons), by Application 2025 & 2033
- Figure 33: Europe Pyrophyllite Market Revenue Share (%), by Application 2025 & 2033
- Figure 34: Europe Pyrophyllite Market Volume Share (%), by Application 2025 & 2033
- Figure 35: Europe Pyrophyllite Market Revenue (Million), by Country 2025 & 2033
- Figure 36: Europe Pyrophyllite Market Volume (K Tons), by Country 2025 & 2033
- Figure 37: Europe Pyrophyllite Market Revenue Share (%), by Country 2025 & 2033
- Figure 38: Europe Pyrophyllite Market Volume Share (%), by Country 2025 & 2033
- Figure 39: South America Pyrophyllite Market Revenue (Million), by Type 2025 & 2033
- Figure 40: South America Pyrophyllite Market Volume (K Tons), by Type 2025 & 2033
- Figure 41: South America Pyrophyllite Market Revenue Share (%), by Type 2025 & 2033
- Figure 42: South America Pyrophyllite Market Volume Share (%), by Type 2025 & 2033
- Figure 43: South America Pyrophyllite Market Revenue (Million), by Application 2025 & 2033
- Figure 44: South America Pyrophyllite Market Volume (K Tons), by Application 2025 & 2033
- Figure 45: South America Pyrophyllite Market Revenue Share (%), by Application 2025 & 2033
- Figure 46: South America Pyrophyllite Market Volume Share (%), by Application 2025 & 2033
- Figure 47: South America Pyrophyllite Market Revenue (Million), by Country 2025 & 2033
- Figure 48: South America Pyrophyllite Market Volume (K Tons), by Country 2025 & 2033
- Figure 49: South America Pyrophyllite Market Revenue Share (%), by Country 2025 & 2033
- Figure 50: South America Pyrophyllite Market Volume Share (%), by Country 2025 & 2033
- Figure 51: Middle East and Africa Pyrophyllite Market Revenue (Million), by Type 2025 & 2033
- Figure 52: Middle East and Africa Pyrophyllite Market Volume (K Tons), by Type 2025 & 2033
- Figure 53: Middle East and Africa Pyrophyllite Market Revenue Share (%), by Type 2025 & 2033
- Figure 54: Middle East and Africa Pyrophyllite Market Volume Share (%), by Type 2025 & 2033
- Figure 55: Middle East and Africa Pyrophyllite Market Revenue (Million), by Application 2025 & 2033
- Figure 56: Middle East and Africa Pyrophyllite Market Volume (K Tons), by Application 2025 & 2033
- Figure 57: Middle East and Africa Pyrophyllite Market Revenue Share (%), by Application 2025 & 2033
- Figure 58: Middle East and Africa Pyrophyllite Market Volume Share (%), by Application 2025 & 2033
- Figure 59: Middle East and Africa Pyrophyllite Market Revenue (Million), by Country 2025 & 2033
- Figure 60: Middle East and Africa Pyrophyllite Market Volume (K Tons), by Country 2025 & 2033
- Figure 61: Middle East and Africa Pyrophyllite Market Revenue Share (%), by Country 2025 & 2033
- Figure 62: Middle East and Africa Pyrophyllite Market Volume Share (%), by Country 2025 & 2033
List of Tables
- Table 1: Global Pyrophyllite Market Revenue Million Forecast, by Type 2020 & 2033
- Table 2: Global Pyrophyllite Market Volume K Tons Forecast, by Type 2020 & 2033
- Table 3: Global Pyrophyllite Market Revenue Million Forecast, by Application 2020 & 2033
- Table 4: Global Pyrophyllite Market Volume K Tons Forecast, by Application 2020 & 2033
- Table 5: Global Pyrophyllite Market Revenue Million Forecast, by Region 2020 & 2033
- Table 6: Global Pyrophyllite Market Volume K Tons Forecast, by Region 2020 & 2033
- Table 7: Global Pyrophyllite Market Revenue Million Forecast, by Type 2020 & 2033
- Table 8: Global Pyrophyllite Market Volume K Tons Forecast, by Type 2020 & 2033
- Table 9: Global Pyrophyllite Market Revenue Million Forecast, by Application 2020 & 2033
- Table 10: Global Pyrophyllite Market Volume K Tons Forecast, by Application 2020 & 2033
- Table 11: Global Pyrophyllite Market Revenue Million Forecast, by Country 2020 & 2033
- Table 12: Global Pyrophyllite Market Volume K Tons Forecast, by Country 2020 & 2033
- Table 13: China Pyrophyllite Market Revenue (Million) Forecast, by Application 2020 & 2033
- Table 14: China Pyrophyllite Market Volume (K Tons) Forecast, by Application 2020 & 2033
- Table 15: India Pyrophyllite Market Revenue (Million) Forecast, by Application 2020 & 2033
- Table 16: India Pyrophyllite Market Volume (K Tons) Forecast, by Application 2020 & 2033
- Table 17: Japan Pyrophyllite Market Revenue (Million) Forecast, by Application 2020 & 2033
- Table 18: Japan Pyrophyllite Market Volume (K Tons) Forecast, by Application 2020 & 2033
- Table 19: South Korea Pyrophyllite Market Revenue (Million) Forecast, by Application 2020 & 2033
- Table 20: South Korea Pyrophyllite Market Volume (K Tons) Forecast, by Application 2020 & 2033
- Table 21: Malaysia Pyrophyllite Market Revenue (Million) Forecast, by Application 2020 & 2033
- Table 22: Malaysia Pyrophyllite Market Volume (K Tons) Forecast, by Application 2020 & 2033
- Table 23: Thailand Pyrophyllite Market Revenue (Million) Forecast, by Application 2020 & 2033
- Table 24: Thailand Pyrophyllite Market Volume (K Tons) Forecast, by Application 2020 & 2033
- Table 25: Indonesia Pyrophyllite Market Revenue (Million) Forecast, by Application 2020 & 2033
- Table 26: Indonesia Pyrophyllite Market Volume (K Tons) Forecast, by Application 2020 & 2033
- Table 27: Vietnam Pyrophyllite Market Revenue (Million) Forecast, by Application 2020 & 2033
- Table 28: Vietnam Pyrophyllite Market Volume (K Tons) Forecast, by Application 2020 & 2033
- Table 29: Rest of Asia Pacific Pyrophyllite Market Revenue (Million) Forecast, by Application 2020 & 2033
- Table 30: Rest of Asia Pacific Pyrophyllite Market Volume (K Tons) Forecast, by Application 2020 & 2033
- Table 31: Global Pyrophyllite Market Revenue Million Forecast, by Type 2020 & 2033
- Table 32: Global Pyrophyllite Market Volume K Tons Forecast, by Type 2020 & 2033
- Table 33: Global Pyrophyllite Market Revenue Million Forecast, by Application 2020 & 2033
- Table 34: Global Pyrophyllite Market Volume K Tons Forecast, by Application 2020 & 2033
- Table 35: Global Pyrophyllite Market Revenue Million Forecast, by Country 2020 & 2033
- Table 36: Global Pyrophyllite Market Volume K Tons Forecast, by Country 2020 & 2033
- Table 37: United States Pyrophyllite Market Revenue (Million) Forecast, by Application 2020 & 2033
- Table 38: United States Pyrophyllite Market Volume (K Tons) Forecast, by Application 2020 & 2033
- Table 39: Canada Pyrophyllite Market Revenue (Million) Forecast, by Application 2020 & 2033
- Table 40: Canada Pyrophyllite Market Volume (K Tons) Forecast, by Application 2020 & 2033
- Table 41: Mexico Pyrophyllite Market Revenue (Million) Forecast, by Application 2020 & 2033
- Table 42: Mexico Pyrophyllite Market Volume (K Tons) Forecast, by Application 2020 & 2033
- Table 43: Global Pyrophyllite Market Revenue Million Forecast, by Type 2020 & 2033
- Table 44: Global Pyrophyllite Market Volume K Tons Forecast, by Type 2020 & 2033
- Table 45: Global Pyrophyllite Market Revenue Million Forecast, by Application 2020 & 2033
- Table 46: Global Pyrophyllite Market Volume K Tons Forecast, by Application 2020 & 2033
- Table 47: Global Pyrophyllite Market Revenue Million Forecast, by Country 2020 & 2033
- Table 48: Global Pyrophyllite Market Volume K Tons Forecast, by Country 2020 & 2033
- Table 49: Germany Pyrophyllite Market Revenue (Million) Forecast, by Application 2020 & 2033
- Table 50: Germany Pyrophyllite Market Volume (K Tons) Forecast, by Application 2020 & 2033
- Table 51: United Kingdom Pyrophyllite Market Revenue (Million) Forecast, by Application 2020 & 2033
- Table 52: United Kingdom Pyrophyllite Market Volume (K Tons) Forecast, by Application 2020 & 2033
- Table 53: France Pyrophyllite Market Revenue (Million) Forecast, by Application 2020 & 2033
- Table 54: France Pyrophyllite Market Volume (K Tons) Forecast, by Application 2020 & 2033
- Table 55: Italy Pyrophyllite Market Revenue (Million) Forecast, by Application 2020 & 2033
- Table 56: Italy Pyrophyllite Market Volume (K Tons) Forecast, by Application 2020 & 2033
- Table 57: Spain Pyrophyllite Market Revenue (Million) Forecast, by Application 2020 & 2033
- Table 58: Spain Pyrophyllite Market Volume (K Tons) Forecast, by Application 2020 & 2033
- Table 59: NORDIC Countries Pyrophyllite Market Revenue (Million) Forecast, by Application 2020 & 2033
- Table 60: NORDIC Countries Pyrophyllite Market Volume (K Tons) Forecast, by Application 2020 & 2033
- Table 61: Turkey Pyrophyllite Market Revenue (Million) Forecast, by Application 2020 & 2033
- Table 62: Turkey Pyrophyllite Market Volume (K Tons) Forecast, by Application 2020 & 2033
- Table 63: Russia Pyrophyllite Market Revenue (Million) Forecast, by Application 2020 & 2033
- Table 64: Russia Pyrophyllite Market Volume (K Tons) Forecast, by Application 2020 & 2033
- Table 65: Rest of Europe Pyrophyllite Market Revenue (Million) Forecast, by Application 2020 & 2033
- Table 66: Rest of Europe Pyrophyllite Market Volume (K Tons) Forecast, by Application 2020 & 2033
- Table 67: Global Pyrophyllite Market Revenue Million Forecast, by Type 2020 & 2033
- Table 68: Global Pyrophyllite Market Volume K Tons Forecast, by Type 2020 & 2033
- Table 69: Global Pyrophyllite Market Revenue Million Forecast, by Application 2020 & 2033
- Table 70: Global Pyrophyllite Market Volume K Tons Forecast, by Application 2020 & 2033
- Table 71: Global Pyrophyllite Market Revenue Million Forecast, by Country 2020 & 2033
- Table 72: Global Pyrophyllite Market Volume K Tons Forecast, by Country 2020 & 2033
- Table 73: Brazil Pyrophyllite Market Revenue (Million) Forecast, by Application 2020 & 2033
- Table 74: Brazil Pyrophyllite Market Volume (K Tons) Forecast, by Application 2020 & 2033
- Table 75: Argentina Pyrophyllite Market Revenue (Million) Forecast, by Application 2020 & 2033
- Table 76: Argentina Pyrophyllite Market Volume (K Tons) Forecast, by Application 2020 & 2033
- Table 77: Colombia Pyrophyllite Market Revenue (Million) Forecast, by Application 2020 & 2033
- Table 78: Colombia Pyrophyllite Market Volume (K Tons) Forecast, by Application 2020 & 2033
- Table 79: Rest of South America Pyrophyllite Market Revenue (Million) Forecast, by Application 2020 & 2033
- Table 80: Rest of South America Pyrophyllite Market Volume (K Tons) Forecast, by Application 2020 & 2033
- Table 81: Global Pyrophyllite Market Revenue Million Forecast, by Type 2020 & 2033
- Table 82: Global Pyrophyllite Market Volume K Tons Forecast, by Type 2020 & 2033
- Table 83: Global Pyrophyllite Market Revenue Million Forecast, by Application 2020 & 2033
- Table 84: Global Pyrophyllite Market Volume K Tons Forecast, by Application 2020 & 2033
- Table 85: Global Pyrophyllite Market Revenue Million Forecast, by Country 2020 & 2033
- Table 86: Global Pyrophyllite Market Volume K Tons Forecast, by Country 2020 & 2033
- Table 87: Saudi Arabia Pyrophyllite Market Revenue (Million) Forecast, by Application 2020 & 2033
- Table 88: Saudi Arabia Pyrophyllite Market Volume (K Tons) Forecast, by Application 2020 & 2033
- Table 89: Qatar Pyrophyllite Market Revenue (Million) Forecast, by Application 2020 & 2033
- Table 90: Qatar Pyrophyllite Market Volume (K Tons) Forecast, by Application 2020 & 2033
- Table 91: United Arab Emirates Pyrophyllite Market Revenue (Million) Forecast, by Application 2020 & 2033
- Table 92: United Arab Emirates Pyrophyllite Market Volume (K Tons) Forecast, by Application 2020 & 2033
- Table 93: Nigeria Pyrophyllite Market Revenue (Million) Forecast, by Application 2020 & 2033
- Table 94: Nigeria Pyrophyllite Market Volume (K Tons) Forecast, by Application 2020 & 2033
- Table 95: Egypt Pyrophyllite Market Revenue (Million) Forecast, by Application 2020 & 2033
- Table 96: Egypt Pyrophyllite Market Volume (K Tons) Forecast, by Application 2020 & 2033
- Table 97: South Africa Pyrophyllite Market Revenue (Million) Forecast, by Application 2020 & 2033
- Table 98: South Africa Pyrophyllite Market Volume (K Tons) Forecast, by Application 2020 & 2033
- Table 99: Rest of Middle East and Africa Pyrophyllite Market Revenue (Million) Forecast, by Application 2020 & 2033
- Table 100: Rest of Middle East and Africa Pyrophyllite Market Volume (K Tons) Forecast, by Application 2020 & 2033
Frequently Asked Questions
1. What is the projected Compound Annual Growth Rate (CAGR) of the Pyrophyllite Market?
The projected CAGR is approximately 5.4%.
2. Which companies are prominent players in the Pyrophyllite Market?
Key companies in the market include Ohira Co Ltd, R t Vanderbilt Holding Company Inc, Jinhae Pyrophyllite, Samirock Company, Shokozan Kogyosho Co Ltd, Hankook Mineral Powder Co Ltd, Anand Talc, Wonderstone, Pt Gunung Bale, Minkyung Industrial Co Ltd, SKKU Minerals, Idwala Industrial Holdings (Pty) Ltd, Shinagawa Shirenga Co Ltd.
3. What are the main segments of the Pyrophyllite Market?
The market segments include Type, Application.
4. Can you provide details about the market size?
The market size is estimated to be USD 71.2 Million as of 2022.
5. What are some drivers contributing to market growth?
Growing Demand for Pyrophyllite from Ceramics in the Global Market; Increasing Consumption in Refractory and Foundry.
6. What are the notable trends driving market growth?
Growing Demand of Pyrophyllite from Ceramics in Global Market.
7. Are there any restraints impacting market growth?
Health Issues Due to Pyrophyllite Dust During Mining; Other Restraints (Availability of Substitutes).
8. Can you provide examples of recent developments in the market?
N/A
9. What pricing options are available for accessing the report?
Pricing options include single-user, multi-user, and enterprise licenses priced at USD 4750, USD 5250, and USD 8750 respectively.
10. Is the market size provided in terms of value or volume?
The market size is provided in terms of value, measured in Million and volume, measured in K Tons.
11. Are there any specific market keywords associated with the report?
Yes, the market keyword associated with the report is "Pyrophyllite Market," which aids in identifying and referencing the specific market segment covered.
12. How do I determine which pricing option suits my needs best?
The pricing options vary based on user requirements and access needs. Individual users may opt for single-user licenses, while businesses requiring broader access may choose multi-user or enterprise licenses for cost-effective access to the report.
13. Are there any additional resources or data provided in the Pyrophyllite Market report?
While the report offers comprehensive insights, it's advisable to review the specific contents or supplementary materials provided to ascertain if additional resources or data are available.
14. How can I stay updated on further developments or reports in the Pyrophyllite Market?
To stay informed about further developments, trends, and reports in the Pyrophyllite Market, consider subscribing to industry newsletters, following relevant companies and organizations, or regularly checking reputable industry news sources and publications.
Methodology
Step 1 - Identification of Relevant Samples Size from Population Database


Step 2 - Approaches for Defining Global Market Size (Value, Volume* & Price*)

Note*: In applicable scenarios
Step 3 - Data Sources
Primary Research
- Web Analytics
- Survey Reports
- Research Institute
- Latest Research Reports
- Opinion Leaders
Secondary Research
- Annual Reports
- White Paper
- Latest Press Release
- Industry Association
- Paid Database
- Investor Presentations

Step 4 - Data Triangulation
Involves using different sources of information in order to increase the validity of a study
These sources are likely to be stakeholders in a program - participants, other researchers, program staff, other community members, and so on.
Then we put all data in single framework & apply various statistical tools to find out the dynamic on the market.
During the analysis stage, feedback from the stakeholder groups would be compared to determine areas of agreement as well as areas of divergence