

Key Insights
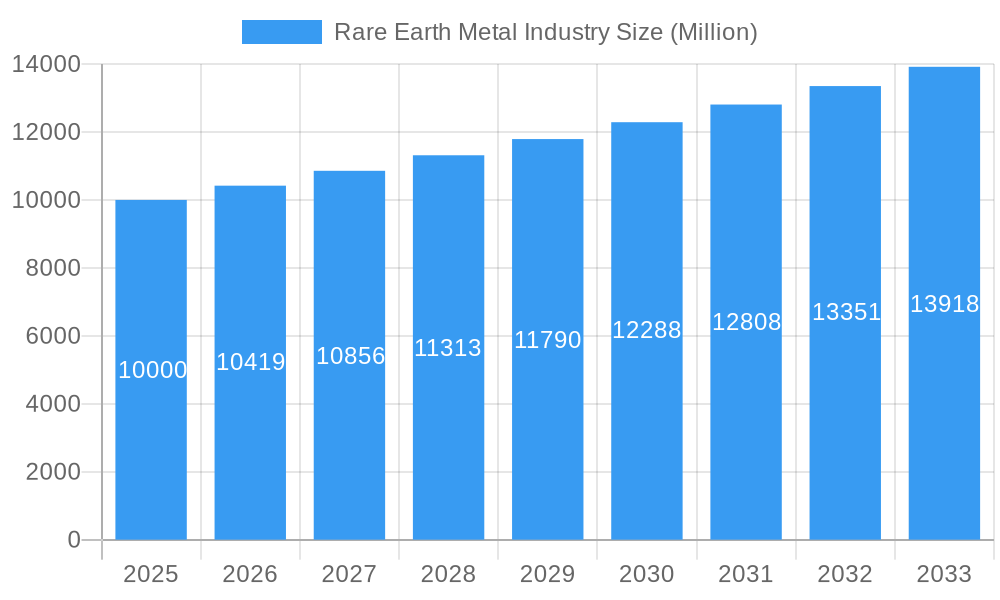
The rare earth metal industry, valued at approximately $XX million in 2025, is projected to experience robust growth, exhibiting a compound annual growth rate (CAGR) of 4.19% from 2025 to 2033. This expansion is driven by several key factors. The burgeoning demand for electric vehicles (EVs) significantly boosts the need for neodymium and dysprosium in high-performance magnets. Furthermore, the increasing adoption of renewable energy technologies, such as wind turbines and solar panels, further fuels the demand for rare earth elements in their respective components. Advancements in consumer electronics, particularly in smartphones and other portable devices, also contribute to the market's growth, as these products rely heavily on rare earth elements for their functionality. However, the industry faces challenges, primarily related to geopolitical risks associated with concentrated production in specific regions and concerns about supply chain stability. Environmental regulations and the complex extraction processes also pose constraints. The market is segmented by element (cerium, neodymium, dysprosium, terbium, yttrium, scandium, and others), alloy (lanthanum, and others), and application (catalysts, ceramics, phosphors, glass polishing, metallurgy, magnets, and others). Major players in the market include China Nonferrous Metal Industry's Foreign Engineering and Construction Co Ltd, Rare Element Resources Ltd, Rio Tinto, and several others, reflecting a competitive but geographically concentrated landscape.
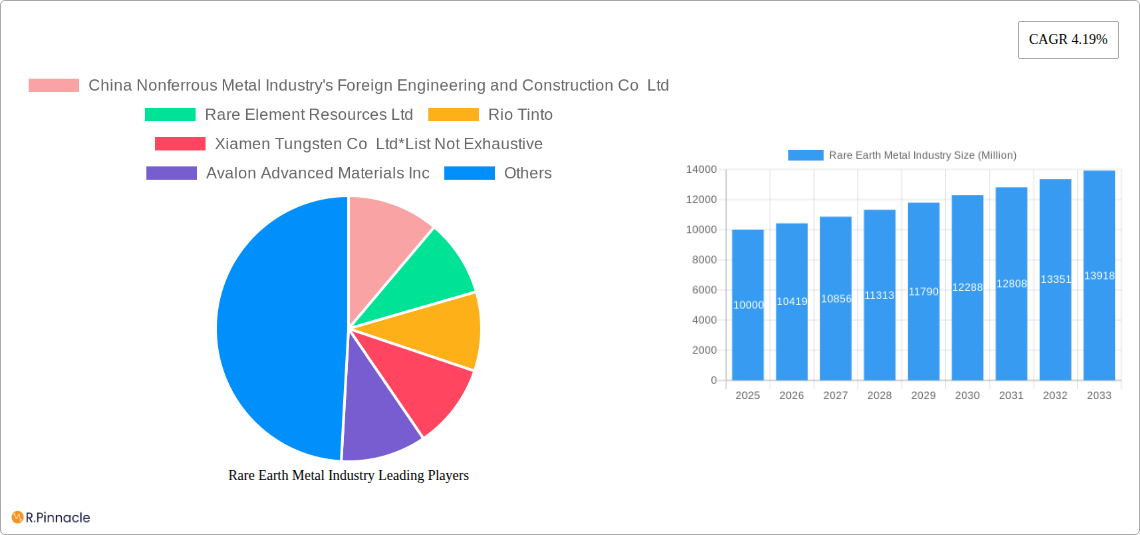
Rare Earth Metal Industry Market Size (In Billion)
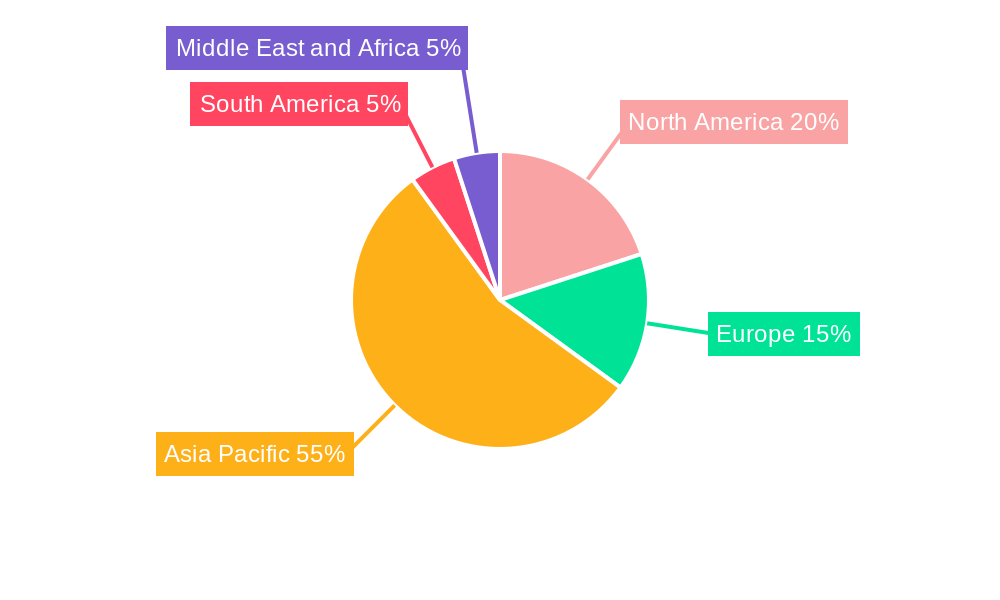
Growth within specific segments varies. The magnet segment, primarily driven by EV and renewable energy applications, is expected to witness the highest growth rate, surpassing other application sectors. Within the element segment, neodymium and dysprosium, critical for high-strength magnets, are projected to experience significant demand increases. Regionally, Asia Pacific, particularly China, dominates the market due to its extensive rare earth reserves and established processing infrastructure. However, North America and Europe are expected to witness considerable growth fueled by government initiatives promoting the domestic production of rare earth metals to mitigate supply chain vulnerabilities. The forecast period of 2025-2033 presents promising opportunities for market expansion, but continued investment in sustainable extraction methods, responsible sourcing, and technological advancements are vital for overcoming the challenges inherent in this crucial industry.
Rare Earth Metal Industry Company Market Share
Rare Earth Metal Industry Report: 2019-2033
This comprehensive report provides an in-depth analysis of the Rare Earth Metal industry, encompassing market structure, dynamics, regional dominance, product innovation, and future outlook. The study period covers 2019-2033, with a base year of 2025 and a forecast period of 2025-2033. The report leverages data from the historical period (2019-2024) to provide accurate and actionable insights for industry professionals. Key players such as China Nonferrous Metal Industry's Foreign Engineering and Construction Co Ltd, Rare Element Resources Ltd, Rio Tinto, and Lynas Rare Earths Ltd are analyzed, offering a granular understanding of the competitive landscape. The report also segments the market across various elements (Cerium, Neodymium, Dysprosium, Terbium, Yttrium, Scandium, and others), alloys (Lanthanum), and applications (catalysts, ceramics, magnets, etc.), providing a complete picture of this crucial industry. The total market size is projected to reach xx Million by 2033.
Rare Earth Metal Industry Market Structure & Innovation Trends
This section analyzes the competitive landscape, evaluating market concentration, innovation drivers, and regulatory influences. The report examines mergers and acquisitions (M&A) activities within the industry, assessing their impact on market share and consolidation.
Market Concentration: The market exhibits a moderately concentrated structure, with a few dominant players holding significant market share. China's dominance in rare earth mining and processing is a key factor shaping the global landscape. The report quantifies market share for major players, providing a detailed competitive analysis. For example, China's share is estimated at xx%.
Innovation Drivers: The demand for high-performance magnets in electric vehicles (EVs) and wind turbines is a major driver of innovation. Advancements in material science, refining techniques, and recycling technologies are also contributing to industry transformation.
Regulatory Frameworks: Government regulations regarding resource extraction, environmental protection, and trade policies significantly influence the industry. The report analyzes the impact of these regulations on market growth and investment decisions.
Product Substitutes: While limited, some materials are being explored as potential substitutes for specific rare earth elements in certain applications. The report assesses the potential threat of these substitutes and their market penetration.
M&A Activities: Recent M&A activity has involved significant investments, with deals totaling an estimated xx Million in the past five years. This section analyzes the motivations behind these deals and their effects on the industry structure. Key examples include the acquisition of xx by xx for xx Million.
End-User Demographics: The primary end-users are manufacturers of electronics, automotive components, and renewable energy equipment. Growth in these sectors fuels demand for rare earth metals.
Rare Earth Metal Industry Market Dynamics & Trends
This section delves into the factors shaping market growth, technological disruptions, and competitive dynamics. The report projects a Compound Annual Growth Rate (CAGR) of xx% from 2025 to 2033, driven by several key factors.
The increasing demand for electric vehicles and renewable energy infrastructure is a primary growth driver. Advancements in energy-efficient technologies further enhance this demand. Technological disruptions, such as the development of improved extraction techniques and the rise of recycling processes, are reshaping the industry. Shifting consumer preferences toward eco-friendly products also influence market dynamics. Competitive pressures among major players drive innovation and efficiency improvements, leading to dynamic market developments. Market penetration of rare earth metals in emerging applications, such as medical devices and aerospace components, is expected to increase significantly, boosting overall market growth. The report provides a detailed examination of these factors, using quantitative data to support its analysis.
Dominant Regions & Segments in Rare Earth Metal Industry
This section identifies the leading regions and segments within the rare earth metal industry. China maintains a significant dominant position in production and processing, holding a major share of the global market. However, other regions like Australia are making significant investments to diversify the supply chain.
Leading Regions:
- China: China's dominance stems from its extensive reserves, established infrastructure, and government support. Economic policies promoting domestic industries further strengthen its position.
- Australia: Australia is investing heavily in refining capabilities and aims to become a major player in the downstream processing of rare earth materials.
- Other Regions: Other regions, including the US and countries in Europe, are also working to develop their rare earth industries to reduce reliance on China.
Leading Segments:
- Elements: Neodymium and dysprosium are particularly crucial for high-performance magnets, driving high demand.
- Applications: The magnet segment dominates the market, fueled by the growth of EVs and renewable energy. Cerium's use in catalysts also contributes significantly. Further analysis on market share by segment is included in the full report.
Key Drivers:
- Government support and investments: Governments are actively supporting the development of their domestic rare earth industries through various incentives and initiatives.
- Technological advancements: Innovations in extraction, processing, and recycling technologies are improving efficiency and sustainability.
- Infrastructure development: Investments in infrastructure, such as mining and refining facilities, are crucial for supporting market growth.
Rare Earth Metal Industry Product Innovations
Recent innovations in rare earth metal processing have focused on improving extraction efficiency, reducing environmental impact, and developing new alloys with enhanced magnetic properties. These advancements drive the development of more powerful and energy-efficient magnets for use in various applications. The market is seeing a push towards sustainable sourcing and recycling of rare earth metals, addressing environmental concerns and supply chain vulnerabilities. The development of new applications in areas like medical technology and advanced manufacturing contributes to market expansion.
Report Scope & Segmentation Analysis
This report segments the rare earth metal market by element (Cerium, Neodymium, Dysprosium, Terbium, Yttrium, Scandium, and Others), alloy (Lanthanum), and application (Catalysts, Ceramics, Phosphors, Glass and Polishing, Metallurgy, Magnets, and Others). Each segment is analyzed based on historical data, current market size, and projected growth. Competitive dynamics within each segment are also explored.
Key Drivers of Rare Earth Metal Industry Growth
The growth of the rare earth metal industry is driven by several key factors. The expanding renewable energy sector, particularly wind turbines and solar panels, demands substantial quantities of rare earth metals for high-performance magnets. The rapid growth of the electric vehicle industry further fuels this demand. Technological advancements in material science and refining processes lead to increased efficiency and lower production costs. Government policies supporting the development of clean energy technologies indirectly contribute to market growth. Finally, emerging applications in areas such as medical devices and aerospace components create new market opportunities.
Challenges in the Rare Earth Metal Industry Sector
The rare earth metal industry faces numerous challenges. Supply chain vulnerabilities, largely due to the geographical concentration of mining and processing, pose a significant risk. Price volatility, influenced by fluctuating demand and geopolitical events, is a major concern. Environmental regulations and concerns regarding mining practices require companies to invest in sustainable solutions. Intense competition among major players necessitates continuous innovation and efficiency improvements. The report quantifies the impact of these challenges on market growth and profitability. For example, supply chain disruptions in xx resulted in a xx% increase in prices.
Emerging Opportunities in Rare Earth Metal Industry
Several emerging opportunities exist in the rare earth metal industry. The development of new applications in areas such as advanced medical devices and aerospace components is expected to drive significant growth. The increasing focus on sustainable sourcing and recycling of rare earth metals presents opportunities for companies adopting environmentally friendly practices. Advances in extraction and processing technologies lead to cost reductions and improved resource utilization. Government investments in research and development further encourage innovation and market expansion.
Leading Players in the Rare Earth Metal Industry Market
- China Nonferrous Metal Industry's Foreign Engineering and Construction Co Ltd
- Rare Element Resources Ltd
- Rio Tinto
- Xiamen Tungsten Co Ltd
- Avalon Advanced Materials Inc
- Lynas Rare Earths Ltd
- Iluka Resources Limited
- Ucore Rare Metals Inc
- Peak Resources
- Shin-Etsu Chemical Co Ltd
- Minmetals Land Limited
- NORTHERN MINERALS
- Eutectix
- ARAFURA RESOURCES
- MEDALLION RESOURCES LTD
- Aluminum Corporation of China Ltd
Key Developments in Rare Earth Metal Industry
August 2022: Lynas Rare Earths Ltd announced a plan to expand its Mt Weld mine in Western Australia, boosting neodymium and praseodymium production. Full operation is planned for 2024. This expansion signifies a significant investment in increasing the supply of these critical elements.
April 2022: Iluka Resources Ltd announced a USD 1.2 Billion investment in its Eneabba Phase 3 rare earth refinery, strengthening Australia's position in downstream processing. This investment aims to create a strategic hub for Australian rare earth resources, reducing reliance on foreign processing capabilities.
Future Outlook for Rare Earth Metal Industry Market
The future outlook for the rare earth metal industry remains positive, driven by sustained growth in the renewable energy sector and the electric vehicle market. Continued technological advancements and increased investment in sustainable sourcing practices will shape the industry's trajectory. New applications and market expansion into high-growth sectors are expected to drive market expansion in the coming years. The strategic shift towards regional diversification of supply chains will also contribute to long-term growth.
Rare Earth Metal Industry Segmentation
-
1. Element
-
1.1. Cerium
- 1.1.1. Oxide
- 1.1.2. Sulfide
- 1.1.3. Other Elements
-
1.2. Neodymium
- 1.2.1. Alloy
- 1.3. Lanthanum
- 1.4. Dysprosium
- 1.5. Terbium
- 1.6. Yttrium
- 1.7. Scandium
-
1.1. Cerium
-
2. Application
- 2.1. Catalysts
- 2.2. Ceramics
- 2.3. Phosphors
- 2.4. Glass and Polishing
- 2.5. Metallurgy
- 2.6. Magnets
- 2.7. Other Applications
Rare Earth Metal Industry Segmentation By Geography
-
1. Asia Pacific
- 1.1. China
- 1.2. India
- 1.3. Japan
- 1.4. South Korea
- 1.5. Rest of Asia Pacific
-
2. North America
- 2.1. United States
- 2.2. Canada
- 2.3. Mexico
-
3. Europe
- 3.1. Germany
- 3.2. United Kingdom
- 3.3. France
- 3.4. Italy
- 3.5. Rest of Europe
-
4. South America
- 4.1. Brazil
- 4.2. Argentina
- 4.3. Rest of South America
-
5. Middle East and Africa
- 5.1. Saudi Arabia
- 5.2. South Africa
- 5.3. Rest of Middle East and Africa
Rare Earth Metal Industry Regional Market Share
Geographic Coverage of Rare Earth Metal Industry
Rare Earth Metal Industry REPORT HIGHLIGHTS
| Aspects | Details |
|---|---|
| Study Period | 2020-2034 |
| Base Year | 2025 |
| Estimated Year | 2026 |
| Forecast Period | 2026-2034 |
| Historical Period | 2020-2025 |
| Growth Rate | CAGR of 6.6% from 2020-2034 |
| Segmentation |
|
Table of Contents
- 1. Introduction
- 1.1. Research Scope
- 1.2. Market Segmentation
- 1.3. Research Objective
- 1.4. Definitions and Assumptions
- 2. Executive Summary
- 2.1. Market Snapshot
- 3. Market Dynamics
- 3.1. Market Drivers
- 3.2. Market Restrains
- 3.3. Market Trends
- 3.4. Market Opportunities
- 4. Market Factor Analysis
- 4.1. Porters Five Forces
- 4.1.1. Bargaining Power of Suppliers
- 4.1.2. Bargaining Power of Buyers
- 4.1.3. Threat of New Entrants
- 4.1.4. Threat of Substitutes
- 4.1.5. Competitive Rivalry
- 4.2. PESTEL analysis
- 4.3. BCG Analysis
- 4.3.1. Stars (High Growth, High Market Share)
- 4.3.2. Cash Cows (Low Growth, High Market Share)
- 4.3.3. Question Mark (High Growth, Low Market Share)
- 4.3.4. Dogs (Low Growth, Low Market Share)
- 4.4. Ansoff Matrix Analysis
- 4.5. Supply Chain Analysis
- 4.6. Regulatory Landscape
- 4.7. Current Market Potential and Opportunity Assessment (TAM–SAM–SOM Framework)
- 4.8. PRI Analyst Note
- 4.1. Porters Five Forces
- 5. Market Analysis, Insights and Forecast 2021-2033
- 5.1. Market Analysis, Insights and Forecast - by Element
- 5.1.1. Cerium
- 5.1.1.1. Oxide
- 5.1.1.2. Sulfide
- 5.1.1.3. Other Elements
- 5.1.2. Neodymium
- 5.1.2.1. Alloy
- 5.1.3. Lanthanum
- 5.1.4. Dysprosium
- 5.1.5. Terbium
- 5.1.6. Yttrium
- 5.1.7. Scandium
- 5.1.1. Cerium
- 5.2. Market Analysis, Insights and Forecast - by Application
- 5.2.1. Catalysts
- 5.2.2. Ceramics
- 5.2.3. Phosphors
- 5.2.4. Glass and Polishing
- 5.2.5. Metallurgy
- 5.2.6. Magnets
- 5.2.7. Other Applications
- 5.3. Market Analysis, Insights and Forecast - by Region
- 5.3.1. Asia Pacific
- 5.3.2. North America
- 5.3.3. Europe
- 5.3.4. South America
- 5.3.5. Middle East and Africa
- 5.1. Market Analysis, Insights and Forecast - by Element
- 6. Global Rare Earth Metal Industry Analysis, Insights and Forecast, 2021-2033
- 6.1. Market Analysis, Insights and Forecast - by Element
- 6.1.1. Cerium
- 6.1.1.1. Oxide
- 6.1.1.2. Sulfide
- 6.1.1.3. Other Elements
- 6.1.2. Neodymium
- 6.1.2.1. Alloy
- 6.1.3. Lanthanum
- 6.1.4. Dysprosium
- 6.1.5. Terbium
- 6.1.6. Yttrium
- 6.1.7. Scandium
- 6.1.1. Cerium
- 6.2. Market Analysis, Insights and Forecast - by Application
- 6.2.1. Catalysts
- 6.2.2. Ceramics
- 6.2.3. Phosphors
- 6.2.4. Glass and Polishing
- 6.2.5. Metallurgy
- 6.2.6. Magnets
- 6.2.7. Other Applications
- 6.1. Market Analysis, Insights and Forecast - by Element
- 7. Asia Pacific Rare Earth Metal Industry Analysis, Insights and Forecast, 2020-2032
- 7.1. Market Analysis, Insights and Forecast - by Element
- 7.1.1. Cerium
- 7.1.1.1. Oxide
- 7.1.1.2. Sulfide
- 7.1.1.3. Other Elements
- 7.1.2. Neodymium
- 7.1.2.1. Alloy
- 7.1.3. Lanthanum
- 7.1.4. Dysprosium
- 7.1.5. Terbium
- 7.1.6. Yttrium
- 7.1.7. Scandium
- 7.1.1. Cerium
- 7.2. Market Analysis, Insights and Forecast - by Application
- 7.2.1. Catalysts
- 7.2.2. Ceramics
- 7.2.3. Phosphors
- 7.2.4. Glass and Polishing
- 7.2.5. Metallurgy
- 7.2.6. Magnets
- 7.2.7. Other Applications
- 7.1. Market Analysis, Insights and Forecast - by Element
- 8. North America Rare Earth Metal Industry Analysis, Insights and Forecast, 2020-2032
- 8.1. Market Analysis, Insights and Forecast - by Element
- 8.1.1. Cerium
- 8.1.1.1. Oxide
- 8.1.1.2. Sulfide
- 8.1.1.3. Other Elements
- 8.1.2. Neodymium
- 8.1.2.1. Alloy
- 8.1.3. Lanthanum
- 8.1.4. Dysprosium
- 8.1.5. Terbium
- 8.1.6. Yttrium
- 8.1.7. Scandium
- 8.1.1. Cerium
- 8.2. Market Analysis, Insights and Forecast - by Application
- 8.2.1. Catalysts
- 8.2.2. Ceramics
- 8.2.3. Phosphors
- 8.2.4. Glass and Polishing
- 8.2.5. Metallurgy
- 8.2.6. Magnets
- 8.2.7. Other Applications
- 8.1. Market Analysis, Insights and Forecast - by Element
- 9. Europe Rare Earth Metal Industry Analysis, Insights and Forecast, 2020-2032
- 9.1. Market Analysis, Insights and Forecast - by Element
- 9.1.1. Cerium
- 9.1.1.1. Oxide
- 9.1.1.2. Sulfide
- 9.1.1.3. Other Elements
- 9.1.2. Neodymium
- 9.1.2.1. Alloy
- 9.1.3. Lanthanum
- 9.1.4. Dysprosium
- 9.1.5. Terbium
- 9.1.6. Yttrium
- 9.1.7. Scandium
- 9.1.1. Cerium
- 9.2. Market Analysis, Insights and Forecast - by Application
- 9.2.1. Catalysts
- 9.2.2. Ceramics
- 9.2.3. Phosphors
- 9.2.4. Glass and Polishing
- 9.2.5. Metallurgy
- 9.2.6. Magnets
- 9.2.7. Other Applications
- 9.1. Market Analysis, Insights and Forecast - by Element
- 10. South America Rare Earth Metal Industry Analysis, Insights and Forecast, 2020-2032
- 10.1. Market Analysis, Insights and Forecast - by Element
- 10.1.1. Cerium
- 10.1.1.1. Oxide
- 10.1.1.2. Sulfide
- 10.1.1.3. Other Elements
- 10.1.2. Neodymium
- 10.1.2.1. Alloy
- 10.1.3. Lanthanum
- 10.1.4. Dysprosium
- 10.1.5. Terbium
- 10.1.6. Yttrium
- 10.1.7. Scandium
- 10.1.1. Cerium
- 10.2. Market Analysis, Insights and Forecast - by Application
- 10.2.1. Catalysts
- 10.2.2. Ceramics
- 10.2.3. Phosphors
- 10.2.4. Glass and Polishing
- 10.2.5. Metallurgy
- 10.2.6. Magnets
- 10.2.7. Other Applications
- 10.1. Market Analysis, Insights and Forecast - by Element
- 11. Middle East and Africa Rare Earth Metal Industry Analysis, Insights and Forecast, 2020-2032
- 11.1. Market Analysis, Insights and Forecast - by Element
- 11.1.1. Cerium
- 11.1.1.1. Oxide
- 11.1.1.2. Sulfide
- 11.1.1.3. Other Elements
- 11.1.2. Neodymium
- 11.1.2.1. Alloy
- 11.1.3. Lanthanum
- 11.1.4. Dysprosium
- 11.1.5. Terbium
- 11.1.6. Yttrium
- 11.1.7. Scandium
- 11.1.1. Cerium
- 11.2. Market Analysis, Insights and Forecast - by Application
- 11.2.1. Catalysts
- 11.2.2. Ceramics
- 11.2.3. Phosphors
- 11.2.4. Glass and Polishing
- 11.2.5. Metallurgy
- 11.2.6. Magnets
- 11.2.7. Other Applications
- 11.1. Market Analysis, Insights and Forecast - by Element
- 12. Competitive Analysis
- 12.1. Company Profiles
- 12.1.1 China Nonferrous Metal Industry's Foreign Engineering and Construction Co Ltd
- 12.1.1.1. Company Overview
- 12.1.1.2. Products
- 12.1.1.3. Company Financials
- 12.1.1.4. SWOT Analysis
- 12.1.2 Rare Element Resources Ltd
- 12.1.2.1. Company Overview
- 12.1.2.2. Products
- 12.1.2.3. Company Financials
- 12.1.2.4. SWOT Analysis
- 12.1.3 Rio Tinto
- 12.1.3.1. Company Overview
- 12.1.3.2. Products
- 12.1.3.3. Company Financials
- 12.1.3.4. SWOT Analysis
- 12.1.4 Xiamen Tungsten Co Ltd*List Not Exhaustive
- 12.1.4.1. Company Overview
- 12.1.4.2. Products
- 12.1.4.3. Company Financials
- 12.1.4.4. SWOT Analysis
- 12.1.5 Avalon Advanced Materials Inc
- 12.1.5.1. Company Overview
- 12.1.5.2. Products
- 12.1.5.3. Company Financials
- 12.1.5.4. SWOT Analysis
- 12.1.6 Lynas Rare Earths Ltd
- 12.1.6.1. Company Overview
- 12.1.6.2. Products
- 12.1.6.3. Company Financials
- 12.1.6.4. SWOT Analysis
- 12.1.7 Iluka Resources Limited
- 12.1.7.1. Company Overview
- 12.1.7.2. Products
- 12.1.7.3. Company Financials
- 12.1.7.4. SWOT Analysis
- 12.1.8 Ucore Rare Metals Inc
- 12.1.8.1. Company Overview
- 12.1.8.2. Products
- 12.1.8.3. Company Financials
- 12.1.8.4. SWOT Analysis
- 12.1.9 Peak Resources
- 12.1.9.1. Company Overview
- 12.1.9.2. Products
- 12.1.9.3. Company Financials
- 12.1.9.4. SWOT Analysis
- 12.1.10 Shin-Etsu Chemical Co Ltd
- 12.1.10.1. Company Overview
- 12.1.10.2. Products
- 12.1.10.3. Company Financials
- 12.1.10.4. SWOT Analysis
- 12.1.11 Minmetals Land Limited
- 12.1.11.1. Company Overview
- 12.1.11.2. Products
- 12.1.11.3. Company Financials
- 12.1.11.4. SWOT Analysis
- 12.1.12 NORTHERN MINERALS
- 12.1.12.1. Company Overview
- 12.1.12.2. Products
- 12.1.12.3. Company Financials
- 12.1.12.4. SWOT Analysis
- 12.1.13 Eutectix
- 12.1.13.1. Company Overview
- 12.1.13.2. Products
- 12.1.13.3. Company Financials
- 12.1.13.4. SWOT Analysis
- 12.1.14 ARAFURA RESOURCES
- 12.1.14.1. Company Overview
- 12.1.14.2. Products
- 12.1.14.3. Company Financials
- 12.1.14.4. SWOT Analysis
- 12.1.15 MEDALLION RESOURCES LTD
- 12.1.15.1. Company Overview
- 12.1.15.2. Products
- 12.1.15.3. Company Financials
- 12.1.15.4. SWOT Analysis
- 12.1.16 Aluminum Corporation of China Ltd
- 12.1.16.1. Company Overview
- 12.1.16.2. Products
- 12.1.16.3. Company Financials
- 12.1.16.4. SWOT Analysis
- 12.1.1 China Nonferrous Metal Industry's Foreign Engineering and Construction Co Ltd
- 12.2. Market Entropy
- 12.2.1 Company's Key Areas Served
- 12.2.2 Recent Developments
- 12.3. Company Market Share Analysis 2025
- 12.3.1 Top 5 Companies Market Share Analysis
- 12.3.2 Top 3 Companies Market Share Analysis
- 12.4. List of Potential Customers
- 13. Research Methodology
List of Figures
- Figure 1: Global Rare Earth Metal Industry Revenue Breakdown (billion, %) by Region 2025 & 2033
- Figure 2: Global Rare Earth Metal Industry Volume Breakdown (kilotons, %) by Region 2025 & 2033
- Figure 3: Asia Pacific Rare Earth Metal Industry Revenue (billion), by Element 2025 & 2033
- Figure 4: Asia Pacific Rare Earth Metal Industry Volume (kilotons), by Element 2025 & 2033
- Figure 5: Asia Pacific Rare Earth Metal Industry Revenue Share (%), by Element 2025 & 2033
- Figure 6: Asia Pacific Rare Earth Metal Industry Volume Share (%), by Element 2025 & 2033
- Figure 7: Asia Pacific Rare Earth Metal Industry Revenue (billion), by Application 2025 & 2033
- Figure 8: Asia Pacific Rare Earth Metal Industry Volume (kilotons), by Application 2025 & 2033
- Figure 9: Asia Pacific Rare Earth Metal Industry Revenue Share (%), by Application 2025 & 2033
- Figure 10: Asia Pacific Rare Earth Metal Industry Volume Share (%), by Application 2025 & 2033
- Figure 11: Asia Pacific Rare Earth Metal Industry Revenue (billion), by Country 2025 & 2033
- Figure 12: Asia Pacific Rare Earth Metal Industry Volume (kilotons), by Country 2025 & 2033
- Figure 13: Asia Pacific Rare Earth Metal Industry Revenue Share (%), by Country 2025 & 2033
- Figure 14: Asia Pacific Rare Earth Metal Industry Volume Share (%), by Country 2025 & 2033
- Figure 15: North America Rare Earth Metal Industry Revenue (billion), by Element 2025 & 2033
- Figure 16: North America Rare Earth Metal Industry Volume (kilotons), by Element 2025 & 2033
- Figure 17: North America Rare Earth Metal Industry Revenue Share (%), by Element 2025 & 2033
- Figure 18: North America Rare Earth Metal Industry Volume Share (%), by Element 2025 & 2033
- Figure 19: North America Rare Earth Metal Industry Revenue (billion), by Application 2025 & 2033
- Figure 20: North America Rare Earth Metal Industry Volume (kilotons), by Application 2025 & 2033
- Figure 21: North America Rare Earth Metal Industry Revenue Share (%), by Application 2025 & 2033
- Figure 22: North America Rare Earth Metal Industry Volume Share (%), by Application 2025 & 2033
- Figure 23: North America Rare Earth Metal Industry Revenue (billion), by Country 2025 & 2033
- Figure 24: North America Rare Earth Metal Industry Volume (kilotons), by Country 2025 & 2033
- Figure 25: North America Rare Earth Metal Industry Revenue Share (%), by Country 2025 & 2033
- Figure 26: North America Rare Earth Metal Industry Volume Share (%), by Country 2025 & 2033
- Figure 27: Europe Rare Earth Metal Industry Revenue (billion), by Element 2025 & 2033
- Figure 28: Europe Rare Earth Metal Industry Volume (kilotons), by Element 2025 & 2033
- Figure 29: Europe Rare Earth Metal Industry Revenue Share (%), by Element 2025 & 2033
- Figure 30: Europe Rare Earth Metal Industry Volume Share (%), by Element 2025 & 2033
- Figure 31: Europe Rare Earth Metal Industry Revenue (billion), by Application 2025 & 2033
- Figure 32: Europe Rare Earth Metal Industry Volume (kilotons), by Application 2025 & 2033
- Figure 33: Europe Rare Earth Metal Industry Revenue Share (%), by Application 2025 & 2033
- Figure 34: Europe Rare Earth Metal Industry Volume Share (%), by Application 2025 & 2033
- Figure 35: Europe Rare Earth Metal Industry Revenue (billion), by Country 2025 & 2033
- Figure 36: Europe Rare Earth Metal Industry Volume (kilotons), by Country 2025 & 2033
- Figure 37: Europe Rare Earth Metal Industry Revenue Share (%), by Country 2025 & 2033
- Figure 38: Europe Rare Earth Metal Industry Volume Share (%), by Country 2025 & 2033
- Figure 39: South America Rare Earth Metal Industry Revenue (billion), by Element 2025 & 2033
- Figure 40: South America Rare Earth Metal Industry Volume (kilotons), by Element 2025 & 2033
- Figure 41: South America Rare Earth Metal Industry Revenue Share (%), by Element 2025 & 2033
- Figure 42: South America Rare Earth Metal Industry Volume Share (%), by Element 2025 & 2033
- Figure 43: South America Rare Earth Metal Industry Revenue (billion), by Application 2025 & 2033
- Figure 44: South America Rare Earth Metal Industry Volume (kilotons), by Application 2025 & 2033
- Figure 45: South America Rare Earth Metal Industry Revenue Share (%), by Application 2025 & 2033
- Figure 46: South America Rare Earth Metal Industry Volume Share (%), by Application 2025 & 2033
- Figure 47: South America Rare Earth Metal Industry Revenue (billion), by Country 2025 & 2033
- Figure 48: South America Rare Earth Metal Industry Volume (kilotons), by Country 2025 & 2033
- Figure 49: South America Rare Earth Metal Industry Revenue Share (%), by Country 2025 & 2033
- Figure 50: South America Rare Earth Metal Industry Volume Share (%), by Country 2025 & 2033
- Figure 51: Middle East and Africa Rare Earth Metal Industry Revenue (billion), by Element 2025 & 2033
- Figure 52: Middle East and Africa Rare Earth Metal Industry Volume (kilotons), by Element 2025 & 2033
- Figure 53: Middle East and Africa Rare Earth Metal Industry Revenue Share (%), by Element 2025 & 2033
- Figure 54: Middle East and Africa Rare Earth Metal Industry Volume Share (%), by Element 2025 & 2033
- Figure 55: Middle East and Africa Rare Earth Metal Industry Revenue (billion), by Application 2025 & 2033
- Figure 56: Middle East and Africa Rare Earth Metal Industry Volume (kilotons), by Application 2025 & 2033
- Figure 57: Middle East and Africa Rare Earth Metal Industry Revenue Share (%), by Application 2025 & 2033
- Figure 58: Middle East and Africa Rare Earth Metal Industry Volume Share (%), by Application 2025 & 2033
- Figure 59: Middle East and Africa Rare Earth Metal Industry Revenue (billion), by Country 2025 & 2033
- Figure 60: Middle East and Africa Rare Earth Metal Industry Volume (kilotons), by Country 2025 & 2033
- Figure 61: Middle East and Africa Rare Earth Metal Industry Revenue Share (%), by Country 2025 & 2033
- Figure 62: Middle East and Africa Rare Earth Metal Industry Volume Share (%), by Country 2025 & 2033
List of Tables
- Table 1: Global Rare Earth Metal Industry Revenue billion Forecast, by Element 2020 & 2033
- Table 2: Global Rare Earth Metal Industry Volume kilotons Forecast, by Element 2020 & 2033
- Table 3: Global Rare Earth Metal Industry Revenue billion Forecast, by Application 2020 & 2033
- Table 4: Global Rare Earth Metal Industry Volume kilotons Forecast, by Application 2020 & 2033
- Table 5: Global Rare Earth Metal Industry Revenue billion Forecast, by Region 2020 & 2033
- Table 6: Global Rare Earth Metal Industry Volume kilotons Forecast, by Region 2020 & 2033
- Table 7: Global Rare Earth Metal Industry Revenue billion Forecast, by Element 2020 & 2033
- Table 8: Global Rare Earth Metal Industry Volume kilotons Forecast, by Element 2020 & 2033
- Table 9: Global Rare Earth Metal Industry Revenue billion Forecast, by Application 2020 & 2033
- Table 10: Global Rare Earth Metal Industry Volume kilotons Forecast, by Application 2020 & 2033
- Table 11: Global Rare Earth Metal Industry Revenue billion Forecast, by Country 2020 & 2033
- Table 12: Global Rare Earth Metal Industry Volume kilotons Forecast, by Country 2020 & 2033
- Table 13: China Rare Earth Metal Industry Revenue (billion) Forecast, by Application 2020 & 2033
- Table 14: China Rare Earth Metal Industry Volume (kilotons) Forecast, by Application 2020 & 2033
- Table 15: India Rare Earth Metal Industry Revenue (billion) Forecast, by Application 2020 & 2033
- Table 16: India Rare Earth Metal Industry Volume (kilotons) Forecast, by Application 2020 & 2033
- Table 17: Japan Rare Earth Metal Industry Revenue (billion) Forecast, by Application 2020 & 2033
- Table 18: Japan Rare Earth Metal Industry Volume (kilotons) Forecast, by Application 2020 & 2033
- Table 19: South Korea Rare Earth Metal Industry Revenue (billion) Forecast, by Application 2020 & 2033
- Table 20: South Korea Rare Earth Metal Industry Volume (kilotons) Forecast, by Application 2020 & 2033
- Table 21: Rest of Asia Pacific Rare Earth Metal Industry Revenue (billion) Forecast, by Application 2020 & 2033
- Table 22: Rest of Asia Pacific Rare Earth Metal Industry Volume (kilotons) Forecast, by Application 2020 & 2033
- Table 23: Global Rare Earth Metal Industry Revenue billion Forecast, by Element 2020 & 2033
- Table 24: Global Rare Earth Metal Industry Volume kilotons Forecast, by Element 2020 & 2033
- Table 25: Global Rare Earth Metal Industry Revenue billion Forecast, by Application 2020 & 2033
- Table 26: Global Rare Earth Metal Industry Volume kilotons Forecast, by Application 2020 & 2033
- Table 27: Global Rare Earth Metal Industry Revenue billion Forecast, by Country 2020 & 2033
- Table 28: Global Rare Earth Metal Industry Volume kilotons Forecast, by Country 2020 & 2033
- Table 29: United States Rare Earth Metal Industry Revenue (billion) Forecast, by Application 2020 & 2033
- Table 30: United States Rare Earth Metal Industry Volume (kilotons) Forecast, by Application 2020 & 2033
- Table 31: Canada Rare Earth Metal Industry Revenue (billion) Forecast, by Application 2020 & 2033
- Table 32: Canada Rare Earth Metal Industry Volume (kilotons) Forecast, by Application 2020 & 2033
- Table 33: Mexico Rare Earth Metal Industry Revenue (billion) Forecast, by Application 2020 & 2033
- Table 34: Mexico Rare Earth Metal Industry Volume (kilotons) Forecast, by Application 2020 & 2033
- Table 35: Global Rare Earth Metal Industry Revenue billion Forecast, by Element 2020 & 2033
- Table 36: Global Rare Earth Metal Industry Volume kilotons Forecast, by Element 2020 & 2033
- Table 37: Global Rare Earth Metal Industry Revenue billion Forecast, by Application 2020 & 2033
- Table 38: Global Rare Earth Metal Industry Volume kilotons Forecast, by Application 2020 & 2033
- Table 39: Global Rare Earth Metal Industry Revenue billion Forecast, by Country 2020 & 2033
- Table 40: Global Rare Earth Metal Industry Volume kilotons Forecast, by Country 2020 & 2033
- Table 41: Germany Rare Earth Metal Industry Revenue (billion) Forecast, by Application 2020 & 2033
- Table 42: Germany Rare Earth Metal Industry Volume (kilotons) Forecast, by Application 2020 & 2033
- Table 43: United Kingdom Rare Earth Metal Industry Revenue (billion) Forecast, by Application 2020 & 2033
- Table 44: United Kingdom Rare Earth Metal Industry Volume (kilotons) Forecast, by Application 2020 & 2033
- Table 45: France Rare Earth Metal Industry Revenue (billion) Forecast, by Application 2020 & 2033
- Table 46: France Rare Earth Metal Industry Volume (kilotons) Forecast, by Application 2020 & 2033
- Table 47: Italy Rare Earth Metal Industry Revenue (billion) Forecast, by Application 2020 & 2033
- Table 48: Italy Rare Earth Metal Industry Volume (kilotons) Forecast, by Application 2020 & 2033
- Table 49: Rest of Europe Rare Earth Metal Industry Revenue (billion) Forecast, by Application 2020 & 2033
- Table 50: Rest of Europe Rare Earth Metal Industry Volume (kilotons) Forecast, by Application 2020 & 2033
- Table 51: Global Rare Earth Metal Industry Revenue billion Forecast, by Element 2020 & 2033
- Table 52: Global Rare Earth Metal Industry Volume kilotons Forecast, by Element 2020 & 2033
- Table 53: Global Rare Earth Metal Industry Revenue billion Forecast, by Application 2020 & 2033
- Table 54: Global Rare Earth Metal Industry Volume kilotons Forecast, by Application 2020 & 2033
- Table 55: Global Rare Earth Metal Industry Revenue billion Forecast, by Country 2020 & 2033
- Table 56: Global Rare Earth Metal Industry Volume kilotons Forecast, by Country 2020 & 2033
- Table 57: Brazil Rare Earth Metal Industry Revenue (billion) Forecast, by Application 2020 & 2033
- Table 58: Brazil Rare Earth Metal Industry Volume (kilotons) Forecast, by Application 2020 & 2033
- Table 59: Argentina Rare Earth Metal Industry Revenue (billion) Forecast, by Application 2020 & 2033
- Table 60: Argentina Rare Earth Metal Industry Volume (kilotons) Forecast, by Application 2020 & 2033
- Table 61: Rest of South America Rare Earth Metal Industry Revenue (billion) Forecast, by Application 2020 & 2033
- Table 62: Rest of South America Rare Earth Metal Industry Volume (kilotons) Forecast, by Application 2020 & 2033
- Table 63: Global Rare Earth Metal Industry Revenue billion Forecast, by Element 2020 & 2033
- Table 64: Global Rare Earth Metal Industry Volume kilotons Forecast, by Element 2020 & 2033
- Table 65: Global Rare Earth Metal Industry Revenue billion Forecast, by Application 2020 & 2033
- Table 66: Global Rare Earth Metal Industry Volume kilotons Forecast, by Application 2020 & 2033
- Table 67: Global Rare Earth Metal Industry Revenue billion Forecast, by Country 2020 & 2033
- Table 68: Global Rare Earth Metal Industry Volume kilotons Forecast, by Country 2020 & 2033
- Table 69: Saudi Arabia Rare Earth Metal Industry Revenue (billion) Forecast, by Application 2020 & 2033
- Table 70: Saudi Arabia Rare Earth Metal Industry Volume (kilotons) Forecast, by Application 2020 & 2033
- Table 71: South Africa Rare Earth Metal Industry Revenue (billion) Forecast, by Application 2020 & 2033
- Table 72: South Africa Rare Earth Metal Industry Volume (kilotons) Forecast, by Application 2020 & 2033
- Table 73: Rest of Middle East and Africa Rare Earth Metal Industry Revenue (billion) Forecast, by Application 2020 & 2033
- Table 74: Rest of Middle East and Africa Rare Earth Metal Industry Volume (kilotons) Forecast, by Application 2020 & 2033
Frequently Asked Questions
1. What is the projected Compound Annual Growth Rate (CAGR) of the Rare Earth Metal Industry?
The projected CAGR is approximately 6.6%.
2. Which companies are prominent players in the Rare Earth Metal Industry?
Key companies in the market include China Nonferrous Metal Industry's Foreign Engineering and Construction Co Ltd, Rare Element Resources Ltd, Rio Tinto, Xiamen Tungsten Co Ltd*List Not Exhaustive, Avalon Advanced Materials Inc, Lynas Rare Earths Ltd, Iluka Resources Limited, Ucore Rare Metals Inc, Peak Resources, Shin-Etsu Chemical Co Ltd, Minmetals Land Limited, NORTHERN MINERALS, Eutectix, ARAFURA RESOURCES, MEDALLION RESOURCES LTD, Aluminum Corporation of China Ltd.
3. What are the main segments of the Rare Earth Metal Industry?
The market segments include Element, Application.
4. Can you provide details about the market size?
The market size is estimated to be USD 4.13 billion as of 2022.
5. What are some drivers contributing to market growth?
High Demand from Emerging Economies; Dependency of 'Green Technology' on Rare Earth Elements.
6. What are the notable trends driving market growth?
Increasing Demand for Magnets.
7. Are there any restraints impacting market growth?
Inconsistent Supply of Rare Earth Elements.
8. Can you provide examples of recent developments in the market?
August 2022: Australia's Lynas Rare Earths Ltd unveiled a plan to expand capacity at its Western Australia-based Mt Weld mine having deposits of neodymium (Nd) and praseodymium (Pr). The company anticipates expansion work to begin by early 2023, with full operation planned for 2024.
9. What pricing options are available for accessing the report?
Pricing options include single-user, multi-user, and enterprise licenses priced at USD 4750, USD 5250, and USD 8750 respectively.
10. Is the market size provided in terms of value or volume?
The market size is provided in terms of value, measured in billion and volume, measured in kilotons.
11. Are there any specific market keywords associated with the report?
Yes, the market keyword associated with the report is "Rare Earth Metal Industry," which aids in identifying and referencing the specific market segment covered.
12. How do I determine which pricing option suits my needs best?
The pricing options vary based on user requirements and access needs. Individual users may opt for single-user licenses, while businesses requiring broader access may choose multi-user or enterprise licenses for cost-effective access to the report.
13. Are there any additional resources or data provided in the Rare Earth Metal Industry report?
While the report offers comprehensive insights, it's advisable to review the specific contents or supplementary materials provided to ascertain if additional resources or data are available.
14. How can I stay updated on further developments or reports in the Rare Earth Metal Industry?
To stay informed about further developments, trends, and reports in the Rare Earth Metal Industry, consider subscribing to industry newsletters, following relevant companies and organizations, or regularly checking reputable industry news sources and publications.
Methodology
Step 1 - Identification of Relevant Samples Size from Population Database


Step 2 - Approaches for Defining Global Market Size (Value, Volume* & Price*)

Note*: In applicable scenarios
Step 3 - Data Sources
Primary Research
- Web Analytics
- Survey Reports
- Research Institute
- Latest Research Reports
- Opinion Leaders
Secondary Research
- Annual Reports
- White Paper
- Latest Press Release
- Industry Association
- Paid Database
- Investor Presentations

Step 4 - Data Triangulation
Involves using different sources of information in order to increase the validity of a study
These sources are likely to be stakeholders in a program - participants, other researchers, program staff, other community members, and so on.
Then we put all data in single framework & apply various statistical tools to find out the dynamic on the market.
During the analysis stage, feedback from the stakeholder groups would be compared to determine areas of agreement as well as areas of divergence