

Key Insights
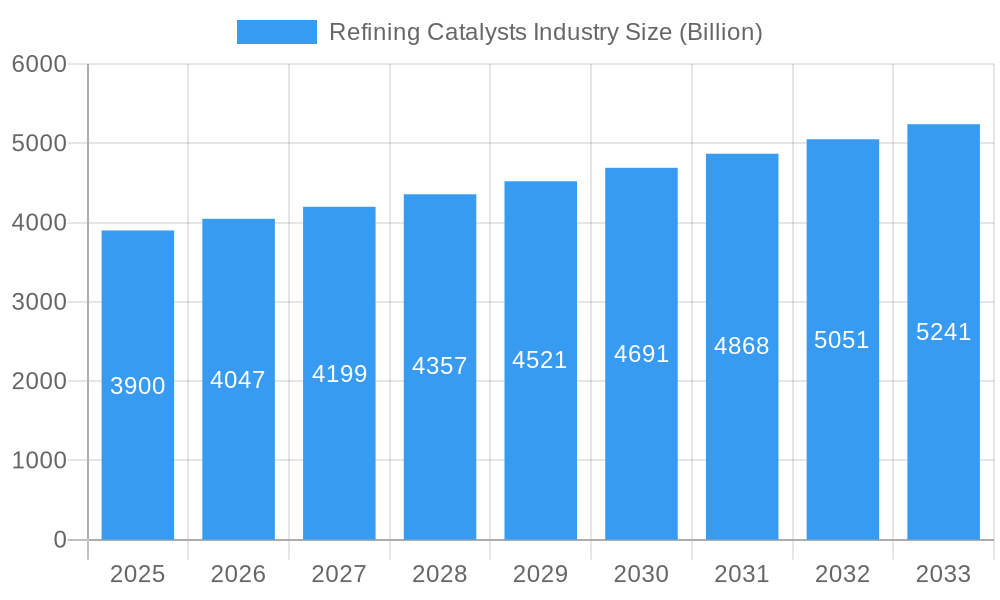
The refining catalysts market, valued at $3.9 billion in 2025, is projected to experience steady growth, driven by increasing demand for cleaner fuels and stricter environmental regulations globally. The Compound Annual Growth Rate (CAGR) of 3.69% from 2025 to 2033 indicates a consistent expansion, although this rate may be influenced by fluctuations in crude oil prices and global economic conditions. Key drivers include the rising adoption of hydrocracking and fluid catalytic cracking (FCC) processes to enhance fuel efficiency and reduce sulfur content. Growth in the Asia-Pacific region, particularly in China and India, fueled by expanding refining capacities and increasing fuel consumption, is expected to significantly contribute to overall market expansion. Technological advancements focusing on improving catalyst efficiency, lifespan, and selectivity are also contributing factors. The market is segmented by product type (CoMo, NiMo, Alumina-based Noble Metal, NiW, Zeolites, and Others) and process (Hydrotreating, FCC, RFCC, and Hydrocracking). Competition among major players like Axens, Topsoe, and ExxonMobil is intense, with companies focusing on research and development to maintain a competitive edge. While the market faces challenges such as raw material price volatility and stringent safety regulations, the long-term outlook remains positive due to the continuous need for efficient and environmentally compliant refining processes.
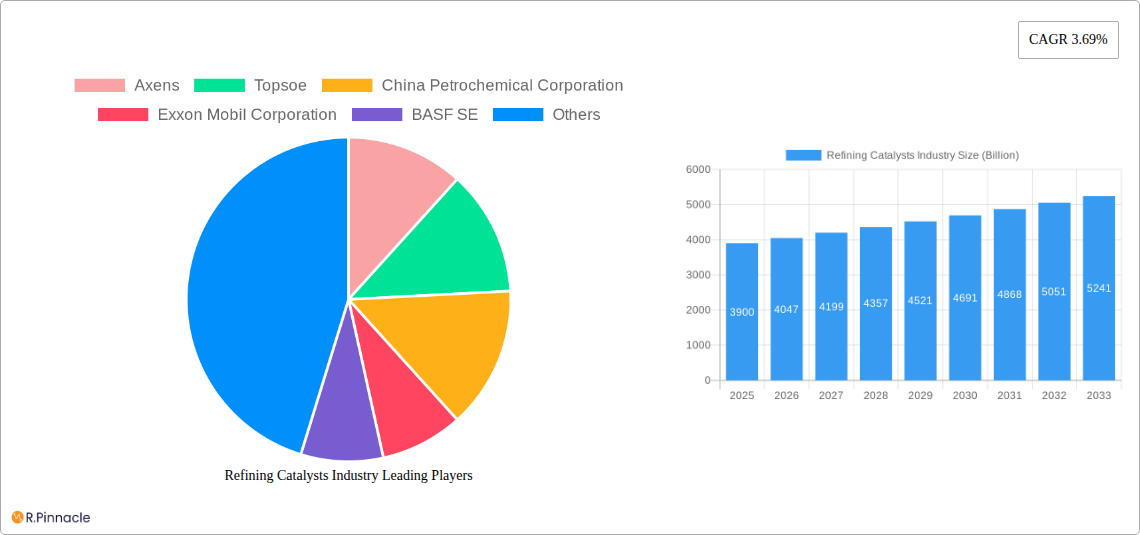
Refining Catalysts Industry Market Size (In Billion)
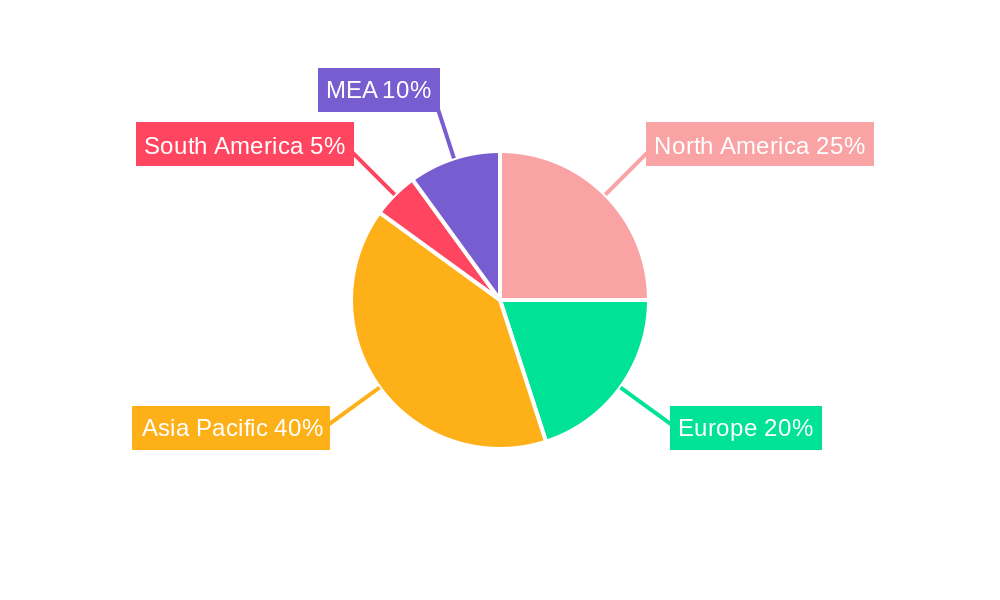
The market segmentation highlights the importance of specific catalyst types depending on the refining process. Hydrotreating catalysts, particularly CoMo and NiMo, dominate due to their widespread use in sulfur removal. However, the increasing demand for cleaner fuels and higher-value products is driving growth in the Alumina-based Noble Metal and NiW catalyst segments. The FCC and RFCC processes are significant consumers of zeolite-based catalysts, and advancements in these catalyst formulations are expected to drive further market expansion within these segments. Regional variations in growth rates reflect differing levels of refining capacity expansion and environmental regulations. North America and Europe, while possessing established refining infrastructure, are expected to witness moderate growth, while the Asia-Pacific region is poised for significant expansion due to its rapidly growing economies and energy demands. Strategic partnerships, mergers, and acquisitions among key players are anticipated, further shaping the competitive landscape of the refining catalysts market.
Refining Catalysts Industry Company Market Share
Refining Catalysts Industry: A Comprehensive Market Report (2019-2033)
This comprehensive report provides an in-depth analysis of the global refining catalysts market, offering valuable insights for industry professionals, investors, and stakeholders. Covering the period from 2019 to 2033, with a focus on 2025, this report unveils the market's structure, dynamics, key players, and future outlook. The market is projected to reach a value exceeding $XX Billion by 2033.
Refining Catalysts Industry Market Structure & Innovation Trends
The refining catalysts market is moderately concentrated, with key players like Axens, Topsoe, and BASF SE holding significant market share. However, the landscape is dynamic, characterized by ongoing innovation and strategic acquisitions. The market share of the top 5 players is estimated to be around xx%, with the remaining share distributed among numerous smaller companies and regional players. Market concentration is influenced by factors such as R&D investments, technological advancements, and regulatory compliance. Innovation is driven by the need for improved catalyst efficiency, reduced environmental impact, and the processing of increasingly complex feedstocks. M&A activities are fueled by the desire to expand product portfolios, access new technologies, and secure market share. Recent M&A deals, while not publicly disclosed in detail for all transactions, have involved an estimated total value of $XX Billion over the past five years. Strict environmental regulations are a key driver of innovation, pushing companies to develop more sustainable and efficient catalysts.
- Market Concentration: Moderately concentrated, with top 5 players holding xx% market share.
- Innovation Drivers: Improved efficiency, reduced environmental impact, processing complex feedstocks.
- Regulatory Framework: Stringent environmental regulations driving innovation.
- Product Substitutes: Limited viable substitutes, but ongoing research explores alternative technologies.
- M&A Activity: Estimated $XX Billion in M&A deal value over the past five years.
Refining Catalysts Industry Market Dynamics & Trends
The refining catalysts market is experiencing steady growth, driven by factors such as increasing demand for transportation fuels, rising petrochemical production, and stringent environmental regulations. The market exhibits a Compound Annual Growth Rate (CAGR) of xx% during the historical period (2019-2024) and is projected to maintain a CAGR of xx% during the forecast period (2025-2033). Technological advancements, such as the development of novel catalyst formulations and improved process designs, are further accelerating market growth. However, fluctuating crude oil prices and economic downturns can pose challenges to market expansion. Market penetration of advanced catalysts, particularly in developing economies, is also gradually increasing with projected penetration of xx% by 2033. The competitive dynamics are shaped by factors such as technological superiority, pricing strategies, and customer relationships.
Dominant Regions & Segments in Refining Catalysts Industry
The Asia-Pacific region, particularly China and India, dominates the refining catalysts market due to rapid industrialization and expanding refining capacity. North America and Europe also hold significant market share.
Dominant Segments:
- Product: Hydrotreating catalysts (CoMo and NiMo) currently hold the largest market share, driven by their widespread use in refineries. Alumina-based noble metal catalysts are also experiencing significant growth due to their high efficiency.
- Process: Hydrotreating remains the dominant process, followed by Fluid Catalytic Cracking (FCC) and Residue Fluid Catalytic Cracking (RFCC). Hydrocracking also contributes significantly.
- Residual Feed: FCC and RFCC are the leading residual feed segments, driven by their ability to process heavier feedstocks.
Key Drivers:
- Economic Policies: Government incentives and investments in refining infrastructure.
- Infrastructure Development: Expansion of refining capacity in developing economies.
- Stringent Environmental Regulations: Demand for cleaner fuels and reduced emissions.
Refining Catalysts Industry Product Innovations
Recent innovations focus on enhancing catalyst activity, selectivity, and stability while minimizing environmental impact. Developments include the use of advanced materials, improved catalyst design, and innovative manufacturing techniques. For instance, BASF's launch of Fourtitude exemplifies the trend towards maximizing valuable products from heavy feedstocks. These innovations aim to improve refinery efficiency, reduce operating costs, and meet stringent environmental regulations. The market fit for these new catalysts is strong, driven by increasing demand for higher-quality fuels and value-added products.
Report Scope & Segmentation Analysis
This report segments the refining catalysts market based on product type (CoMo, NiMo, Alumina-based Noble Metal, NiW, Zeolites, Other Products), process (Hydrotreating, FCC, RFCC, Hydrocracking), and residual feed (FCC, RFCC). Each segment's market size, growth projections, and competitive dynamics are analyzed in detail. For example, the Hydrotreating segment is projected to maintain a substantial market share due to its wide applicability. The FCC segment shows promising growth driven by the demand for gasoline and olefins. The competitive landscape within each segment is characterized by intense rivalry among major players and emerging companies.
Key Drivers of Refining Catalysts Industry Growth
The refining catalysts market growth is fueled by several key drivers: Firstly, the rising global demand for transportation fuels and petrochemicals is a major factor. Secondly, stringent environmental regulations are pushing refineries to adopt more efficient and environmentally friendly catalysts. Thirdly, technological advancements leading to the development of improved catalyst formulations are boosting market growth. Finally, the expansion of refining capacity, especially in developing countries, creates opportunities for catalyst manufacturers.
Challenges in the Refining Catalysts Industry Sector
The refining catalysts industry faces several challenges. Fluctuating crude oil prices and economic uncertainty can impact demand and profitability. Furthermore, stringent environmental regulations necessitate continuous innovation and investment in research and development, adding to operational costs. Intense competition among established players and emerging companies also poses a challenge. Supply chain disruptions due to geopolitical instability or natural disasters can further impact the availability and pricing of raw materials.
Emerging Opportunities in Refining Catalysts Industry
Emerging opportunities lie in the development of advanced catalysts for processing heavier and more complex feedstocks. Growing demand for cleaner fuels and the increasing adoption of renewable energy sources present significant growth prospects. The exploration of new catalyst formulations based on sustainable materials is another emerging area. Expansion into developing markets with growing refining capacities also offers significant potential for market growth.
Leading Players in the Refining Catalysts Industry Market
- Axens
- Topsoe
- China Petrochemical Corporation
- Exxon Mobil Corporation
- BASF SE
- Honeywell International
- Chevron Lummus Global (CLG)
- JGC C & C
- Royal Dutch Shell PLC
- Johnson Matthey
- KNT Group
- W R Grace & Co -Conn
- Albemarle Corporation
Key Developments in Refining Catalysts Industry
- March 2022: BASF launched Fourtitude, a new Fluid Catalytic Cracking (FCC) catalyst designed to maximize butylenes from resid feedstocks. This launch signifies a significant advancement in FCC catalyst technology, allowing refineries to improve the yield of valuable byproducts from heavier feedstocks.
Future Outlook for Refining Catalysts Industry Market
The future of the refining catalysts market looks promising, driven by continuous technological innovation, increasing demand for higher-quality fuels, and growing environmental concerns. The focus on developing sustainable and efficient catalysts will drive market growth. Strategic partnerships and collaborations among companies will further accelerate innovation and market expansion. The market is poised for significant growth, with considerable opportunities for both established players and new entrants.
Refining Catalysts Industry Segmentation
-
1. Product
- 1.1. CoMo
- 1.2. NiMo
- 1.3. Alumina-based Noble Metal
- 1.4. NiW
- 1.5. Zeolites
- 1.6. Other Products
-
2. Process
-
2.1. Hydrotreating
- 2.1.1. Gasoline
- 2.1.2. Kerosene
- 2.1.3. Diesel
- 2.1.4. Vacuum Gas Oil
- 2.1.5. Catalytic Cracking Gasoline
- 2.1.6. Residual Feed
- 2.2. Fluid Catalytic Cracking (FCC)
- 2.3. Residue Fluid Catalytic Cracking (RFCC)
- 2.4. Hydrocracking
-
2.1. Hydrotreating
Refining Catalysts Industry Segmentation By Geography
-
1. Asia Pacific
- 1.1. China
- 1.2. India
- 1.3. Japan
- 1.4. South Korea
- 1.5. ASEAN Countries
- 1.6. Rest of Asia Pacific
-
2. North America
- 2.1. United States
- 2.2. Canada
- 2.3. Mexico
-
3. Europe
- 3.1. Germany
- 3.2. United Kingdom
- 3.3. Italy
- 3.4. France
- 3.5. Spain
- 3.6. Russia
- 3.7. Rest of Europe
-
4. South America
- 4.1. Brazil
- 4.2. Argentina
- 4.3. Rest of South America
-
5. Middle East and Africa
- 5.1. Saudi Arabia
- 5.2. South Africa
- 5.3. Rest of Middle East and Africa
Refining Catalysts Industry Regional Market Share
Geographic Coverage of Refining Catalysts Industry
Refining Catalysts Industry REPORT HIGHLIGHTS
| Aspects | Details |
|---|---|
| Study Period | 2020-2034 |
| Base Year | 2025 |
| Estimated Year | 2026 |
| Forecast Period | 2026-2034 |
| Historical Period | 2020-2025 |
| Growth Rate | CAGR of 3.69% from 2020-2034 |
| Segmentation |
|
Table of Contents
- 1. Introduction
- 1.1. Research Scope
- 1.2. Market Segmentation
- 1.3. Research Objective
- 1.4. Definitions and Assumptions
- 2. Executive Summary
- 2.1. Market Snapshot
- 3. Market Dynamics
- 3.1. Market Drivers
- 3.2. Market Restrains
- 3.3. Market Trends
- 3.4. Market Opportunities
- 4. Market Factor Analysis
- 4.1. Porters Five Forces
- 4.1.1. Bargaining Power of Suppliers
- 4.1.2. Bargaining Power of Buyers
- 4.1.3. Threat of New Entrants
- 4.1.4. Threat of Substitutes
- 4.1.5. Competitive Rivalry
- 4.2. PESTEL analysis
- 4.3. BCG Analysis
- 4.3.1. Stars (High Growth, High Market Share)
- 4.3.2. Cash Cows (Low Growth, High Market Share)
- 4.3.3. Question Mark (High Growth, Low Market Share)
- 4.3.4. Dogs (Low Growth, Low Market Share)
- 4.4. Ansoff Matrix Analysis
- 4.5. Supply Chain Analysis
- 4.6. Regulatory Landscape
- 4.7. Current Market Potential and Opportunity Assessment (TAM–SAM–SOM Framework)
- 4.8. PRI Analyst Note
- 4.1. Porters Five Forces
- 5. Market Analysis, Insights and Forecast 2021-2033
- 5.1. Market Analysis, Insights and Forecast - by Product
- 5.1.1. CoMo
- 5.1.2. NiMo
- 5.1.3. Alumina-based Noble Metal
- 5.1.4. NiW
- 5.1.5. Zeolites
- 5.1.6. Other Products
- 5.2. Market Analysis, Insights and Forecast - by Process
- 5.2.1. Hydrotreating
- 5.2.1.1. Gasoline
- 5.2.1.2. Kerosene
- 5.2.1.3. Diesel
- 5.2.1.4. Vacuum Gas Oil
- 5.2.1.5. Catalytic Cracking Gasoline
- 5.2.1.6. Residual Feed
- 5.2.2. Fluid Catalytic Cracking (FCC)
- 5.2.3. Residue Fluid Catalytic Cracking (RFCC)
- 5.2.4. Hydrocracking
- 5.2.1. Hydrotreating
- 5.3. Market Analysis, Insights and Forecast - by Region
- 5.3.1. Asia Pacific
- 5.3.2. North America
- 5.3.3. Europe
- 5.3.4. South America
- 5.3.5. Middle East and Africa
- 5.1. Market Analysis, Insights and Forecast - by Product
- 6. Global Refining Catalysts Industry Analysis, Insights and Forecast, 2021-2033
- 6.1. Market Analysis, Insights and Forecast - by Product
- 6.1.1. CoMo
- 6.1.2. NiMo
- 6.1.3. Alumina-based Noble Metal
- 6.1.4. NiW
- 6.1.5. Zeolites
- 6.1.6. Other Products
- 6.2. Market Analysis, Insights and Forecast - by Process
- 6.2.1. Hydrotreating
- 6.2.1.1. Gasoline
- 6.2.1.2. Kerosene
- 6.2.1.3. Diesel
- 6.2.1.4. Vacuum Gas Oil
- 6.2.1.5. Catalytic Cracking Gasoline
- 6.2.1.6. Residual Feed
- 6.2.2. Fluid Catalytic Cracking (FCC)
- 6.2.3. Residue Fluid Catalytic Cracking (RFCC)
- 6.2.4. Hydrocracking
- 6.2.1. Hydrotreating
- 6.1. Market Analysis, Insights and Forecast - by Product
- 7. Asia Pacific Refining Catalysts Industry Analysis, Insights and Forecast, 2020-2032
- 7.1. Market Analysis, Insights and Forecast - by Product
- 7.1.1. CoMo
- 7.1.2. NiMo
- 7.1.3. Alumina-based Noble Metal
- 7.1.4. NiW
- 7.1.5. Zeolites
- 7.1.6. Other Products
- 7.2. Market Analysis, Insights and Forecast - by Process
- 7.2.1. Hydrotreating
- 7.2.1.1. Gasoline
- 7.2.1.2. Kerosene
- 7.2.1.3. Diesel
- 7.2.1.4. Vacuum Gas Oil
- 7.2.1.5. Catalytic Cracking Gasoline
- 7.2.1.6. Residual Feed
- 7.2.2. Fluid Catalytic Cracking (FCC)
- 7.2.3. Residue Fluid Catalytic Cracking (RFCC)
- 7.2.4. Hydrocracking
- 7.2.1. Hydrotreating
- 7.1. Market Analysis, Insights and Forecast - by Product
- 8. North America Refining Catalysts Industry Analysis, Insights and Forecast, 2020-2032
- 8.1. Market Analysis, Insights and Forecast - by Product
- 8.1.1. CoMo
- 8.1.2. NiMo
- 8.1.3. Alumina-based Noble Metal
- 8.1.4. NiW
- 8.1.5. Zeolites
- 8.1.6. Other Products
- 8.2. Market Analysis, Insights and Forecast - by Process
- 8.2.1. Hydrotreating
- 8.2.1.1. Gasoline
- 8.2.1.2. Kerosene
- 8.2.1.3. Diesel
- 8.2.1.4. Vacuum Gas Oil
- 8.2.1.5. Catalytic Cracking Gasoline
- 8.2.1.6. Residual Feed
- 8.2.2. Fluid Catalytic Cracking (FCC)
- 8.2.3. Residue Fluid Catalytic Cracking (RFCC)
- 8.2.4. Hydrocracking
- 8.2.1. Hydrotreating
- 8.1. Market Analysis, Insights and Forecast - by Product
- 9. Europe Refining Catalysts Industry Analysis, Insights and Forecast, 2020-2032
- 9.1. Market Analysis, Insights and Forecast - by Product
- 9.1.1. CoMo
- 9.1.2. NiMo
- 9.1.3. Alumina-based Noble Metal
- 9.1.4. NiW
- 9.1.5. Zeolites
- 9.1.6. Other Products
- 9.2. Market Analysis, Insights and Forecast - by Process
- 9.2.1. Hydrotreating
- 9.2.1.1. Gasoline
- 9.2.1.2. Kerosene
- 9.2.1.3. Diesel
- 9.2.1.4. Vacuum Gas Oil
- 9.2.1.5. Catalytic Cracking Gasoline
- 9.2.1.6. Residual Feed
- 9.2.2. Fluid Catalytic Cracking (FCC)
- 9.2.3. Residue Fluid Catalytic Cracking (RFCC)
- 9.2.4. Hydrocracking
- 9.2.1. Hydrotreating
- 9.1. Market Analysis, Insights and Forecast - by Product
- 10. South America Refining Catalysts Industry Analysis, Insights and Forecast, 2020-2032
- 10.1. Market Analysis, Insights and Forecast - by Product
- 10.1.1. CoMo
- 10.1.2. NiMo
- 10.1.3. Alumina-based Noble Metal
- 10.1.4. NiW
- 10.1.5. Zeolites
- 10.1.6. Other Products
- 10.2. Market Analysis, Insights and Forecast - by Process
- 10.2.1. Hydrotreating
- 10.2.1.1. Gasoline
- 10.2.1.2. Kerosene
- 10.2.1.3. Diesel
- 10.2.1.4. Vacuum Gas Oil
- 10.2.1.5. Catalytic Cracking Gasoline
- 10.2.1.6. Residual Feed
- 10.2.2. Fluid Catalytic Cracking (FCC)
- 10.2.3. Residue Fluid Catalytic Cracking (RFCC)
- 10.2.4. Hydrocracking
- 10.2.1. Hydrotreating
- 10.1. Market Analysis, Insights and Forecast - by Product
- 11. Middle East and Africa Refining Catalysts Industry Analysis, Insights and Forecast, 2020-2032
- 11.1. Market Analysis, Insights and Forecast - by Product
- 11.1.1. CoMo
- 11.1.2. NiMo
- 11.1.3. Alumina-based Noble Metal
- 11.1.4. NiW
- 11.1.5. Zeolites
- 11.1.6. Other Products
- 11.2. Market Analysis, Insights and Forecast - by Process
- 11.2.1. Hydrotreating
- 11.2.1.1. Gasoline
- 11.2.1.2. Kerosene
- 11.2.1.3. Diesel
- 11.2.1.4. Vacuum Gas Oil
- 11.2.1.5. Catalytic Cracking Gasoline
- 11.2.1.6. Residual Feed
- 11.2.2. Fluid Catalytic Cracking (FCC)
- 11.2.3. Residue Fluid Catalytic Cracking (RFCC)
- 11.2.4. Hydrocracking
- 11.2.1. Hydrotreating
- 11.1. Market Analysis, Insights and Forecast - by Product
- 12. Competitive Analysis
- 12.1. Company Profiles
- 12.1.1 Axens
- 12.1.1.1. Company Overview
- 12.1.1.2. Products
- 12.1.1.3. Company Financials
- 12.1.1.4. SWOT Analysis
- 12.1.2 Topsoe
- 12.1.2.1. Company Overview
- 12.1.2.2. Products
- 12.1.2.3. Company Financials
- 12.1.2.4. SWOT Analysis
- 12.1.3 China Petrochemical Corporation
- 12.1.3.1. Company Overview
- 12.1.3.2. Products
- 12.1.3.3. Company Financials
- 12.1.3.4. SWOT Analysis
- 12.1.4 Exxon Mobil Corporation
- 12.1.4.1. Company Overview
- 12.1.4.2. Products
- 12.1.4.3. Company Financials
- 12.1.4.4. SWOT Analysis
- 12.1.5 BASF SE
- 12.1.5.1. Company Overview
- 12.1.5.2. Products
- 12.1.5.3. Company Financials
- 12.1.5.4. SWOT Analysis
- 12.1.6 Honeywell International
- 12.1.6.1. Company Overview
- 12.1.6.2. Products
- 12.1.6.3. Company Financials
- 12.1.6.4. SWOT Analysis
- 12.1.7 Chevron Lummus Global (CLG)
- 12.1.7.1. Company Overview
- 12.1.7.2. Products
- 12.1.7.3. Company Financials
- 12.1.7.4. SWOT Analysis
- 12.1.8 JGC C & C
- 12.1.8.1. Company Overview
- 12.1.8.2. Products
- 12.1.8.3. Company Financials
- 12.1.8.4. SWOT Analysis
- 12.1.9 Royal Dutch Shell PLC
- 12.1.9.1. Company Overview
- 12.1.9.2. Products
- 12.1.9.3. Company Financials
- 12.1.9.4. SWOT Analysis
- 12.1.10 Johnson Matthey
- 12.1.10.1. Company Overview
- 12.1.10.2. Products
- 12.1.10.3. Company Financials
- 12.1.10.4. SWOT Analysis
- 12.1.11 KNT Group
- 12.1.11.1. Company Overview
- 12.1.11.2. Products
- 12.1.11.3. Company Financials
- 12.1.11.4. SWOT Analysis
- 12.1.12 W R Grace & Co -Conn
- 12.1.12.1. Company Overview
- 12.1.12.2. Products
- 12.1.12.3. Company Financials
- 12.1.12.4. SWOT Analysis
- 12.1.13 Albemarle Corporation
- 12.1.13.1. Company Overview
- 12.1.13.2. Products
- 12.1.13.3. Company Financials
- 12.1.13.4. SWOT Analysis
- 12.1.1 Axens
- 12.2. Market Entropy
- 12.2.1 Company's Key Areas Served
- 12.2.2 Recent Developments
- 12.3. Company Market Share Analysis 2025
- 12.3.1 Top 5 Companies Market Share Analysis
- 12.3.2 Top 3 Companies Market Share Analysis
- 12.4. List of Potential Customers
- 13. Research Methodology
List of Figures
- Figure 1: Global Refining Catalysts Industry Revenue Breakdown (Billion, %) by Region 2025 & 2033
- Figure 2: Global Refining Catalysts Industry Volume Breakdown (K Tons, %) by Region 2025 & 2033
- Figure 3: Asia Pacific Refining Catalysts Industry Revenue (Billion), by Product 2025 & 2033
- Figure 4: Asia Pacific Refining Catalysts Industry Volume (K Tons), by Product 2025 & 2033
- Figure 5: Asia Pacific Refining Catalysts Industry Revenue Share (%), by Product 2025 & 2033
- Figure 6: Asia Pacific Refining Catalysts Industry Volume Share (%), by Product 2025 & 2033
- Figure 7: Asia Pacific Refining Catalysts Industry Revenue (Billion), by Process 2025 & 2033
- Figure 8: Asia Pacific Refining Catalysts Industry Volume (K Tons), by Process 2025 & 2033
- Figure 9: Asia Pacific Refining Catalysts Industry Revenue Share (%), by Process 2025 & 2033
- Figure 10: Asia Pacific Refining Catalysts Industry Volume Share (%), by Process 2025 & 2033
- Figure 11: Asia Pacific Refining Catalysts Industry Revenue (Billion), by Country 2025 & 2033
- Figure 12: Asia Pacific Refining Catalysts Industry Volume (K Tons), by Country 2025 & 2033
- Figure 13: Asia Pacific Refining Catalysts Industry Revenue Share (%), by Country 2025 & 2033
- Figure 14: Asia Pacific Refining Catalysts Industry Volume Share (%), by Country 2025 & 2033
- Figure 15: North America Refining Catalysts Industry Revenue (Billion), by Product 2025 & 2033
- Figure 16: North America Refining Catalysts Industry Volume (K Tons), by Product 2025 & 2033
- Figure 17: North America Refining Catalysts Industry Revenue Share (%), by Product 2025 & 2033
- Figure 18: North America Refining Catalysts Industry Volume Share (%), by Product 2025 & 2033
- Figure 19: North America Refining Catalysts Industry Revenue (Billion), by Process 2025 & 2033
- Figure 20: North America Refining Catalysts Industry Volume (K Tons), by Process 2025 & 2033
- Figure 21: North America Refining Catalysts Industry Revenue Share (%), by Process 2025 & 2033
- Figure 22: North America Refining Catalysts Industry Volume Share (%), by Process 2025 & 2033
- Figure 23: North America Refining Catalysts Industry Revenue (Billion), by Country 2025 & 2033
- Figure 24: North America Refining Catalysts Industry Volume (K Tons), by Country 2025 & 2033
- Figure 25: North America Refining Catalysts Industry Revenue Share (%), by Country 2025 & 2033
- Figure 26: North America Refining Catalysts Industry Volume Share (%), by Country 2025 & 2033
- Figure 27: Europe Refining Catalysts Industry Revenue (Billion), by Product 2025 & 2033
- Figure 28: Europe Refining Catalysts Industry Volume (K Tons), by Product 2025 & 2033
- Figure 29: Europe Refining Catalysts Industry Revenue Share (%), by Product 2025 & 2033
- Figure 30: Europe Refining Catalysts Industry Volume Share (%), by Product 2025 & 2033
- Figure 31: Europe Refining Catalysts Industry Revenue (Billion), by Process 2025 & 2033
- Figure 32: Europe Refining Catalysts Industry Volume (K Tons), by Process 2025 & 2033
- Figure 33: Europe Refining Catalysts Industry Revenue Share (%), by Process 2025 & 2033
- Figure 34: Europe Refining Catalysts Industry Volume Share (%), by Process 2025 & 2033
- Figure 35: Europe Refining Catalysts Industry Revenue (Billion), by Country 2025 & 2033
- Figure 36: Europe Refining Catalysts Industry Volume (K Tons), by Country 2025 & 2033
- Figure 37: Europe Refining Catalysts Industry Revenue Share (%), by Country 2025 & 2033
- Figure 38: Europe Refining Catalysts Industry Volume Share (%), by Country 2025 & 2033
- Figure 39: South America Refining Catalysts Industry Revenue (Billion), by Product 2025 & 2033
- Figure 40: South America Refining Catalysts Industry Volume (K Tons), by Product 2025 & 2033
- Figure 41: South America Refining Catalysts Industry Revenue Share (%), by Product 2025 & 2033
- Figure 42: South America Refining Catalysts Industry Volume Share (%), by Product 2025 & 2033
- Figure 43: South America Refining Catalysts Industry Revenue (Billion), by Process 2025 & 2033
- Figure 44: South America Refining Catalysts Industry Volume (K Tons), by Process 2025 & 2033
- Figure 45: South America Refining Catalysts Industry Revenue Share (%), by Process 2025 & 2033
- Figure 46: South America Refining Catalysts Industry Volume Share (%), by Process 2025 & 2033
- Figure 47: South America Refining Catalysts Industry Revenue (Billion), by Country 2025 & 2033
- Figure 48: South America Refining Catalysts Industry Volume (K Tons), by Country 2025 & 2033
- Figure 49: South America Refining Catalysts Industry Revenue Share (%), by Country 2025 & 2033
- Figure 50: South America Refining Catalysts Industry Volume Share (%), by Country 2025 & 2033
- Figure 51: Middle East and Africa Refining Catalysts Industry Revenue (Billion), by Product 2025 & 2033
- Figure 52: Middle East and Africa Refining Catalysts Industry Volume (K Tons), by Product 2025 & 2033
- Figure 53: Middle East and Africa Refining Catalysts Industry Revenue Share (%), by Product 2025 & 2033
- Figure 54: Middle East and Africa Refining Catalysts Industry Volume Share (%), by Product 2025 & 2033
- Figure 55: Middle East and Africa Refining Catalysts Industry Revenue (Billion), by Process 2025 & 2033
- Figure 56: Middle East and Africa Refining Catalysts Industry Volume (K Tons), by Process 2025 & 2033
- Figure 57: Middle East and Africa Refining Catalysts Industry Revenue Share (%), by Process 2025 & 2033
- Figure 58: Middle East and Africa Refining Catalysts Industry Volume Share (%), by Process 2025 & 2033
- Figure 59: Middle East and Africa Refining Catalysts Industry Revenue (Billion), by Country 2025 & 2033
- Figure 60: Middle East and Africa Refining Catalysts Industry Volume (K Tons), by Country 2025 & 2033
- Figure 61: Middle East and Africa Refining Catalysts Industry Revenue Share (%), by Country 2025 & 2033
- Figure 62: Middle East and Africa Refining Catalysts Industry Volume Share (%), by Country 2025 & 2033
List of Tables
- Table 1: Global Refining Catalysts Industry Revenue Billion Forecast, by Product 2020 & 2033
- Table 2: Global Refining Catalysts Industry Volume K Tons Forecast, by Product 2020 & 2033
- Table 3: Global Refining Catalysts Industry Revenue Billion Forecast, by Process 2020 & 2033
- Table 4: Global Refining Catalysts Industry Volume K Tons Forecast, by Process 2020 & 2033
- Table 5: Global Refining Catalysts Industry Revenue Billion Forecast, by Region 2020 & 2033
- Table 6: Global Refining Catalysts Industry Volume K Tons Forecast, by Region 2020 & 2033
- Table 7: Global Refining Catalysts Industry Revenue Billion Forecast, by Product 2020 & 2033
- Table 8: Global Refining Catalysts Industry Volume K Tons Forecast, by Product 2020 & 2033
- Table 9: Global Refining Catalysts Industry Revenue Billion Forecast, by Process 2020 & 2033
- Table 10: Global Refining Catalysts Industry Volume K Tons Forecast, by Process 2020 & 2033
- Table 11: Global Refining Catalysts Industry Revenue Billion Forecast, by Country 2020 & 2033
- Table 12: Global Refining Catalysts Industry Volume K Tons Forecast, by Country 2020 & 2033
- Table 13: China Refining Catalysts Industry Revenue (Billion) Forecast, by Application 2020 & 2033
- Table 14: China Refining Catalysts Industry Volume (K Tons) Forecast, by Application 2020 & 2033
- Table 15: India Refining Catalysts Industry Revenue (Billion) Forecast, by Application 2020 & 2033
- Table 16: India Refining Catalysts Industry Volume (K Tons) Forecast, by Application 2020 & 2033
- Table 17: Japan Refining Catalysts Industry Revenue (Billion) Forecast, by Application 2020 & 2033
- Table 18: Japan Refining Catalysts Industry Volume (K Tons) Forecast, by Application 2020 & 2033
- Table 19: South Korea Refining Catalysts Industry Revenue (Billion) Forecast, by Application 2020 & 2033
- Table 20: South Korea Refining Catalysts Industry Volume (K Tons) Forecast, by Application 2020 & 2033
- Table 21: ASEAN Countries Refining Catalysts Industry Revenue (Billion) Forecast, by Application 2020 & 2033
- Table 22: ASEAN Countries Refining Catalysts Industry Volume (K Tons) Forecast, by Application 2020 & 2033
- Table 23: Rest of Asia Pacific Refining Catalysts Industry Revenue (Billion) Forecast, by Application 2020 & 2033
- Table 24: Rest of Asia Pacific Refining Catalysts Industry Volume (K Tons) Forecast, by Application 2020 & 2033
- Table 25: Global Refining Catalysts Industry Revenue Billion Forecast, by Product 2020 & 2033
- Table 26: Global Refining Catalysts Industry Volume K Tons Forecast, by Product 2020 & 2033
- Table 27: Global Refining Catalysts Industry Revenue Billion Forecast, by Process 2020 & 2033
- Table 28: Global Refining Catalysts Industry Volume K Tons Forecast, by Process 2020 & 2033
- Table 29: Global Refining Catalysts Industry Revenue Billion Forecast, by Country 2020 & 2033
- Table 30: Global Refining Catalysts Industry Volume K Tons Forecast, by Country 2020 & 2033
- Table 31: United States Refining Catalysts Industry Revenue (Billion) Forecast, by Application 2020 & 2033
- Table 32: United States Refining Catalysts Industry Volume (K Tons) Forecast, by Application 2020 & 2033
- Table 33: Canada Refining Catalysts Industry Revenue (Billion) Forecast, by Application 2020 & 2033
- Table 34: Canada Refining Catalysts Industry Volume (K Tons) Forecast, by Application 2020 & 2033
- Table 35: Mexico Refining Catalysts Industry Revenue (Billion) Forecast, by Application 2020 & 2033
- Table 36: Mexico Refining Catalysts Industry Volume (K Tons) Forecast, by Application 2020 & 2033
- Table 37: Global Refining Catalysts Industry Revenue Billion Forecast, by Product 2020 & 2033
- Table 38: Global Refining Catalysts Industry Volume K Tons Forecast, by Product 2020 & 2033
- Table 39: Global Refining Catalysts Industry Revenue Billion Forecast, by Process 2020 & 2033
- Table 40: Global Refining Catalysts Industry Volume K Tons Forecast, by Process 2020 & 2033
- Table 41: Global Refining Catalysts Industry Revenue Billion Forecast, by Country 2020 & 2033
- Table 42: Global Refining Catalysts Industry Volume K Tons Forecast, by Country 2020 & 2033
- Table 43: Germany Refining Catalysts Industry Revenue (Billion) Forecast, by Application 2020 & 2033
- Table 44: Germany Refining Catalysts Industry Volume (K Tons) Forecast, by Application 2020 & 2033
- Table 45: United Kingdom Refining Catalysts Industry Revenue (Billion) Forecast, by Application 2020 & 2033
- Table 46: United Kingdom Refining Catalysts Industry Volume (K Tons) Forecast, by Application 2020 & 2033
- Table 47: Italy Refining Catalysts Industry Revenue (Billion) Forecast, by Application 2020 & 2033
- Table 48: Italy Refining Catalysts Industry Volume (K Tons) Forecast, by Application 2020 & 2033
- Table 49: France Refining Catalysts Industry Revenue (Billion) Forecast, by Application 2020 & 2033
- Table 50: France Refining Catalysts Industry Volume (K Tons) Forecast, by Application 2020 & 2033
- Table 51: Spain Refining Catalysts Industry Revenue (Billion) Forecast, by Application 2020 & 2033
- Table 52: Spain Refining Catalysts Industry Volume (K Tons) Forecast, by Application 2020 & 2033
- Table 53: Russia Refining Catalysts Industry Revenue (Billion) Forecast, by Application 2020 & 2033
- Table 54: Russia Refining Catalysts Industry Volume (K Tons) Forecast, by Application 2020 & 2033
- Table 55: Rest of Europe Refining Catalysts Industry Revenue (Billion) Forecast, by Application 2020 & 2033
- Table 56: Rest of Europe Refining Catalysts Industry Volume (K Tons) Forecast, by Application 2020 & 2033
- Table 57: Global Refining Catalysts Industry Revenue Billion Forecast, by Product 2020 & 2033
- Table 58: Global Refining Catalysts Industry Volume K Tons Forecast, by Product 2020 & 2033
- Table 59: Global Refining Catalysts Industry Revenue Billion Forecast, by Process 2020 & 2033
- Table 60: Global Refining Catalysts Industry Volume K Tons Forecast, by Process 2020 & 2033
- Table 61: Global Refining Catalysts Industry Revenue Billion Forecast, by Country 2020 & 2033
- Table 62: Global Refining Catalysts Industry Volume K Tons Forecast, by Country 2020 & 2033
- Table 63: Brazil Refining Catalysts Industry Revenue (Billion) Forecast, by Application 2020 & 2033
- Table 64: Brazil Refining Catalysts Industry Volume (K Tons) Forecast, by Application 2020 & 2033
- Table 65: Argentina Refining Catalysts Industry Revenue (Billion) Forecast, by Application 2020 & 2033
- Table 66: Argentina Refining Catalysts Industry Volume (K Tons) Forecast, by Application 2020 & 2033
- Table 67: Rest of South America Refining Catalysts Industry Revenue (Billion) Forecast, by Application 2020 & 2033
- Table 68: Rest of South America Refining Catalysts Industry Volume (K Tons) Forecast, by Application 2020 & 2033
- Table 69: Global Refining Catalysts Industry Revenue Billion Forecast, by Product 2020 & 2033
- Table 70: Global Refining Catalysts Industry Volume K Tons Forecast, by Product 2020 & 2033
- Table 71: Global Refining Catalysts Industry Revenue Billion Forecast, by Process 2020 & 2033
- Table 72: Global Refining Catalysts Industry Volume K Tons Forecast, by Process 2020 & 2033
- Table 73: Global Refining Catalysts Industry Revenue Billion Forecast, by Country 2020 & 2033
- Table 74: Global Refining Catalysts Industry Volume K Tons Forecast, by Country 2020 & 2033
- Table 75: Saudi Arabia Refining Catalysts Industry Revenue (Billion) Forecast, by Application 2020 & 2033
- Table 76: Saudi Arabia Refining Catalysts Industry Volume (K Tons) Forecast, by Application 2020 & 2033
- Table 77: South Africa Refining Catalysts Industry Revenue (Billion) Forecast, by Application 2020 & 2033
- Table 78: South Africa Refining Catalysts Industry Volume (K Tons) Forecast, by Application 2020 & 2033
- Table 79: Rest of Middle East and Africa Refining Catalysts Industry Revenue (Billion) Forecast, by Application 2020 & 2033
- Table 80: Rest of Middle East and Africa Refining Catalysts Industry Volume (K Tons) Forecast, by Application 2020 & 2033
Frequently Asked Questions
1. What is the projected Compound Annual Growth Rate (CAGR) of the Refining Catalysts Industry?
The projected CAGR is approximately 3.69%.
2. Which companies are prominent players in the Refining Catalysts Industry?
Key companies in the market include Axens, Topsoe, China Petrochemical Corporation, Exxon Mobil Corporation, BASF SE, Honeywell International, Chevron Lummus Global (CLG), JGC C & C, Royal Dutch Shell PLC, Johnson Matthey, KNT Group, W R Grace & Co -Conn, Albemarle Corporation.
3. What are the main segments of the Refining Catalysts Industry?
The market segments include Product, Process.
4. Can you provide details about the market size?
The market size is estimated to be USD 3.9 Billion as of 2022.
5. What are some drivers contributing to market growth?
Accelerating Demand for Higher-Octane Fuel; Expansion of Oil and Gas Activities; Other Drivers.
6. What are the notable trends driving market growth?
Fluid Catalytic Cracking (FCC) Catalysts to Dominate the Market.
7. Are there any restraints impacting market growth?
Volatility in Precious Metal Prices; Other Restraints.
8. Can you provide examples of recent developments in the market?
March 2022: BASF launched Fourtitude, a new Fluid Catalytic Cracking (FCC) catalyst designed to maximize butylenes from resid feedstocks.
9. What pricing options are available for accessing the report?
Pricing options include single-user, multi-user, and enterprise licenses priced at USD 3,950, USD 4,950, and USD 6,950 respectively.
10. Is the market size provided in terms of value or volume?
The market size is provided in terms of value, measured in Billion and volume, measured in K Tons.
11. Are there any specific market keywords associated with the report?
Yes, the market keyword associated with the report is "Refining Catalysts Industry," which aids in identifying and referencing the specific market segment covered.
12. How do I determine which pricing option suits my needs best?
The pricing options vary based on user requirements and access needs. Individual users may opt for single-user licenses, while businesses requiring broader access may choose multi-user or enterprise licenses for cost-effective access to the report.
13. Are there any additional resources or data provided in the Refining Catalysts Industry report?
While the report offers comprehensive insights, it's advisable to review the specific contents or supplementary materials provided to ascertain if additional resources or data are available.
14. How can I stay updated on further developments or reports in the Refining Catalysts Industry?
To stay informed about further developments, trends, and reports in the Refining Catalysts Industry, consider subscribing to industry newsletters, following relevant companies and organizations, or regularly checking reputable industry news sources and publications.
Methodology
Step 1 - Identification of Relevant Samples Size from Population Database


Step 2 - Approaches for Defining Global Market Size (Value, Volume* & Price*)

Note*: In applicable scenarios
Step 3 - Data Sources
Primary Research
- Web Analytics
- Survey Reports
- Research Institute
- Latest Research Reports
- Opinion Leaders
Secondary Research
- Annual Reports
- White Paper
- Latest Press Release
- Industry Association
- Paid Database
- Investor Presentations

Step 4 - Data Triangulation
Involves using different sources of information in order to increase the validity of a study
These sources are likely to be stakeholders in a program - participants, other researchers, program staff, other community members, and so on.
Then we put all data in single framework & apply various statistical tools to find out the dynamic on the market.
During the analysis stage, feedback from the stakeholder groups would be compared to determine areas of agreement as well as areas of divergence