

Key Insights
The renal cancer drug market, valued at $6.92 billion in 2025, is projected to experience robust growth, driven by a rising prevalence of renal cell carcinoma (RCC) globally and continuous advancements in targeted therapies and immunotherapies. The market's Compound Annual Growth Rate (CAGR) of 4.86% from 2025 to 2033 indicates substantial future expansion. Key drivers include the increasing geriatric population (a higher-risk group for renal cancer), improved diagnostic techniques leading to earlier detection, and the ongoing development of novel therapies with enhanced efficacy and safety profiles. The market is segmented by component (drugs and diagnostics), therapeutic class (targeted therapy, immunotherapy, and others), pharmacologic class (angiogenesis inhibitors, monoclonal antibodies, mTOR inhibitors, and cytokine immunotherapy), and cancer type (clear cell RCC, papillary RCC, chromophobe RCC, urothelial carcinoma, and other kidney cancers). The segment of targeted therapies is currently dominant, but immunotherapy is expected to witness significant growth due to its potential for improved long-term outcomes. Geographic variations exist, with North America and Europe holding substantial market shares due to advanced healthcare infrastructure and higher treatment rates. However, the Asia Pacific region is expected to demonstrate notable growth potential in the coming years due to increasing awareness and improved healthcare access. Competition in the market is intense, with major pharmaceutical companies such as Bayer AG, Amgen Inc., Novartis, and others actively involved in research and development, as well as commercialization of renal cancer drugs.
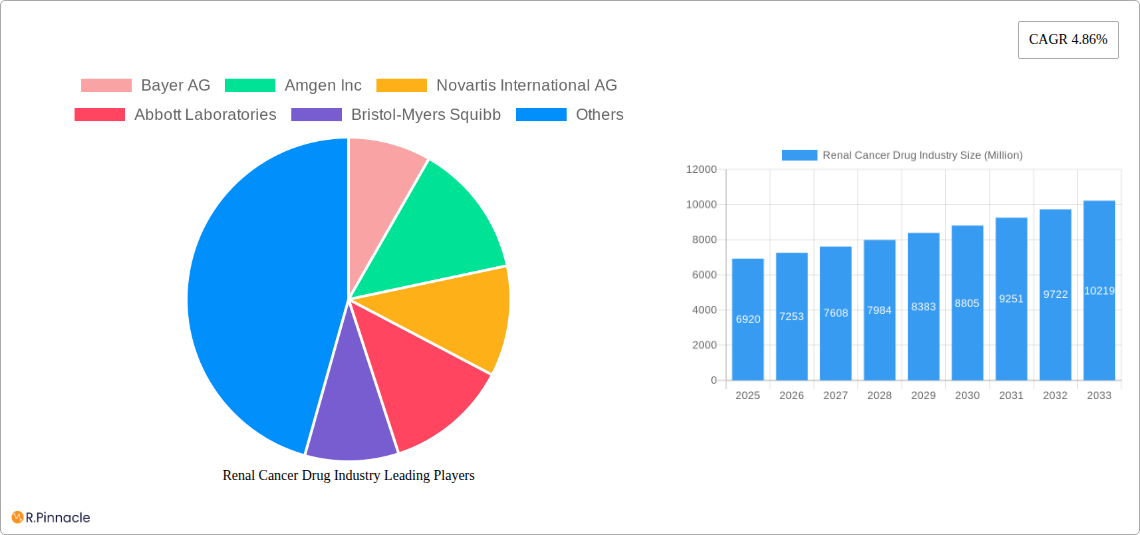
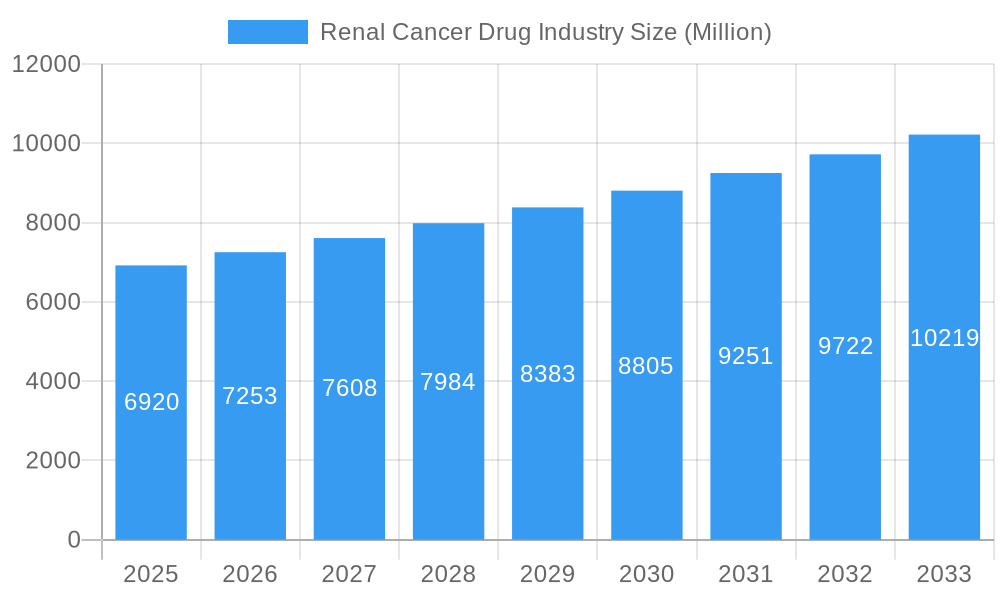
Renal Cancer Drug Industry Market Size (In Billion)
The continued development and approval of innovative therapies, including next-generation targeted agents and immunotherapies, will likely shape the market landscape. Furthermore, the focus on personalized medicine and the development of biomarkers to predict treatment response will also influence market growth. Potential restraints include high treatment costs, the emergence of drug resistance, and the need for better access to advanced therapies in low- and middle-income countries. However, ongoing research and development efforts, coupled with strategic partnerships and collaborations among pharmaceutical companies and research institutions, are expected to mitigate these challenges and fuel future market expansion. The long-term outlook for the renal cancer drug market remains positive, reflecting the significant unmet medical need and the continuous pursuit of effective and safe treatment options.
Renal Cancer Drug Industry Company Market Share
Renal Cancer Drug Industry Report: 2019-2033 Forecast
This comprehensive report provides an in-depth analysis of the Renal Cancer Drug Industry, offering actionable insights for industry professionals, investors, and researchers. With a focus on market dynamics, competitive landscape, and future growth projections, this report covers the period from 2019 to 2033, with a base year of 2025 and a forecast period of 2025-2033. The report leverages extensive data analysis to provide a clear understanding of this crucial sector of the pharmaceutical industry. Expected market value in Millions.
Renal Cancer Drug Industry Market Structure & Innovation Trends
The renal cancer drug market is characterized by a moderately concentrated structure, with several multinational pharmaceutical giants holding significant market share. Key players like Bayer AG, Amgen Inc, Novartis International AG, Abbott Laboratories, Bristol-Myers Squibb, Merck KGaA (EMD Serono), Seattle Genetics, F Hoffmann-La Roche, and Pfizer Inc. dominate the landscape. Market share dynamics are influenced by ongoing R&D efforts, regulatory approvals, and strategic mergers and acquisitions (M&A). Innovation is driven by the need for more effective and less toxic treatments, particularly for advanced renal cell carcinoma (RCC). The regulatory framework plays a crucial role, impacting drug development timelines and market access. Existing therapies face competition from emerging targeted therapies and immunotherapies. The end-user demographic primarily comprises oncologists, urologists, and patients with renal cancer. Significant M&A activity, with deal values exceeding xx Million in recent years, demonstrates the industry's focus on consolidation and portfolio expansion.
- Market Concentration: Moderately concentrated, with top 10 players holding approximately xx% market share in 2025.
- Innovation Drivers: Development of novel targeted therapies, immunotherapies, and combination regimens.
- Regulatory Frameworks: Stringent approval processes, impacting drug development timelines and market entry.
- Product Substitutes: Limited, with ongoing research focusing on improved efficacy and tolerability.
- M&A Activity: Significant consolidation, with xx Million in deals recorded between 2019 and 2024.
Renal Cancer Drug Industry Market Dynamics & Trends
The renal cancer drug market is experiencing robust growth, driven by increasing prevalence of renal cancer, rising healthcare expenditure, and the launch of innovative therapies. The compound annual growth rate (CAGR) is projected to be xx% during the forecast period (2025-2033). Technological disruptions, such as advancements in immunotherapy and targeted therapy, are reshaping the treatment landscape. Consumer preferences are shifting towards minimally invasive therapies and personalized medicine approaches. Competitive dynamics are intense, with companies investing heavily in R&D to develop next-generation therapies. Market penetration of novel therapies is increasing, particularly in the targeted therapy segment, with xx% penetration rate projected for 2025. Challenges include high drug prices, access limitations in certain regions, and the emergence of drug resistance.
Dominant Regions & Segments in Renal Cancer Drug Industry
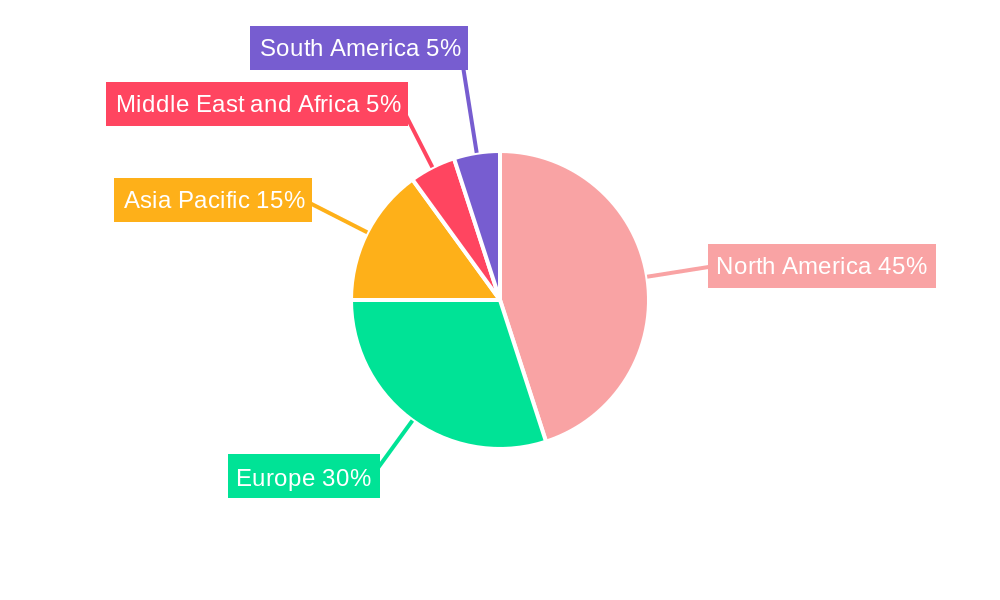
North America holds the largest market share, driven by high healthcare expenditure and a large patient pool. However, the Asia-Pacific region is expected to witness significant growth owing to increasing awareness, rising disposable income, and expanding healthcare infrastructure.
Key Drivers:
- North America: High healthcare spending, advanced healthcare infrastructure, and early adoption of new therapies.
- Europe: Well-established healthcare systems, strong regulatory frameworks, and a substantial patient population.
- Asia-Pacific: Increasing healthcare expenditure, rising awareness about renal cancer, and growing adoption of advanced therapies.
Dominant Segments:
- By Component: Drugs represent the largest segment, with a projected market value of xx Million in 2025.
- By Therapeutic Class: Targeted therapy and immunotherapy are the leading segments, driven by their efficacy and improved tolerability compared to traditional chemotherapy.
- By Pharmacologic Class: Angiogenesis inhibitors and monoclonal antibodies are the most widely used drug classes.
- By Cancer Type: Clear cell RCC dominates the market share, accounting for xx% in 2025.
Renal Cancer Drug Industry Product Innovations
Significant advancements are shaping the renal cancer drug landscape. Next-generation targeted therapies, including immunotherapies, are demonstrating improved efficacy and response rates compared to traditional treatments. The focus is on developing personalized medicine approaches, tailored to specific genetic and molecular profiles of renal cancer. Combination therapies are also gaining traction, offering synergistic benefits and enhanced treatment outcomes. These innovations are improving patient survival rates and quality of life, driving market growth.
Report Scope & Segmentation Analysis
This report provides a comprehensive segmentation analysis of the renal cancer drug market across various parameters, including component (drugs, diagnostics), therapeutic class (targeted therapy, immunotherapy, other therapeutic class), pharmacologic class (angiogenesis inhibitors, monoclonal antibodies, mTOR inhibitors, cytokine immunotherapy (IL-2)), and cancer type (clear cell RCC, papillary RCC, chromophobe RCC, urothelial carcinoma, other kidney cancers). Each segment is analyzed in terms of market size, growth projections, and competitive dynamics. Specific growth projections vary based on the segment, but overall, substantial growth is expected across all areas.
Key Drivers of Renal Cancer Drug Industry Growth
Several factors are driving the growth of the renal cancer drug industry. Technological advancements, such as the development of targeted therapies and immunotherapies, are leading to improved treatment outcomes. Increased awareness and early detection of renal cancer are also contributing to market growth. Favorable regulatory environments in key markets are accelerating drug approvals and market access. Furthermore, rising healthcare expenditure and growing demand for innovative cancer therapies are boosting market expansion.
Challenges in the Renal Cancer Drug Industry Sector
Despite substantial growth, the renal cancer drug industry faces several challenges. High drug prices and limited access to expensive therapies in certain regions pose significant barriers. Regulatory hurdles and stringent approval processes can delay drug development and market entry. Competition among established players and the emergence of biosimilars can impact profitability. Supply chain disruptions and manufacturing complexities can further impede market growth.
Emerging Opportunities in Renal Cancer Drug Industry
The renal cancer drug market presents several promising opportunities. Growing demand for personalized medicine approaches and targeted therapies offers significant potential. Emerging markets in Asia and Latin America represent untapped growth opportunities. Advances in immunotherapy and combination therapies are paving the way for improved treatment outcomes. Focus on early detection programs and improved patient care can positively impact the market.
Leading Players in the Renal Cancer Drug Industry Market
Key Developments in Renal Cancer Drug Industry Industry
- October 2022: Health Canada approved KEYTRUDA (pembrolizumab) for adjuvant treatment of high-risk renal cell carcinoma.
- August 2022: The European Commission approved Celltrion Healthcare's Vegzelma (CT-P16) for metastatic renal cell carcinoma.
Future Outlook for Renal Cancer Drug Industry Market
The renal cancer drug market is poised for continued growth, driven by technological advancements, increasing prevalence of renal cancer, and rising healthcare expenditure. Strategic partnerships, acquisitions, and the development of innovative therapies will shape the industry's future. Focus on personalized medicine, combination therapies, and improved access to treatment will drive further market expansion. The market is expected to reach xx Million by 2033, presenting significant opportunities for players in the industry.
Renal Cancer Drug Industry Segmentation
-
1. Cancer Type
- 1.1. Clear cell RCC
- 1.2. Papillary RCC
- 1.3. Chromophobe RCC
- 1.4. Urothelial carcinoma/Transitional cell carcinoma
- 1.5. Other Ki
-
2. Component
-
2.1. Drugs
-
2.1.1. Therapeutic Class
- 2.1.1.1. Targeted Therapy
- 2.1.1.2. Immunotherapy
- 2.1.1.3. Other Therapeutic Class
-
2.1.2. Pharmacologic Class
- 2.1.2.1. Angiogenesis Inhibitors
- 2.1.2.2. Monoclonal Antibodies
- 2.1.2.3. mTOR Inhibitors
- 2.1.2.4. Cytokine Immunotherapy (IL-2)
-
2.1.1. Therapeutic Class
-
2.2. Diagnostics
- 2.2.1. Biopsy
- 2.2.2. Imaging Tests
- 2.2.3. Blood Tests
- 2.2.4. Other Diagnostics
-
2.1. Drugs
Renal Cancer Drug Industry Segmentation By Geography
-
1. North America
- 1.1. United States
- 1.2. Canada
- 1.3. Mexico
-
2. Europe
- 2.1. Germany
- 2.2. United Kingdom
- 2.3. France
- 2.4. Italy
- 2.5. Spain
- 2.6. Rest of Europe
-
3. Asia Pacific
- 3.1. China
- 3.2. Japan
- 3.3. India
- 3.4. Australia
- 3.5. South Korea
- 3.6. Rest of Asia Pacific
-
4. Middle East and Africa
- 4.1. GCC
- 4.2. South Africa
- 4.3. Rest of Middle East and Africa
-
5. South America
- 5.1. Brazil
- 5.2. Argentina
- 5.3. Rest of South America
Renal Cancer Drug Industry Regional Market Share
Geographic Coverage of Renal Cancer Drug Industry
Renal Cancer Drug Industry REPORT HIGHLIGHTS
| Aspects | Details |
|---|---|
| Study Period | 2020-2034 |
| Base Year | 2025 |
| Estimated Year | 2026 |
| Forecast Period | 2026-2034 |
| Historical Period | 2020-2025 |
| Growth Rate | CAGR of 4.86% from 2020-2034 |
| Segmentation |
|
Table of Contents
- 1. Introduction
- 1.1. Research Scope
- 1.2. Market Segmentation
- 1.3. Research Objective
- 1.4. Definitions and Assumptions
- 2. Executive Summary
- 2.1. Market Snapshot
- 3. Market Dynamics
- 3.1. Market Drivers
- 3.2. Market Restrains
- 3.3. Market Trends
- 3.4. Market Opportunities
- 4. Market Factor Analysis
- 4.1. Porters Five Forces
- 4.1.1. Bargaining Power of Suppliers
- 4.1.2. Bargaining Power of Buyers
- 4.1.3. Threat of New Entrants
- 4.1.4. Threat of Substitutes
- 4.1.5. Competitive Rivalry
- 4.2. PESTEL analysis
- 4.3. BCG Analysis
- 4.3.1. Stars (High Growth, High Market Share)
- 4.3.2. Cash Cows (Low Growth, High Market Share)
- 4.3.3. Question Mark (High Growth, Low Market Share)
- 4.3.4. Dogs (Low Growth, Low Market Share)
- 4.4. Ansoff Matrix Analysis
- 4.5. Supply Chain Analysis
- 4.6. Regulatory Landscape
- 4.7. Current Market Potential and Opportunity Assessment (TAM–SAM–SOM Framework)
- 4.8. PRI Analyst Note
- 4.1. Porters Five Forces
- 5. Market Analysis, Insights and Forecast 2021-2033
- 5.1. Market Analysis, Insights and Forecast - by Cancer Type
- 5.1.1. Clear cell RCC
- 5.1.2. Papillary RCC
- 5.1.3. Chromophobe RCC
- 5.1.4. Urothelial carcinoma/Transitional cell carcinoma
- 5.1.5. Other Ki
- 5.2. Market Analysis, Insights and Forecast - by Component
- 5.2.1. Drugs
- 5.2.1.1. Therapeutic Class
- 5.2.1.1.1. Targeted Therapy
- 5.2.1.1.2. Immunotherapy
- 5.2.1.1.3. Other Therapeutic Class
- 5.2.1.2. Pharmacologic Class
- 5.2.1.2.1. Angiogenesis Inhibitors
- 5.2.1.2.2. Monoclonal Antibodies
- 5.2.1.2.3. mTOR Inhibitors
- 5.2.1.2.4. Cytokine Immunotherapy (IL-2)
- 5.2.1.1. Therapeutic Class
- 5.2.2. Diagnostics
- 5.2.2.1. Biopsy
- 5.2.2.2. Imaging Tests
- 5.2.2.3. Blood Tests
- 5.2.2.4. Other Diagnostics
- 5.2.1. Drugs
- 5.3. Market Analysis, Insights and Forecast - by Region
- 5.3.1. North America
- 5.3.2. Europe
- 5.3.3. Asia Pacific
- 5.3.4. Middle East and Africa
- 5.3.5. South America
- 5.1. Market Analysis, Insights and Forecast - by Cancer Type
- 6. Global Renal Cancer Drug Industry Analysis, Insights and Forecast, 2021-2033
- 6.1. Market Analysis, Insights and Forecast - by Cancer Type
- 6.1.1. Clear cell RCC
- 6.1.2. Papillary RCC
- 6.1.3. Chromophobe RCC
- 6.1.4. Urothelial carcinoma/Transitional cell carcinoma
- 6.1.5. Other Ki
- 6.2. Market Analysis, Insights and Forecast - by Component
- 6.2.1. Drugs
- 6.2.1.1. Therapeutic Class
- 6.2.1.1.1. Targeted Therapy
- 6.2.1.1.2. Immunotherapy
- 6.2.1.1.3. Other Therapeutic Class
- 6.2.1.2. Pharmacologic Class
- 6.2.1.2.1. Angiogenesis Inhibitors
- 6.2.1.2.2. Monoclonal Antibodies
- 6.2.1.2.3. mTOR Inhibitors
- 6.2.1.2.4. Cytokine Immunotherapy (IL-2)
- 6.2.1.1. Therapeutic Class
- 6.2.2. Diagnostics
- 6.2.2.1. Biopsy
- 6.2.2.2. Imaging Tests
- 6.2.2.3. Blood Tests
- 6.2.2.4. Other Diagnostics
- 6.2.1. Drugs
- 6.1. Market Analysis, Insights and Forecast - by Cancer Type
- 7. North America Renal Cancer Drug Industry Analysis, Insights and Forecast, 2020-2032
- 7.1. Market Analysis, Insights and Forecast - by Cancer Type
- 7.1.1. Clear cell RCC
- 7.1.2. Papillary RCC
- 7.1.3. Chromophobe RCC
- 7.1.4. Urothelial carcinoma/Transitional cell carcinoma
- 7.1.5. Other Ki
- 7.2. Market Analysis, Insights and Forecast - by Component
- 7.2.1. Drugs
- 7.2.1.1. Therapeutic Class
- 7.2.1.1.1. Targeted Therapy
- 7.2.1.1.2. Immunotherapy
- 7.2.1.1.3. Other Therapeutic Class
- 7.2.1.2. Pharmacologic Class
- 7.2.1.2.1. Angiogenesis Inhibitors
- 7.2.1.2.2. Monoclonal Antibodies
- 7.2.1.2.3. mTOR Inhibitors
- 7.2.1.2.4. Cytokine Immunotherapy (IL-2)
- 7.2.1.1. Therapeutic Class
- 7.2.2. Diagnostics
- 7.2.2.1. Biopsy
- 7.2.2.2. Imaging Tests
- 7.2.2.3. Blood Tests
- 7.2.2.4. Other Diagnostics
- 7.2.1. Drugs
- 7.1. Market Analysis, Insights and Forecast - by Cancer Type
- 8. Europe Renal Cancer Drug Industry Analysis, Insights and Forecast, 2020-2032
- 8.1. Market Analysis, Insights and Forecast - by Cancer Type
- 8.1.1. Clear cell RCC
- 8.1.2. Papillary RCC
- 8.1.3. Chromophobe RCC
- 8.1.4. Urothelial carcinoma/Transitional cell carcinoma
- 8.1.5. Other Ki
- 8.2. Market Analysis, Insights and Forecast - by Component
- 8.2.1. Drugs
- 8.2.1.1. Therapeutic Class
- 8.2.1.1.1. Targeted Therapy
- 8.2.1.1.2. Immunotherapy
- 8.2.1.1.3. Other Therapeutic Class
- 8.2.1.2. Pharmacologic Class
- 8.2.1.2.1. Angiogenesis Inhibitors
- 8.2.1.2.2. Monoclonal Antibodies
- 8.2.1.2.3. mTOR Inhibitors
- 8.2.1.2.4. Cytokine Immunotherapy (IL-2)
- 8.2.1.1. Therapeutic Class
- 8.2.2. Diagnostics
- 8.2.2.1. Biopsy
- 8.2.2.2. Imaging Tests
- 8.2.2.3. Blood Tests
- 8.2.2.4. Other Diagnostics
- 8.2.1. Drugs
- 8.1. Market Analysis, Insights and Forecast - by Cancer Type
- 9. Asia Pacific Renal Cancer Drug Industry Analysis, Insights and Forecast, 2020-2032
- 9.1. Market Analysis, Insights and Forecast - by Cancer Type
- 9.1.1. Clear cell RCC
- 9.1.2. Papillary RCC
- 9.1.3. Chromophobe RCC
- 9.1.4. Urothelial carcinoma/Transitional cell carcinoma
- 9.1.5. Other Ki
- 9.2. Market Analysis, Insights and Forecast - by Component
- 9.2.1. Drugs
- 9.2.1.1. Therapeutic Class
- 9.2.1.1.1. Targeted Therapy
- 9.2.1.1.2. Immunotherapy
- 9.2.1.1.3. Other Therapeutic Class
- 9.2.1.2. Pharmacologic Class
- 9.2.1.2.1. Angiogenesis Inhibitors
- 9.2.1.2.2. Monoclonal Antibodies
- 9.2.1.2.3. mTOR Inhibitors
- 9.2.1.2.4. Cytokine Immunotherapy (IL-2)
- 9.2.1.1. Therapeutic Class
- 9.2.2. Diagnostics
- 9.2.2.1. Biopsy
- 9.2.2.2. Imaging Tests
- 9.2.2.3. Blood Tests
- 9.2.2.4. Other Diagnostics
- 9.2.1. Drugs
- 9.1. Market Analysis, Insights and Forecast - by Cancer Type
- 10. Middle East and Africa Renal Cancer Drug Industry Analysis, Insights and Forecast, 2020-2032
- 10.1. Market Analysis, Insights and Forecast - by Cancer Type
- 10.1.1. Clear cell RCC
- 10.1.2. Papillary RCC
- 10.1.3. Chromophobe RCC
- 10.1.4. Urothelial carcinoma/Transitional cell carcinoma
- 10.1.5. Other Ki
- 10.2. Market Analysis, Insights and Forecast - by Component
- 10.2.1. Drugs
- 10.2.1.1. Therapeutic Class
- 10.2.1.1.1. Targeted Therapy
- 10.2.1.1.2. Immunotherapy
- 10.2.1.1.3. Other Therapeutic Class
- 10.2.1.2. Pharmacologic Class
- 10.2.1.2.1. Angiogenesis Inhibitors
- 10.2.1.2.2. Monoclonal Antibodies
- 10.2.1.2.3. mTOR Inhibitors
- 10.2.1.2.4. Cytokine Immunotherapy (IL-2)
- 10.2.1.1. Therapeutic Class
- 10.2.2. Diagnostics
- 10.2.2.1. Biopsy
- 10.2.2.2. Imaging Tests
- 10.2.2.3. Blood Tests
- 10.2.2.4. Other Diagnostics
- 10.2.1. Drugs
- 10.1. Market Analysis, Insights and Forecast - by Cancer Type
- 11. South America Renal Cancer Drug Industry Analysis, Insights and Forecast, 2020-2032
- 11.1. Market Analysis, Insights and Forecast - by Cancer Type
- 11.1.1. Clear cell RCC
- 11.1.2. Papillary RCC
- 11.1.3. Chromophobe RCC
- 11.1.4. Urothelial carcinoma/Transitional cell carcinoma
- 11.1.5. Other Ki
- 11.2. Market Analysis, Insights and Forecast - by Component
- 11.2.1. Drugs
- 11.2.1.1. Therapeutic Class
- 11.2.1.1.1. Targeted Therapy
- 11.2.1.1.2. Immunotherapy
- 11.2.1.1.3. Other Therapeutic Class
- 11.2.1.2. Pharmacologic Class
- 11.2.1.2.1. Angiogenesis Inhibitors
- 11.2.1.2.2. Monoclonal Antibodies
- 11.2.1.2.3. mTOR Inhibitors
- 11.2.1.2.4. Cytokine Immunotherapy (IL-2)
- 11.2.1.1. Therapeutic Class
- 11.2.2. Diagnostics
- 11.2.2.1. Biopsy
- 11.2.2.2. Imaging Tests
- 11.2.2.3. Blood Tests
- 11.2.2.4. Other Diagnostics
- 11.2.1. Drugs
- 11.1. Market Analysis, Insights and Forecast - by Cancer Type
- 12. Competitive Analysis
- 12.1. Company Profiles
- 12.1.1 Bayer AG
- 12.1.1.1. Company Overview
- 12.1.1.2. Products
- 12.1.1.3. Company Financials
- 12.1.1.4. SWOT Analysis
- 12.1.2 Amgen Inc
- 12.1.2.1. Company Overview
- 12.1.2.2. Products
- 12.1.2.3. Company Financials
- 12.1.2.4. SWOT Analysis
- 12.1.3 Novartis International AG
- 12.1.3.1. Company Overview
- 12.1.3.2. Products
- 12.1.3.3. Company Financials
- 12.1.3.4. SWOT Analysis
- 12.1.4 Abbott Laboratories
- 12.1.4.1. Company Overview
- 12.1.4.2. Products
- 12.1.4.3. Company Financials
- 12.1.4.4. SWOT Analysis
- 12.1.5 Bristol-Myers Squibb
- 12.1.5.1. Company Overview
- 12.1.5.2. Products
- 12.1.5.3. Company Financials
- 12.1.5.4. SWOT Analysis
- 12.1.6 Merck KGaA (EMD Serono)
- 12.1.6.1. Company Overview
- 12.1.6.2. Products
- 12.1.6.3. Company Financials
- 12.1.6.4. SWOT Analysis
- 12.1.7 Seattle Genetic*List Not Exhaustive
- 12.1.7.1. Company Overview
- 12.1.7.2. Products
- 12.1.7.3. Company Financials
- 12.1.7.4. SWOT Analysis
- 12.1.8 F Hoffmann-La Roche
- 12.1.8.1. Company Overview
- 12.1.8.2. Products
- 12.1.8.3. Company Financials
- 12.1.8.4. SWOT Analysis
- 12.1.9 Pfizer Inc
- 12.1.9.1. Company Overview
- 12.1.9.2. Products
- 12.1.9.3. Company Financials
- 12.1.9.4. SWOT Analysis
- 12.1.1 Bayer AG
- 12.2. Market Entropy
- 12.2.1 Company's Key Areas Served
- 12.2.2 Recent Developments
- 12.3. Company Market Share Analysis 2025
- 12.3.1 Top 5 Companies Market Share Analysis
- 12.3.2 Top 3 Companies Market Share Analysis
- 12.4. List of Potential Customers
- 13. Research Methodology
List of Figures
- Figure 1: Global Renal Cancer Drug Industry Revenue Breakdown (Million, %) by Region 2025 & 2033
- Figure 2: North America Renal Cancer Drug Industry Revenue (Million), by Cancer Type 2025 & 2033
- Figure 3: North America Renal Cancer Drug Industry Revenue Share (%), by Cancer Type 2025 & 2033
- Figure 4: North America Renal Cancer Drug Industry Revenue (Million), by Component 2025 & 2033
- Figure 5: North America Renal Cancer Drug Industry Revenue Share (%), by Component 2025 & 2033
- Figure 6: North America Renal Cancer Drug Industry Revenue (Million), by Country 2025 & 2033
- Figure 7: North America Renal Cancer Drug Industry Revenue Share (%), by Country 2025 & 2033
- Figure 8: Europe Renal Cancer Drug Industry Revenue (Million), by Cancer Type 2025 & 2033
- Figure 9: Europe Renal Cancer Drug Industry Revenue Share (%), by Cancer Type 2025 & 2033
- Figure 10: Europe Renal Cancer Drug Industry Revenue (Million), by Component 2025 & 2033
- Figure 11: Europe Renal Cancer Drug Industry Revenue Share (%), by Component 2025 & 2033
- Figure 12: Europe Renal Cancer Drug Industry Revenue (Million), by Country 2025 & 2033
- Figure 13: Europe Renal Cancer Drug Industry Revenue Share (%), by Country 2025 & 2033
- Figure 14: Asia Pacific Renal Cancer Drug Industry Revenue (Million), by Cancer Type 2025 & 2033
- Figure 15: Asia Pacific Renal Cancer Drug Industry Revenue Share (%), by Cancer Type 2025 & 2033
- Figure 16: Asia Pacific Renal Cancer Drug Industry Revenue (Million), by Component 2025 & 2033
- Figure 17: Asia Pacific Renal Cancer Drug Industry Revenue Share (%), by Component 2025 & 2033
- Figure 18: Asia Pacific Renal Cancer Drug Industry Revenue (Million), by Country 2025 & 2033
- Figure 19: Asia Pacific Renal Cancer Drug Industry Revenue Share (%), by Country 2025 & 2033
- Figure 20: Middle East and Africa Renal Cancer Drug Industry Revenue (Million), by Cancer Type 2025 & 2033
- Figure 21: Middle East and Africa Renal Cancer Drug Industry Revenue Share (%), by Cancer Type 2025 & 2033
- Figure 22: Middle East and Africa Renal Cancer Drug Industry Revenue (Million), by Component 2025 & 2033
- Figure 23: Middle East and Africa Renal Cancer Drug Industry Revenue Share (%), by Component 2025 & 2033
- Figure 24: Middle East and Africa Renal Cancer Drug Industry Revenue (Million), by Country 2025 & 2033
- Figure 25: Middle East and Africa Renal Cancer Drug Industry Revenue Share (%), by Country 2025 & 2033
- Figure 26: South America Renal Cancer Drug Industry Revenue (Million), by Cancer Type 2025 & 2033
- Figure 27: South America Renal Cancer Drug Industry Revenue Share (%), by Cancer Type 2025 & 2033
- Figure 28: South America Renal Cancer Drug Industry Revenue (Million), by Component 2025 & 2033
- Figure 29: South America Renal Cancer Drug Industry Revenue Share (%), by Component 2025 & 2033
- Figure 30: South America Renal Cancer Drug Industry Revenue (Million), by Country 2025 & 2033
- Figure 31: South America Renal Cancer Drug Industry Revenue Share (%), by Country 2025 & 2033
List of Tables
- Table 1: Global Renal Cancer Drug Industry Revenue Million Forecast, by Cancer Type 2020 & 2033
- Table 2: Global Renal Cancer Drug Industry Revenue Million Forecast, by Component 2020 & 2033
- Table 3: Global Renal Cancer Drug Industry Revenue Million Forecast, by Region 2020 & 2033
- Table 4: Global Renal Cancer Drug Industry Revenue Million Forecast, by Cancer Type 2020 & 2033
- Table 5: Global Renal Cancer Drug Industry Revenue Million Forecast, by Component 2020 & 2033
- Table 6: Global Renal Cancer Drug Industry Revenue Million Forecast, by Country 2020 & 2033
- Table 7: United States Renal Cancer Drug Industry Revenue (Million) Forecast, by Application 2020 & 2033
- Table 8: Canada Renal Cancer Drug Industry Revenue (Million) Forecast, by Application 2020 & 2033
- Table 9: Mexico Renal Cancer Drug Industry Revenue (Million) Forecast, by Application 2020 & 2033
- Table 10: Global Renal Cancer Drug Industry Revenue Million Forecast, by Cancer Type 2020 & 2033
- Table 11: Global Renal Cancer Drug Industry Revenue Million Forecast, by Component 2020 & 2033
- Table 12: Global Renal Cancer Drug Industry Revenue Million Forecast, by Country 2020 & 2033
- Table 13: Germany Renal Cancer Drug Industry Revenue (Million) Forecast, by Application 2020 & 2033
- Table 14: United Kingdom Renal Cancer Drug Industry Revenue (Million) Forecast, by Application 2020 & 2033
- Table 15: France Renal Cancer Drug Industry Revenue (Million) Forecast, by Application 2020 & 2033
- Table 16: Italy Renal Cancer Drug Industry Revenue (Million) Forecast, by Application 2020 & 2033
- Table 17: Spain Renal Cancer Drug Industry Revenue (Million) Forecast, by Application 2020 & 2033
- Table 18: Rest of Europe Renal Cancer Drug Industry Revenue (Million) Forecast, by Application 2020 & 2033
- Table 19: Global Renal Cancer Drug Industry Revenue Million Forecast, by Cancer Type 2020 & 2033
- Table 20: Global Renal Cancer Drug Industry Revenue Million Forecast, by Component 2020 & 2033
- Table 21: Global Renal Cancer Drug Industry Revenue Million Forecast, by Country 2020 & 2033
- Table 22: China Renal Cancer Drug Industry Revenue (Million) Forecast, by Application 2020 & 2033
- Table 23: Japan Renal Cancer Drug Industry Revenue (Million) Forecast, by Application 2020 & 2033
- Table 24: India Renal Cancer Drug Industry Revenue (Million) Forecast, by Application 2020 & 2033
- Table 25: Australia Renal Cancer Drug Industry Revenue (Million) Forecast, by Application 2020 & 2033
- Table 26: South Korea Renal Cancer Drug Industry Revenue (Million) Forecast, by Application 2020 & 2033
- Table 27: Rest of Asia Pacific Renal Cancer Drug Industry Revenue (Million) Forecast, by Application 2020 & 2033
- Table 28: Global Renal Cancer Drug Industry Revenue Million Forecast, by Cancer Type 2020 & 2033
- Table 29: Global Renal Cancer Drug Industry Revenue Million Forecast, by Component 2020 & 2033
- Table 30: Global Renal Cancer Drug Industry Revenue Million Forecast, by Country 2020 & 2033
- Table 31: GCC Renal Cancer Drug Industry Revenue (Million) Forecast, by Application 2020 & 2033
- Table 32: South Africa Renal Cancer Drug Industry Revenue (Million) Forecast, by Application 2020 & 2033
- Table 33: Rest of Middle East and Africa Renal Cancer Drug Industry Revenue (Million) Forecast, by Application 2020 & 2033
- Table 34: Global Renal Cancer Drug Industry Revenue Million Forecast, by Cancer Type 2020 & 2033
- Table 35: Global Renal Cancer Drug Industry Revenue Million Forecast, by Component 2020 & 2033
- Table 36: Global Renal Cancer Drug Industry Revenue Million Forecast, by Country 2020 & 2033
- Table 37: Brazil Renal Cancer Drug Industry Revenue (Million) Forecast, by Application 2020 & 2033
- Table 38: Argentina Renal Cancer Drug Industry Revenue (Million) Forecast, by Application 2020 & 2033
- Table 39: Rest of South America Renal Cancer Drug Industry Revenue (Million) Forecast, by Application 2020 & 2033
Frequently Asked Questions
1. What is the projected Compound Annual Growth Rate (CAGR) of the Renal Cancer Drug Industry?
The projected CAGR is approximately 4.86%.
2. Which companies are prominent players in the Renal Cancer Drug Industry?
Key companies in the market include Bayer AG, Amgen Inc, Novartis International AG, Abbott Laboratories, Bristol-Myers Squibb, Merck KGaA (EMD Serono), Seattle Genetic*List Not Exhaustive, F Hoffmann-La Roche, Pfizer Inc.
3. What are the main segments of the Renal Cancer Drug Industry?
The market segments include Cancer Type, Component.
4. Can you provide details about the market size?
The market size is estimated to be USD 6.92 Million as of 2022.
5. What are some drivers contributing to market growth?
Increasing Prevalence of Kidney Cancer; Increased R&D Expenditure of Pharmaceutical Companies.
6. What are the notable trends driving market growth?
Clear Cell RCC is Expected Witness a Growth in the Kidney Cancer Therapeutics and Diagnostics Market Over the Forecast Period.
7. Are there any restraints impacting market growth?
High Cost Associated with Treatment; Low Success Rate in Clinical Trials for Cancer Drugs.
8. Can you provide examples of recent developments in the market?
In October 2022, Health Canada approved KEYTRUDA (pembrolizumab) as monotherapy for the adjuvant treatment of adults with renal cell carcinoma (RCC) at intermediate-high or high risk of recurrence following nephrectomy or following nephrectomy and resection of metastatic lesions.
9. What pricing options are available for accessing the report?
Pricing options include single-user, multi-user, and enterprise licenses priced at USD 4750, USD 5250, and USD 8750 respectively.
10. Is the market size provided in terms of value or volume?
The market size is provided in terms of value, measured in Million.
11. Are there any specific market keywords associated with the report?
Yes, the market keyword associated with the report is "Renal Cancer Drug Industry," which aids in identifying and referencing the specific market segment covered.
12. How do I determine which pricing option suits my needs best?
The pricing options vary based on user requirements and access needs. Individual users may opt for single-user licenses, while businesses requiring broader access may choose multi-user or enterprise licenses for cost-effective access to the report.
13. Are there any additional resources or data provided in the Renal Cancer Drug Industry report?
While the report offers comprehensive insights, it's advisable to review the specific contents or supplementary materials provided to ascertain if additional resources or data are available.
14. How can I stay updated on further developments or reports in the Renal Cancer Drug Industry?
To stay informed about further developments, trends, and reports in the Renal Cancer Drug Industry, consider subscribing to industry newsletters, following relevant companies and organizations, or regularly checking reputable industry news sources and publications.
Methodology
Step 1 - Identification of Relevant Samples Size from Population Database


Step 2 - Approaches for Defining Global Market Size (Value, Volume* & Price*)

Note*: In applicable scenarios
Step 3 - Data Sources
Primary Research
- Web Analytics
- Survey Reports
- Research Institute
- Latest Research Reports
- Opinion Leaders
Secondary Research
- Annual Reports
- White Paper
- Latest Press Release
- Industry Association
- Paid Database
- Investor Presentations

Step 4 - Data Triangulation
Involves using different sources of information in order to increase the validity of a study
These sources are likely to be stakeholders in a program - participants, other researchers, program staff, other community members, and so on.
Then we put all data in single framework & apply various statistical tools to find out the dynamic on the market.
During the analysis stage, feedback from the stakeholder groups would be compared to determine areas of agreement as well as areas of divergence