Key Insights
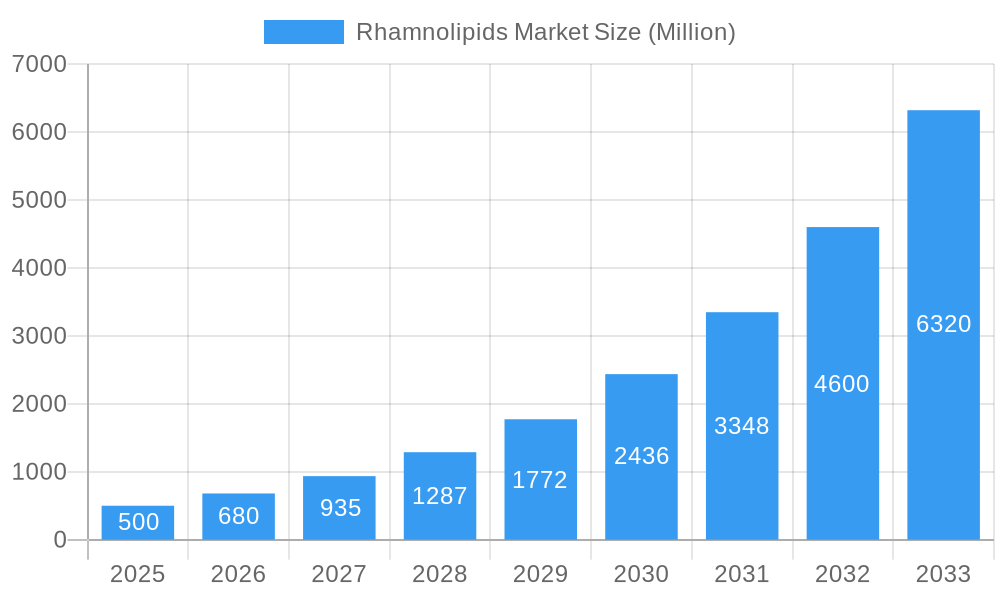
The global rhamnolipids market is poised for significant expansion, projected to reach $7.52 billion by 2033, driven by a remarkable Compound Annual Growth Rate (CAGR) of 15.09% from a $500 million base in 2025. This robust growth is propelled by increasing demand across key sectors including surfactants, cosmetics, agriculture, food, and pharmaceuticals. Growing global awareness of rhamnolipids' biodegradability and eco-friendly attributes, alongside stricter regulations on synthetic surfactants, are primary market catalysts. The adoption of sustainable practices across industries further bolsters this upward trend. Market segmentation highlights the prominence of mono- and di-rhamnolipids, with surfactants currently leading applications. Future growth is anticipated from the expanding use in cosmetics and agriculture, driven by the demand for natural and effective ingredients.
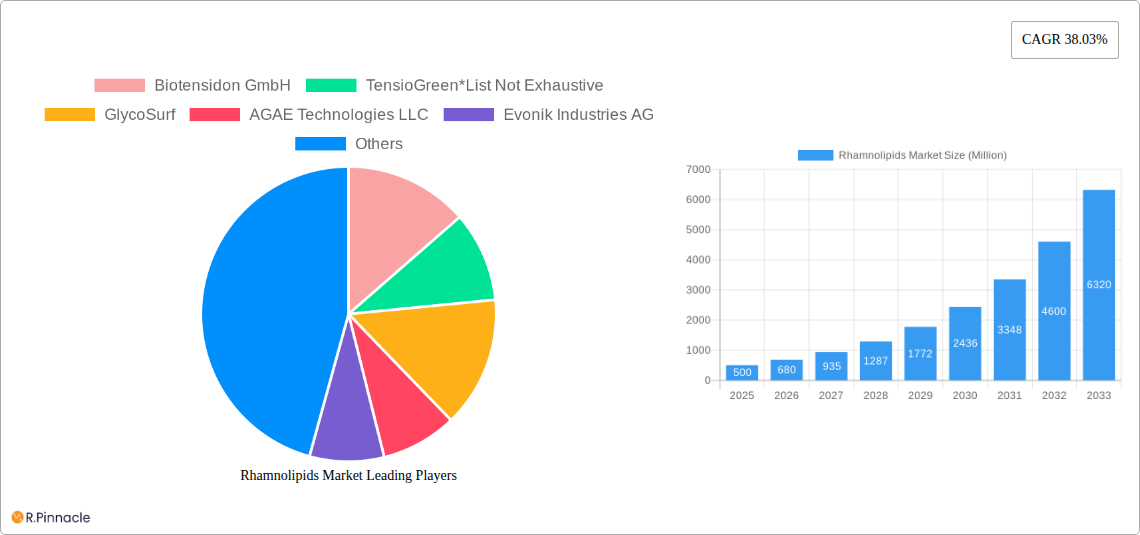
Rhamnolipids Market Market Size (In Billion)
Competitive analysis identifies key market participants such as Biotensidon GmbH, TensioGreen, GlycoSurf, AGAE Technologies LLC, Evonik Industries AG, Stepan Company, Jeneil Biotech, and DEGUAN Biosurfactant Supplier, indicating a dynamic and innovative market landscape. Geographically, North America, Europe, and Asia-Pacific are the leading markets, expected to continue driving expansion. While challenges such as production costs and scalability persist, ongoing research and development focused on cost reduction and efficiency improvements are vital for unlocking the market's substantial future potential.
Rhamnolipids Market Company Market Share
Rhamnolipids Market: A Comprehensive Report (2019-2033)
This in-depth report provides a comprehensive analysis of the global Rhamnolipids Market, offering invaluable insights for industry professionals, investors, and researchers. Covering the period from 2019 to 2033, with a focus on 2025, this study meticulously examines market dynamics, segmentation, key players, and future growth prospects. The report leverages detailed data and expert analysis to offer actionable intelligence, enabling informed decision-making within the rapidly evolving biosurfactant landscape.
Rhamnolipids Market Structure & Innovation Trends
The Rhamnolipids market exhibits a moderately consolidated structure, with key players like Evonik Industries AG, Stepan Company, and AGAE Technologies LLC holding significant market share. However, the market also features several smaller, specialized companies such as Biotensidon GmbH, TensioGreen, GlycoSurf, Jeneil Biotech, and DEGUAN Biosurfactant Supplier, contributing to its competitive landscape. Innovation is driven by the need for sustainable and biodegradable alternatives to traditional surfactants, coupled with advancements in fermentation technologies leading to increased yields and reduced production costs. Regulatory frameworks, particularly those concerning bio-based products and environmental regulations, significantly influence market growth. Product substitutes include other biosurfactants and chemically synthesized surfactants, posing varying levels of competitive pressure. The end-user demographics are diverse, spanning various industries, including cosmetics, agriculture, and pharmaceuticals. M&A activity has been moderate, with some significant investments driving expansion (e.g., Evonik's recent investment in a new production plant). Deal values vary widely depending on company size and strategic goals. For example, while specific M&A deal values are not publicly available for all transactions, Evonik's investment was in the three-digit million-euro range. Market share data is available within the full report.
Rhamnolipids Market Dynamics & Trends
The Rhamnolipids market is experiencing robust growth, driven by increasing demand for sustainable and eco-friendly alternatives to conventional chemical surfactants. The CAGR for the forecast period (2025-2033) is projected to be xx%. Technological advancements in fermentation processes, as showcased by AGAE Technologies' recent breakthrough, are significantly reducing production costs and enhancing yields, thereby boosting market accessibility. Consumer preferences are increasingly shifting towards natural and biodegradable products, further fueling market expansion. Market penetration is highest in the surfactant application segment, but significant growth opportunities exist in other sectors, such as cosmetics and pharmaceuticals. Competitive dynamics are shaped by both established players leveraging their existing infrastructure and emerging companies introducing innovative production methods and product formulations. The market’s growth is further fueled by supportive government policies promoting sustainable solutions and increasing awareness regarding environmental concerns. The growing demand for bio-based products in various industries fuels this market’s expansion, as does the rise in environmentally conscious consumers.
Dominant Regions & Segments in Rhamnolipids Market
While global market dominance is currently shared across regions, North America and Europe are leading the adoption of rhamnolipids due to stringent environmental regulations and greater awareness among consumers. Specific country-level analysis within these regions is contained in the full report.
Key Drivers for Dominant Regions:
- North America: Stringent environmental regulations, strong consumer demand for sustainable products, and significant investments in R&D.
- Europe: Similar to North America, with the added factor of robust government support for the development of bio-based industries.
Dominant Segments:
- Type: Di-rhamnolipids currently hold a larger market share compared to mono-rhamnolipids due to their superior surfactant properties.
- Application: The Surfactants segment dominates the market, driven by the broad applications of rhamnolipids in various industries. However, significant growth is anticipated in the cosmetics, agriculture, and pharmaceutical segments due to rising demand for natural and sustainable ingredients.
Rhamnolipids Market Product Innovations
Recent innovations focus on optimizing fermentation processes to enhance yield and reduce production costs. New product formulations are being developed to improve performance characteristics and expand application areas. Companies are focusing on developing high-performance rhamnolipids with specific functionalities tailored to meet the demands of various industries. This focus on improving both the production process and the final product is crucial for securing market competitiveness.
Report Scope & Segmentation Analysis
This report segments the Rhamnolipids market by Type (Mono-Rhamnolipids, Di-Rhamnolipids) and Application (Surfactants, Cosmetics, Agriculture, Food, Pharmaceutical, Other Applications). Each segment is analyzed based on market size, growth projections, and competitive dynamics. For example, the Di-Rhamnolipids segment shows a higher growth projection compared to the Mono-Rhamnolipids segment due to superior properties. Similarly, the Surfactants application segment is currently larger than others but the growth rate in the Cosmetics, Agriculture, and Pharmaceutical segments are faster. The full report contains detailed market size estimations and growth projections for each segment.
Key Drivers of Rhamnolipids Market Growth
The Rhamnolipids market is propelled by several key drivers: the growing demand for sustainable and biodegradable alternatives to chemical surfactants; increasing environmental awareness and stricter regulations; technological advancements in fermentation and production processes that improve yield and reduce costs; the expanding applications of rhamnolipids across various industries; and supportive government policies and incentives promoting the use of bio-based products.
Challenges in the Rhamnolipids Market Sector
The Rhamnolipids market faces challenges including the relatively high production costs compared to conventional surfactants; the need for further research and development to optimize the production processes and improve product performance; the fluctuating raw material prices; and competition from other biosurfactants and traditional chemical surfactants. These factors influence overall market penetration and growth rates.
Emerging Opportunities in Rhamnolipids Market
Emerging opportunities exist in the development of novel applications for rhamnolipids, such as in bioremediation and drug delivery systems. The exploration of new production platforms and feedstocks to reduce costs further and enhance sustainability will create additional market opportunities. Expanding into new geographic markets, particularly in developing economies with growing industrial sectors, presents substantial growth potential.
Leading Players in the Rhamnolipids Market Market
- Biotensidon GmbH
- TensioGreen
- GlycoSurf
- AGAE Technologies LLC
- Evonik Industries AG
- Stepan Company
- Jeneil Biotech
- DEGUAN Biosurfactant Supplier
Key Developments in Rhamnolipids Market Industry
- June 2022: Evonik Industries AG invested a three-digit million-euro sum for a new rhamnolipid production plant in Slovakia.
- September 2022: AGAE Technologies, LLC announced a significant breakthrough in rhamnolipid yield and cost reduction.
Future Outlook for Rhamnolipids Market Market
The future of the Rhamnolipids market is bright, driven by continued innovation in production technologies, expanding applications across diverse industries, and growing consumer preference for sustainable products. Strategic partnerships, further R&D investments, and expansion into new markets will play a vital role in shaping the market's future trajectory and unlocking its full potential. This robust growth is set to continue, with significant market expansion anticipated over the next decade.
Rhamnolipids Market Segmentation
-
1. Type
- 1.1. Mono-Rhamnolipids
- 1.2. Di-Rhamnolipids
-
2. Application
- 2.1. Surfactants
- 2.2. Cosmetics
- 2.3. Agriculture
- 2.4. Food
- 2.5. Pharmaceutical
- 2.6. Other Applications
Rhamnolipids Market Segmentation By Geography
- 1. Asia Pacific
- 2. North America
- 3. Europe
- 4. South America
- 5. Middle East and Africa
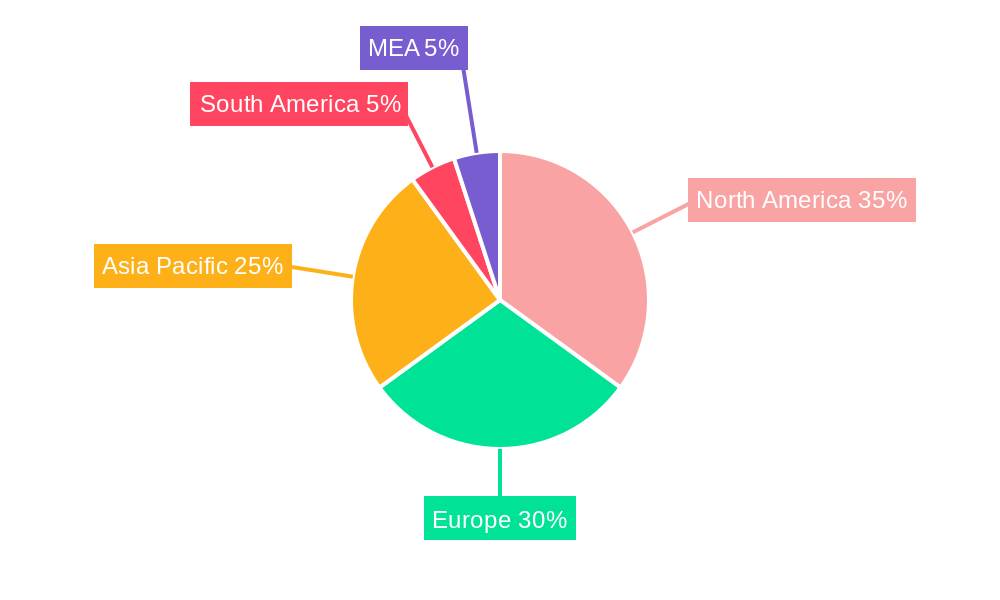
Rhamnolipids Market Regional Market Share
Geographic Coverage of Rhamnolipids Market
Rhamnolipids Market REPORT HIGHLIGHTS
| Aspects | Details |
|---|---|
| Study Period | 2020-2034 |
| Base Year | 2025 |
| Estimated Year | 2026 |
| Forecast Period | 2026-2034 |
| Historical Period | 2020-2025 |
| Growth Rate | CAGR of 15.09% from 2020-2034 |
| Segmentation |
|
Table of Contents
- 1. Introduction
- 1.1. Research Scope
- 1.2. Market Segmentation
- 1.3. Research Objective
- 1.4. Definitions and Assumptions
- 2. Executive Summary
- 2.1. Market Snapshot
- 3. Market Dynamics
- 3.1. Market Drivers
- 3.2. Market Restrains
- 3.3. Market Trends
- 3.4. Market Opportunities
- 4. Market Factor Analysis
- 4.1. Porters Five Forces
- 4.1.1. Bargaining Power of Suppliers
- 4.1.2. Bargaining Power of Buyers
- 4.1.3. Threat of New Entrants
- 4.1.4. Threat of Substitutes
- 4.1.5. Competitive Rivalry
- 4.2. PESTEL analysis
- 4.3. BCG Analysis
- 4.3.1. Stars (High Growth, High Market Share)
- 4.3.2. Cash Cows (Low Growth, High Market Share)
- 4.3.3. Question Mark (High Growth, Low Market Share)
- 4.3.4. Dogs (Low Growth, Low Market Share)
- 4.4. Ansoff Matrix Analysis
- 4.5. Supply Chain Analysis
- 4.6. Regulatory Landscape
- 4.7. Current Market Potential and Opportunity Assessment (TAM–SAM–SOM Framework)
- 4.8. PRI Analyst Note
- 4.1. Porters Five Forces
- 5. Market Analysis, Insights and Forecast 2021-2033
- 5.1. Market Analysis, Insights and Forecast - by Type
- 5.1.1. Mono-Rhamnolipids
- 5.1.2. Di-Rhamnolipids
- 5.2. Market Analysis, Insights and Forecast - by Application
- 5.2.1. Surfactants
- 5.2.2. Cosmetics
- 5.2.3. Agriculture
- 5.2.4. Food
- 5.2.5. Pharmaceutical
- 5.2.6. Other Applications
- 5.3. Market Analysis, Insights and Forecast - by Region
- 5.3.1. Asia Pacific
- 5.3.2. North America
- 5.3.3. Europe
- 5.3.4. South America
- 5.3.5. Middle East and Africa
- 5.1. Market Analysis, Insights and Forecast - by Type
- 6. Global Rhamnolipids Market Analysis, Insights and Forecast, 2021-2033
- 6.1. Market Analysis, Insights and Forecast - by Type
- 6.1.1. Mono-Rhamnolipids
- 6.1.2. Di-Rhamnolipids
- 6.2. Market Analysis, Insights and Forecast - by Application
- 6.2.1. Surfactants
- 6.2.2. Cosmetics
- 6.2.3. Agriculture
- 6.2.4. Food
- 6.2.5. Pharmaceutical
- 6.2.6. Other Applications
- 6.1. Market Analysis, Insights and Forecast - by Type
- 7. Asia Pacific Rhamnolipids Market Analysis, Insights and Forecast, 2020-2032
- 7.1. Market Analysis, Insights and Forecast - by Type
- 7.1.1. Mono-Rhamnolipids
- 7.1.2. Di-Rhamnolipids
- 7.2. Market Analysis, Insights and Forecast - by Application
- 7.2.1. Surfactants
- 7.2.2. Cosmetics
- 7.2.3. Agriculture
- 7.2.4. Food
- 7.2.5. Pharmaceutical
- 7.2.6. Other Applications
- 7.1. Market Analysis, Insights and Forecast - by Type
- 8. North America Rhamnolipids Market Analysis, Insights and Forecast, 2020-2032
- 8.1. Market Analysis, Insights and Forecast - by Type
- 8.1.1. Mono-Rhamnolipids
- 8.1.2. Di-Rhamnolipids
- 8.2. Market Analysis, Insights and Forecast - by Application
- 8.2.1. Surfactants
- 8.2.2. Cosmetics
- 8.2.3. Agriculture
- 8.2.4. Food
- 8.2.5. Pharmaceutical
- 8.2.6. Other Applications
- 8.1. Market Analysis, Insights and Forecast - by Type
- 9. Europe Rhamnolipids Market Analysis, Insights and Forecast, 2020-2032
- 9.1. Market Analysis, Insights and Forecast - by Type
- 9.1.1. Mono-Rhamnolipids
- 9.1.2. Di-Rhamnolipids
- 9.2. Market Analysis, Insights and Forecast - by Application
- 9.2.1. Surfactants
- 9.2.2. Cosmetics
- 9.2.3. Agriculture
- 9.2.4. Food
- 9.2.5. Pharmaceutical
- 9.2.6. Other Applications
- 9.1. Market Analysis, Insights and Forecast - by Type
- 10. South America Rhamnolipids Market Analysis, Insights and Forecast, 2020-2032
- 10.1. Market Analysis, Insights and Forecast - by Type
- 10.1.1. Mono-Rhamnolipids
- 10.1.2. Di-Rhamnolipids
- 10.2. Market Analysis, Insights and Forecast - by Application
- 10.2.1. Surfactants
- 10.2.2. Cosmetics
- 10.2.3. Agriculture
- 10.2.4. Food
- 10.2.5. Pharmaceutical
- 10.2.6. Other Applications
- 10.1. Market Analysis, Insights and Forecast - by Type
- 11. Middle East and Africa Rhamnolipids Market Analysis, Insights and Forecast, 2020-2032
- 11.1. Market Analysis, Insights and Forecast - by Type
- 11.1.1. Mono-Rhamnolipids
- 11.1.2. Di-Rhamnolipids
- 11.2. Market Analysis, Insights and Forecast - by Application
- 11.2.1. Surfactants
- 11.2.2. Cosmetics
- 11.2.3. Agriculture
- 11.2.4. Food
- 11.2.5. Pharmaceutical
- 11.2.6. Other Applications
- 11.1. Market Analysis, Insights and Forecast - by Type
- 12. Competitive Analysis
- 12.1. Company Profiles
- 12.1.1 Biotensidon GmbH
- 12.1.1.1. Company Overview
- 12.1.1.2. Products
- 12.1.1.3. Company Financials
- 12.1.1.4. SWOT Analysis
- 12.1.2 TensioGreen*List Not Exhaustive
- 12.1.2.1. Company Overview
- 12.1.2.2. Products
- 12.1.2.3. Company Financials
- 12.1.2.4. SWOT Analysis
- 12.1.3 GlycoSurf
- 12.1.3.1. Company Overview
- 12.1.3.2. Products
- 12.1.3.3. Company Financials
- 12.1.3.4. SWOT Analysis
- 12.1.4 AGAE Technologies LLC
- 12.1.4.1. Company Overview
- 12.1.4.2. Products
- 12.1.4.3. Company Financials
- 12.1.4.4. SWOT Analysis
- 12.1.5 Evonik Industries AG
- 12.1.5.1. Company Overview
- 12.1.5.2. Products
- 12.1.5.3. Company Financials
- 12.1.5.4. SWOT Analysis
- 12.1.6 Stepan Company
- 12.1.6.1. Company Overview
- 12.1.6.2. Products
- 12.1.6.3. Company Financials
- 12.1.6.4. SWOT Analysis
- 12.1.7 Jeneil Biotech
- 12.1.7.1. Company Overview
- 12.1.7.2. Products
- 12.1.7.3. Company Financials
- 12.1.7.4. SWOT Analysis
- 12.1.8 DEGUAN Biosurfactant Supplier
- 12.1.8.1. Company Overview
- 12.1.8.2. Products
- 12.1.8.3. Company Financials
- 12.1.8.4. SWOT Analysis
- 12.1.1 Biotensidon GmbH
- 12.2. Market Entropy
- 12.2.1 Company's Key Areas Served
- 12.2.2 Recent Developments
- 12.3. Company Market Share Analysis 2025
- 12.3.1 Top 5 Companies Market Share Analysis
- 12.3.2 Top 3 Companies Market Share Analysis
- 12.4. List of Potential Customers
- 13. Research Methodology
List of Figures
- Figure 1: Global Rhamnolipids Market Revenue Breakdown (billion, %) by Region 2025 & 2033
- Figure 2: Global Rhamnolipids Market Volume Breakdown (Million, %) by Region 2025 & 2033
- Figure 3: Asia Pacific Rhamnolipids Market Revenue (billion), by Type 2025 & 2033
- Figure 4: Asia Pacific Rhamnolipids Market Volume (Million), by Type 2025 & 2033
- Figure 5: Asia Pacific Rhamnolipids Market Revenue Share (%), by Type 2025 & 2033
- Figure 6: Asia Pacific Rhamnolipids Market Volume Share (%), by Type 2025 & 2033
- Figure 7: Asia Pacific Rhamnolipids Market Revenue (billion), by Application 2025 & 2033
- Figure 8: Asia Pacific Rhamnolipids Market Volume (Million), by Application 2025 & 2033
- Figure 9: Asia Pacific Rhamnolipids Market Revenue Share (%), by Application 2025 & 2033
- Figure 10: Asia Pacific Rhamnolipids Market Volume Share (%), by Application 2025 & 2033
- Figure 11: Asia Pacific Rhamnolipids Market Revenue (billion), by Country 2025 & 2033
- Figure 12: Asia Pacific Rhamnolipids Market Volume (Million), by Country 2025 & 2033
- Figure 13: Asia Pacific Rhamnolipids Market Revenue Share (%), by Country 2025 & 2033
- Figure 14: Asia Pacific Rhamnolipids Market Volume Share (%), by Country 2025 & 2033
- Figure 15: North America Rhamnolipids Market Revenue (billion), by Type 2025 & 2033
- Figure 16: North America Rhamnolipids Market Volume (Million), by Type 2025 & 2033
- Figure 17: North America Rhamnolipids Market Revenue Share (%), by Type 2025 & 2033
- Figure 18: North America Rhamnolipids Market Volume Share (%), by Type 2025 & 2033
- Figure 19: North America Rhamnolipids Market Revenue (billion), by Application 2025 & 2033
- Figure 20: North America Rhamnolipids Market Volume (Million), by Application 2025 & 2033
- Figure 21: North America Rhamnolipids Market Revenue Share (%), by Application 2025 & 2033
- Figure 22: North America Rhamnolipids Market Volume Share (%), by Application 2025 & 2033
- Figure 23: North America Rhamnolipids Market Revenue (billion), by Country 2025 & 2033
- Figure 24: North America Rhamnolipids Market Volume (Million), by Country 2025 & 2033
- Figure 25: North America Rhamnolipids Market Revenue Share (%), by Country 2025 & 2033
- Figure 26: North America Rhamnolipids Market Volume Share (%), by Country 2025 & 2033
- Figure 27: Europe Rhamnolipids Market Revenue (billion), by Type 2025 & 2033
- Figure 28: Europe Rhamnolipids Market Volume (Million), by Type 2025 & 2033
- Figure 29: Europe Rhamnolipids Market Revenue Share (%), by Type 2025 & 2033
- Figure 30: Europe Rhamnolipids Market Volume Share (%), by Type 2025 & 2033
- Figure 31: Europe Rhamnolipids Market Revenue (billion), by Application 2025 & 2033
- Figure 32: Europe Rhamnolipids Market Volume (Million), by Application 2025 & 2033
- Figure 33: Europe Rhamnolipids Market Revenue Share (%), by Application 2025 & 2033
- Figure 34: Europe Rhamnolipids Market Volume Share (%), by Application 2025 & 2033
- Figure 35: Europe Rhamnolipids Market Revenue (billion), by Country 2025 & 2033
- Figure 36: Europe Rhamnolipids Market Volume (Million), by Country 2025 & 2033
- Figure 37: Europe Rhamnolipids Market Revenue Share (%), by Country 2025 & 2033
- Figure 38: Europe Rhamnolipids Market Volume Share (%), by Country 2025 & 2033
- Figure 39: South America Rhamnolipids Market Revenue (billion), by Type 2025 & 2033
- Figure 40: South America Rhamnolipids Market Volume (Million), by Type 2025 & 2033
- Figure 41: South America Rhamnolipids Market Revenue Share (%), by Type 2025 & 2033
- Figure 42: South America Rhamnolipids Market Volume Share (%), by Type 2025 & 2033
- Figure 43: South America Rhamnolipids Market Revenue (billion), by Application 2025 & 2033
- Figure 44: South America Rhamnolipids Market Volume (Million), by Application 2025 & 2033
- Figure 45: South America Rhamnolipids Market Revenue Share (%), by Application 2025 & 2033
- Figure 46: South America Rhamnolipids Market Volume Share (%), by Application 2025 & 2033
- Figure 47: South America Rhamnolipids Market Revenue (billion), by Country 2025 & 2033
- Figure 48: South America Rhamnolipids Market Volume (Million), by Country 2025 & 2033
- Figure 49: South America Rhamnolipids Market Revenue Share (%), by Country 2025 & 2033
- Figure 50: South America Rhamnolipids Market Volume Share (%), by Country 2025 & 2033
- Figure 51: Middle East and Africa Rhamnolipids Market Revenue (billion), by Type 2025 & 2033
- Figure 52: Middle East and Africa Rhamnolipids Market Volume (Million), by Type 2025 & 2033
- Figure 53: Middle East and Africa Rhamnolipids Market Revenue Share (%), by Type 2025 & 2033
- Figure 54: Middle East and Africa Rhamnolipids Market Volume Share (%), by Type 2025 & 2033
- Figure 55: Middle East and Africa Rhamnolipids Market Revenue (billion), by Application 2025 & 2033
- Figure 56: Middle East and Africa Rhamnolipids Market Volume (Million), by Application 2025 & 2033
- Figure 57: Middle East and Africa Rhamnolipids Market Revenue Share (%), by Application 2025 & 2033
- Figure 58: Middle East and Africa Rhamnolipids Market Volume Share (%), by Application 2025 & 2033
- Figure 59: Middle East and Africa Rhamnolipids Market Revenue (billion), by Country 2025 & 2033
- Figure 60: Middle East and Africa Rhamnolipids Market Volume (Million), by Country 2025 & 2033
- Figure 61: Middle East and Africa Rhamnolipids Market Revenue Share (%), by Country 2025 & 2033
- Figure 62: Middle East and Africa Rhamnolipids Market Volume Share (%), by Country 2025 & 2033
List of Tables
- Table 1: Global Rhamnolipids Market Revenue billion Forecast, by Type 2020 & 2033
- Table 2: Global Rhamnolipids Market Volume Million Forecast, by Type 2020 & 2033
- Table 3: Global Rhamnolipids Market Revenue billion Forecast, by Application 2020 & 2033
- Table 4: Global Rhamnolipids Market Volume Million Forecast, by Application 2020 & 2033
- Table 5: Global Rhamnolipids Market Revenue billion Forecast, by Region 2020 & 2033
- Table 6: Global Rhamnolipids Market Volume Million Forecast, by Region 2020 & 2033
- Table 7: Global Rhamnolipids Market Revenue billion Forecast, by Type 2020 & 2033
- Table 8: Global Rhamnolipids Market Volume Million Forecast, by Type 2020 & 2033
- Table 9: Global Rhamnolipids Market Revenue billion Forecast, by Application 2020 & 2033
- Table 10: Global Rhamnolipids Market Volume Million Forecast, by Application 2020 & 2033
- Table 11: Global Rhamnolipids Market Revenue billion Forecast, by Country 2020 & 2033
- Table 12: Global Rhamnolipids Market Volume Million Forecast, by Country 2020 & 2033
- Table 13: Global Rhamnolipids Market Revenue billion Forecast, by Type 2020 & 2033
- Table 14: Global Rhamnolipids Market Volume Million Forecast, by Type 2020 & 2033
- Table 15: Global Rhamnolipids Market Revenue billion Forecast, by Application 2020 & 2033
- Table 16: Global Rhamnolipids Market Volume Million Forecast, by Application 2020 & 2033
- Table 17: Global Rhamnolipids Market Revenue billion Forecast, by Country 2020 & 2033
- Table 18: Global Rhamnolipids Market Volume Million Forecast, by Country 2020 & 2033
- Table 19: Global Rhamnolipids Market Revenue billion Forecast, by Type 2020 & 2033
- Table 20: Global Rhamnolipids Market Volume Million Forecast, by Type 2020 & 2033
- Table 21: Global Rhamnolipids Market Revenue billion Forecast, by Application 2020 & 2033
- Table 22: Global Rhamnolipids Market Volume Million Forecast, by Application 2020 & 2033
- Table 23: Global Rhamnolipids Market Revenue billion Forecast, by Country 2020 & 2033
- Table 24: Global Rhamnolipids Market Volume Million Forecast, by Country 2020 & 2033
- Table 25: Global Rhamnolipids Market Revenue billion Forecast, by Type 2020 & 2033
- Table 26: Global Rhamnolipids Market Volume Million Forecast, by Type 2020 & 2033
- Table 27: Global Rhamnolipids Market Revenue billion Forecast, by Application 2020 & 2033
- Table 28: Global Rhamnolipids Market Volume Million Forecast, by Application 2020 & 2033
- Table 29: Global Rhamnolipids Market Revenue billion Forecast, by Country 2020 & 2033
- Table 30: Global Rhamnolipids Market Volume Million Forecast, by Country 2020 & 2033
- Table 31: Global Rhamnolipids Market Revenue billion Forecast, by Type 2020 & 2033
- Table 32: Global Rhamnolipids Market Volume Million Forecast, by Type 2020 & 2033
- Table 33: Global Rhamnolipids Market Revenue billion Forecast, by Application 2020 & 2033
- Table 34: Global Rhamnolipids Market Volume Million Forecast, by Application 2020 & 2033
- Table 35: Global Rhamnolipids Market Revenue billion Forecast, by Country 2020 & 2033
- Table 36: Global Rhamnolipids Market Volume Million Forecast, by Country 2020 & 2033
Frequently Asked Questions
1. What is the projected Compound Annual Growth Rate (CAGR) of the Rhamnolipids Market?
The projected CAGR is approximately 15.09%.
2. Which companies are prominent players in the Rhamnolipids Market?
Key companies in the market include Biotensidon GmbH, TensioGreen*List Not Exhaustive, GlycoSurf, AGAE Technologies LLC, Evonik Industries AG, Stepan Company, Jeneil Biotech, DEGUAN Biosurfactant Supplier.
3. What are the main segments of the Rhamnolipids Market?
The market segments include Type, Application.
4. Can you provide details about the market size?
The market size is estimated to be USD 7.52 billion as of 2022.
5. What are some drivers contributing to market growth?
Emergence of Eco-friendly Surfactant; Increasing Demand For Personal Care Products.
6. What are the notable trends driving market growth?
Growing Demand of Rhamnolipids from Surfactants.
7. Are there any restraints impacting market growth?
Limitation in the Production of Rhamnolipids on an Industrial Scale.
8. Can you provide examples of recent developments in the market?
September 2022: AGAE Technologies, LLC announced the discovery of employing certain strains and mediums under optimized fermentation conditions to obtain record-high rhamnolipid yields at the lowest possible cost. When compared to traditionally optimized fermentation settings, the fermentation methods enhanced yields by approximately 200% while lowering production costs to about one-third of the conventionally optimized conditions.
9. What pricing options are available for accessing the report?
Pricing options include single-user, multi-user, and enterprise licenses priced at USD 4750, USD 5250, and USD 8750 respectively.
10. Is the market size provided in terms of value or volume?
The market size is provided in terms of value, measured in billion and volume, measured in Million.
11. Are there any specific market keywords associated with the report?
Yes, the market keyword associated with the report is "Rhamnolipids Market," which aids in identifying and referencing the specific market segment covered.
12. How do I determine which pricing option suits my needs best?
The pricing options vary based on user requirements and access needs. Individual users may opt for single-user licenses, while businesses requiring broader access may choose multi-user or enterprise licenses for cost-effective access to the report.
13. Are there any additional resources or data provided in the Rhamnolipids Market report?
While the report offers comprehensive insights, it's advisable to review the specific contents or supplementary materials provided to ascertain if additional resources or data are available.
14. How can I stay updated on further developments or reports in the Rhamnolipids Market?
To stay informed about further developments, trends, and reports in the Rhamnolipids Market, consider subscribing to industry newsletters, following relevant companies and organizations, or regularly checking reputable industry news sources and publications.
Methodology
Step 1 - Identification of Relevant Samples Size from Population Database


Step 2 - Approaches for Defining Global Market Size (Value, Volume* & Price*)

Note*: In applicable scenarios
Step 3 - Data Sources
Primary Research
- Web Analytics
- Survey Reports
- Research Institute
- Latest Research Reports
- Opinion Leaders
Secondary Research
- Annual Reports
- White Paper
- Latest Press Release
- Industry Association
- Paid Database
- Investor Presentations

Step 4 - Data Triangulation
Involves using different sources of information in order to increase the validity of a study
These sources are likely to be stakeholders in a program - participants, other researchers, program staff, other community members, and so on.
Then we put all data in single framework & apply various statistical tools to find out the dynamic on the market.
During the analysis stage, feedback from the stakeholder groups would be compared to determine areas of agreement as well as areas of divergence

