

Key Insights
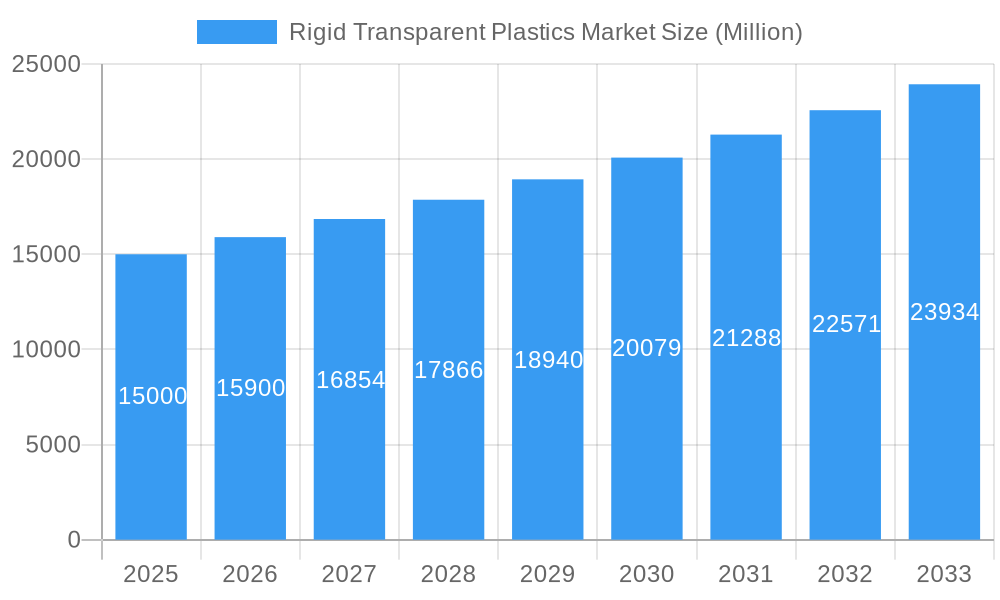
The global rigid transparent plastics market, valued at $6.17 billion in 2025, is projected to expand at a robust Compound Annual Growth Rate (CAGR) of 16.44% through 2033. This growth is propelled by escalating demand across key sectors: packaging (food, consumer goods), healthcare (medical devices, pharmaceuticals), electrical & electronics (lighting, displays), automotive (lighting, interiors), and building & construction (glazing, signage). The intrinsic properties of rigid transparent plastics—exceptional clarity, durability, and lightweight characteristics—underpin their widespread application. Innovations enhancing impact resistance and UV stability further stimulate market expansion. Dominant polymers include polycarbonate (PC), polyvinyl chloride (PVC), and polystyrene (PS), with a growing trend towards sustainable bio-based alternatives.
Rigid Transparent Plastics Market Market Size (In Billion)
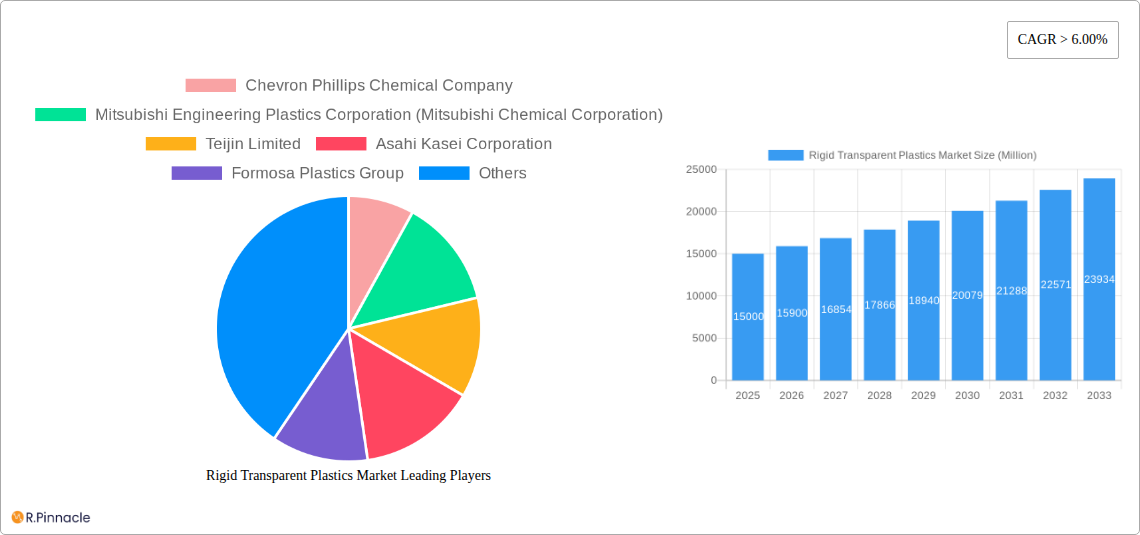
Challenges such as plastic waste management and raw material price volatility exist, yet the market's outlook remains positive. Geographical expansion in emerging economies, particularly in Asia-Pacific and South America, is a significant growth driver. Key market participants like Chevron Phillips Chemical Company, Mitsubishi Engineering Plastics Corporation, and Teijin Limited are focused on innovation and strategic alliances. While North America and Europe hold substantial market share, the Asia-Pacific region is anticipated for rapid expansion due to industrialization and rising consumer demand. Future market dynamics will be shaped by evolving consumer preferences for sustainable plastics, evolving regulations on plastic waste, and continuous advancements in polymer technology.
Rigid Transparent Plastics Market Company Market Share
Rigid Transparent Plastics Market: A Comprehensive Market Analysis Report (2019-2033)
This in-depth report provides a comprehensive analysis of the Rigid Transparent Plastics market, offering actionable insights for industry professionals and strategic decision-makers. The study covers the period from 2019 to 2033, with a focus on the forecast period of 2025-2033 and a base year of 2025. The report segments the market by end-user industry (Packaging, Healthcare, Electrical and Electronics, Automotive, Buildings and Construction, Other End-user Industries) and polymer type (Polycarbonate (PC), Polyvinyl Chloride (PVC), Polystyrene (PS), Acrylonitrile Butadiene Styrene (ABS) & Styrene Acrylonitrile (SAN), Polypropylene (PP), Polymethyl Methacrylate (PMMA), Styrene Block Copolymers (SBC), Other Polymer Types), providing granular market sizing and growth projections in Millions. Key players like Chevron Phillips Chemical Company, Mitsubishi Chemical Corporation, and others are profiled, highlighting their market strategies and competitive landscape.
Rigid Transparent Plastics Market Market Structure & Innovation Trends
This section analyzes the competitive landscape of the Rigid Transparent Plastics market, examining market concentration, innovation drivers, regulatory influences, and key industry activities. The market is moderately consolidated, with the top 10 players holding an estimated xx% market share in 2025. Innovation is driven by the need for lightweight, high-strength materials with improved optical properties, leading to significant R&D investment. Regulatory frameworks, such as those related to environmental sustainability and material safety, significantly impact the market. Product substitutes, including alternative packaging materials and bioplastics, pose a growing challenge. M&A activity has been relatively moderate in recent years, with a total deal value of approximately $xx Million between 2019 and 2024.
- Market Concentration: High, with top players holding significant market share.
- Innovation Drivers: Lightweighting, improved optical clarity, enhanced durability.
- Regulatory Landscape: Stringent environmental regulations drive the adoption of sustainable materials.
- Product Substitutes: Growth of bioplastics and alternative packaging materials.
- M&A Activity: Moderate activity, with total deal value estimated at $xx Million (2019-2024).
Rigid Transparent Plastics Market Market Dynamics & Trends
The Rigid Transparent Plastics market is experiencing robust growth, driven by increasing demand across various end-use sectors. The Compound Annual Growth Rate (CAGR) is projected to be xx% during the forecast period (2025-2033). Key growth drivers include the rising demand for lightweight and durable materials in the automotive and packaging industries, the expanding healthcare sector requiring transparent medical devices, and technological advancements leading to improved material properties. However, fluctuating raw material prices and environmental concerns pose challenges. The market penetration of specific polymer types varies significantly, with PC and PVC dominating certain applications. Consumer preferences for sustainable and recyclable packaging are also shaping market trends. Competitive dynamics are intense, with companies focusing on innovation, cost optimization, and strategic partnerships.
Dominant Regions & Segments in Rigid Transparent Plastics Market
The Asia-Pacific region is currently the dominant market for rigid transparent plastics, driven by robust economic growth, increasing industrialization, and a burgeoning consumer goods market. Within this region, China and India are key growth drivers.
- Leading End-User Industry: Packaging holds the largest market share, driven by the increasing demand for transparent packaging in the food and beverage industry.
- Leading Polymer Type: Polycarbonate (PC) and Polyvinyl Chloride (PVC) dominate the market due to their excellent optical properties, strength, and cost-effectiveness.
- Key Regional Drivers: Strong economic growth, rapid industrialization, and rising consumer spending in Asia-Pacific.
- Country-Specific Factors: China's vast manufacturing base and India's growing consumer market are major contributors to regional growth.
Detailed analysis of each segment, including market size and growth projections, is provided in subsequent sections.
Rigid Transparent Plastics Market Product Innovations
Recent innovations focus on enhancing material properties such as impact resistance, scratch resistance, and UV stability. New formulations offer improved transparency and clarity, enabling broader applications. These advancements are driven by the increasing demand for high-performance materials across diverse sectors such as automotive, healthcare, and electronics. The market is witnessing the introduction of bio-based and recycled rigid transparent plastics, catering to sustainability concerns.
Report Scope & Segmentation Analysis
This report provides a detailed segmentation of the Rigid Transparent Plastics market by both end-user industry and polymer type, covering the historical period (2019-2024), the base year (2025), and the forecast period (2025-2033). Each segment's market size, growth projections, and competitive landscape are analyzed in detail. The report highlights the key drivers and challenges influencing the growth of each segment, providing a comprehensive understanding of the market dynamics.
Key Drivers of Rigid Transparent Plastics Market Growth
Several factors contribute to the market's growth. The increasing demand for lightweight and durable materials in the automotive industry is a significant driver. Technological advancements, leading to improved material properties and processing techniques, also contribute to market expansion. Furthermore, the growing consumer preference for transparent packaging and the rise of the healthcare sector are pushing market growth.
Challenges in the Rigid Transparent Plastics Market Sector
The market faces challenges such as fluctuating raw material prices and environmental concerns related to plastic waste. Supply chain disruptions can also impact market stability. Intense competition from alternative materials and evolving regulatory landscapes pose further challenges.
Emerging Opportunities in Rigid Transparent Plastics Market
Emerging trends include the development of sustainable and biodegradable rigid transparent plastics, driven by growing environmental concerns. New applications in areas such as advanced electronics and medical devices offer further opportunities. The development of high-performance materials with enhanced properties creates exciting opportunities for market expansion.
Leading Players in the Rigid Transparent Plastics Market Market
- Chevron Phillips Chemical Company
- Mitsubishi Engineering Plastics Corporation (Mitsubishi Chemical Corporation)
- Teijin Limited
- Asahi Kasei Corporation
- Formosa Plastics Group
- Ineos Chlorvinyls Ltd
- Solvay
- Westlake Chemical Corporation
- Shin-Etsu Chemical Co Limited
- Evonik Industries AG
- Lotte Chemical Corporation
- Ashland
- BASF SE
- Arkema Group
- Samyang
- SABIC
- Huntsman Corp
- Trinseo
- DSM
- LG Chem
- DuPont
- Idemitsu Kosan
- Chi Mei Corp
- Covestro AG
- Lanxess
Key Developments in Rigid Transparent Plastics Market Industry
- January 2023: Company X launched a new high-performance polycarbonate resin with enhanced UV resistance.
- June 2022: Company Y announced a strategic partnership to develop sustainable packaging solutions using recycled materials.
- (Add further bullet points with specific year/month and impactful development details.)
Future Outlook for Rigid Transparent Plastics Market Market
The Rigid Transparent Plastics market is poised for continued growth, driven by technological advancements and expanding applications across diverse end-use sectors. Opportunities lie in developing sustainable and high-performance materials that meet the evolving needs of various industries. Strategic partnerships and investments in R&D will be crucial for players seeking to succeed in this dynamic market.
Rigid Transparent Plastics Market Segmentation
-
1. Polymer Type
- 1.1. Polycarbonate (PC)
- 1.2. Polyvinyl Chloride (PVC)
- 1.3. Polystyrene (PS)
- 1.4. Acryloni
- 1.5. Polypropylene (PP)
- 1.6. Polymethyl Methacrylate (PMMA)
- 1.7. Styrene Block Copolymers (SBC)
- 1.8. Other Polymer Types
-
2. End-user Industry
- 2.1. Packaging
- 2.2. Healthcare
- 2.3. Electrical and Electronics
- 2.4. Automotive
- 2.5. Buildings and Construction
- 2.6. Other End-user Industries
Rigid Transparent Plastics Market Segmentation By Geography
-
1. Asia Pacific
- 1.1. China
- 1.2. India
- 1.3. Japan
- 1.4. South Korea
- 1.5. Rest of Asia Pacific
-
2. North America
- 2.1. United States
- 2.2. Canada
- 2.3. Mexico
-
3. Europe
- 3.1. Germany
- 3.2. United Kingdom
- 3.3. Italy
- 3.4. France
- 3.5. Spain
- 3.6. Rest of Europe
-
4. South America
- 4.1. Brazil
- 4.2. Argentina
- 4.3. Rest of South America
-
5. Middle East and Africa
- 5.1. Saudi Arabia
- 5.2. South Africa
- 5.3. Rest of Middle East and Africa
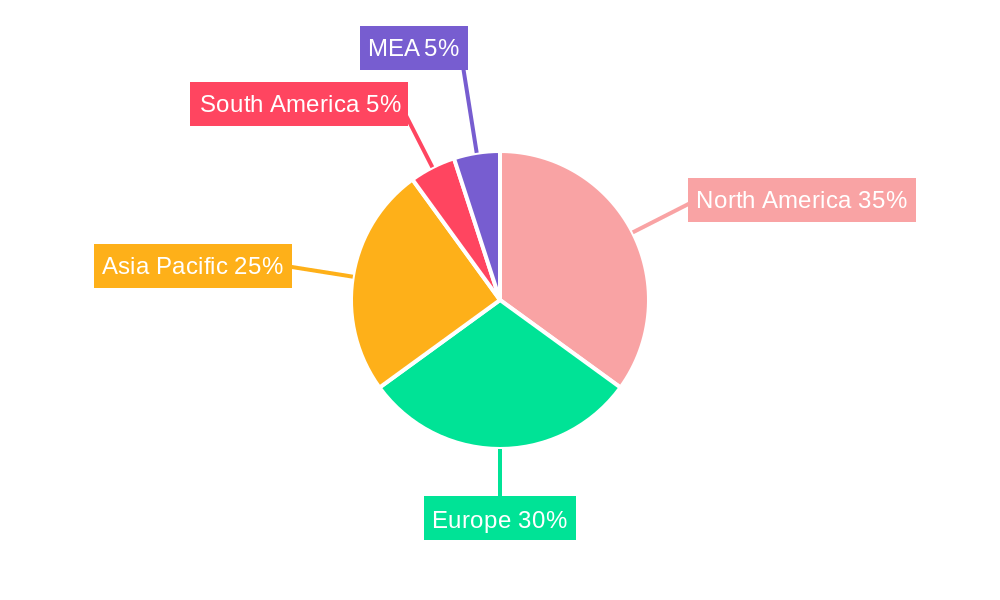
Rigid Transparent Plastics Market Regional Market Share
Geographic Coverage of Rigid Transparent Plastics Market
Rigid Transparent Plastics Market REPORT HIGHLIGHTS
| Aspects | Details |
|---|---|
| Study Period | 2020-2034 |
| Base Year | 2025 |
| Estimated Year | 2026 |
| Forecast Period | 2026-2034 |
| Historical Period | 2020-2025 |
| Growth Rate | CAGR of 16.44% from 2020-2034 |
| Segmentation |
|
Table of Contents
- 1. Introduction
- 1.1. Research Scope
- 1.2. Market Segmentation
- 1.3. Research Objective
- 1.4. Definitions and Assumptions
- 2. Executive Summary
- 2.1. Market Snapshot
- 3. Market Dynamics
- 3.1. Market Drivers
- 3.2. Market Restrains
- 3.3. Market Trends
- 3.4. Market Opportunities
- 4. Market Factor Analysis
- 4.1. Porters Five Forces
- 4.1.1. Bargaining Power of Suppliers
- 4.1.2. Bargaining Power of Buyers
- 4.1.3. Threat of New Entrants
- 4.1.4. Threat of Substitutes
- 4.1.5. Competitive Rivalry
- 4.2. PESTEL analysis
- 4.3. BCG Analysis
- 4.3.1. Stars (High Growth, High Market Share)
- 4.3.2. Cash Cows (Low Growth, High Market Share)
- 4.3.3. Question Mark (High Growth, Low Market Share)
- 4.3.4. Dogs (Low Growth, Low Market Share)
- 4.4. Ansoff Matrix Analysis
- 4.5. Supply Chain Analysis
- 4.6. Regulatory Landscape
- 4.7. Current Market Potential and Opportunity Assessment (TAM–SAM–SOM Framework)
- 4.8. PRI Analyst Note
- 4.1. Porters Five Forces
- 5. Market Analysis, Insights and Forecast 2021-2033
- 5.1. Market Analysis, Insights and Forecast - by Polymer Type
- 5.1.1. Polycarbonate (PC)
- 5.1.2. Polyvinyl Chloride (PVC)
- 5.1.3. Polystyrene (PS)
- 5.1.4. Acryloni
- 5.1.5. Polypropylene (PP)
- 5.1.6. Polymethyl Methacrylate (PMMA)
- 5.1.7. Styrene Block Copolymers (SBC)
- 5.1.8. Other Polymer Types
- 5.2. Market Analysis, Insights and Forecast - by End-user Industry
- 5.2.1. Packaging
- 5.2.2. Healthcare
- 5.2.3. Electrical and Electronics
- 5.2.4. Automotive
- 5.2.5. Buildings and Construction
- 5.2.6. Other End-user Industries
- 5.3. Market Analysis, Insights and Forecast - by Region
- 5.3.1. Asia Pacific
- 5.3.2. North America
- 5.3.3. Europe
- 5.3.4. South America
- 5.3.5. Middle East and Africa
- 5.1. Market Analysis, Insights and Forecast - by Polymer Type
- 6. Global Rigid Transparent Plastics Market Analysis, Insights and Forecast, 2021-2033
- 6.1. Market Analysis, Insights and Forecast - by Polymer Type
- 6.1.1. Polycarbonate (PC)
- 6.1.2. Polyvinyl Chloride (PVC)
- 6.1.3. Polystyrene (PS)
- 6.1.4. Acryloni
- 6.1.5. Polypropylene (PP)
- 6.1.6. Polymethyl Methacrylate (PMMA)
- 6.1.7. Styrene Block Copolymers (SBC)
- 6.1.8. Other Polymer Types
- 6.2. Market Analysis, Insights and Forecast - by End-user Industry
- 6.2.1. Packaging
- 6.2.2. Healthcare
- 6.2.3. Electrical and Electronics
- 6.2.4. Automotive
- 6.2.5. Buildings and Construction
- 6.2.6. Other End-user Industries
- 6.1. Market Analysis, Insights and Forecast - by Polymer Type
- 7. Asia Pacific Rigid Transparent Plastics Market Analysis, Insights and Forecast, 2020-2032
- 7.1. Market Analysis, Insights and Forecast - by Polymer Type
- 7.1.1. Polycarbonate (PC)
- 7.1.2. Polyvinyl Chloride (PVC)
- 7.1.3. Polystyrene (PS)
- 7.1.4. Acryloni
- 7.1.5. Polypropylene (PP)
- 7.1.6. Polymethyl Methacrylate (PMMA)
- 7.1.7. Styrene Block Copolymers (SBC)
- 7.1.8. Other Polymer Types
- 7.2. Market Analysis, Insights and Forecast - by End-user Industry
- 7.2.1. Packaging
- 7.2.2. Healthcare
- 7.2.3. Electrical and Electronics
- 7.2.4. Automotive
- 7.2.5. Buildings and Construction
- 7.2.6. Other End-user Industries
- 7.1. Market Analysis, Insights and Forecast - by Polymer Type
- 8. North America Rigid Transparent Plastics Market Analysis, Insights and Forecast, 2020-2032
- 8.1. Market Analysis, Insights and Forecast - by Polymer Type
- 8.1.1. Polycarbonate (PC)
- 8.1.2. Polyvinyl Chloride (PVC)
- 8.1.3. Polystyrene (PS)
- 8.1.4. Acryloni
- 8.1.5. Polypropylene (PP)
- 8.1.6. Polymethyl Methacrylate (PMMA)
- 8.1.7. Styrene Block Copolymers (SBC)
- 8.1.8. Other Polymer Types
- 8.2. Market Analysis, Insights and Forecast - by End-user Industry
- 8.2.1. Packaging
- 8.2.2. Healthcare
- 8.2.3. Electrical and Electronics
- 8.2.4. Automotive
- 8.2.5. Buildings and Construction
- 8.2.6. Other End-user Industries
- 8.1. Market Analysis, Insights and Forecast - by Polymer Type
- 9. Europe Rigid Transparent Plastics Market Analysis, Insights and Forecast, 2020-2032
- 9.1. Market Analysis, Insights and Forecast - by Polymer Type
- 9.1.1. Polycarbonate (PC)
- 9.1.2. Polyvinyl Chloride (PVC)
- 9.1.3. Polystyrene (PS)
- 9.1.4. Acryloni
- 9.1.5. Polypropylene (PP)
- 9.1.6. Polymethyl Methacrylate (PMMA)
- 9.1.7. Styrene Block Copolymers (SBC)
- 9.1.8. Other Polymer Types
- 9.2. Market Analysis, Insights and Forecast - by End-user Industry
- 9.2.1. Packaging
- 9.2.2. Healthcare
- 9.2.3. Electrical and Electronics
- 9.2.4. Automotive
- 9.2.5. Buildings and Construction
- 9.2.6. Other End-user Industries
- 9.1. Market Analysis, Insights and Forecast - by Polymer Type
- 10. South America Rigid Transparent Plastics Market Analysis, Insights and Forecast, 2020-2032
- 10.1. Market Analysis, Insights and Forecast - by Polymer Type
- 10.1.1. Polycarbonate (PC)
- 10.1.2. Polyvinyl Chloride (PVC)
- 10.1.3. Polystyrene (PS)
- 10.1.4. Acryloni
- 10.1.5. Polypropylene (PP)
- 10.1.6. Polymethyl Methacrylate (PMMA)
- 10.1.7. Styrene Block Copolymers (SBC)
- 10.1.8. Other Polymer Types
- 10.2. Market Analysis, Insights and Forecast - by End-user Industry
- 10.2.1. Packaging
- 10.2.2. Healthcare
- 10.2.3. Electrical and Electronics
- 10.2.4. Automotive
- 10.2.5. Buildings and Construction
- 10.2.6. Other End-user Industries
- 10.1. Market Analysis, Insights and Forecast - by Polymer Type
- 11. Middle East and Africa Rigid Transparent Plastics Market Analysis, Insights and Forecast, 2020-2032
- 11.1. Market Analysis, Insights and Forecast - by Polymer Type
- 11.1.1. Polycarbonate (PC)
- 11.1.2. Polyvinyl Chloride (PVC)
- 11.1.3. Polystyrene (PS)
- 11.1.4. Acryloni
- 11.1.5. Polypropylene (PP)
- 11.1.6. Polymethyl Methacrylate (PMMA)
- 11.1.7. Styrene Block Copolymers (SBC)
- 11.1.8. Other Polymer Types
- 11.2. Market Analysis, Insights and Forecast - by End-user Industry
- 11.2.1. Packaging
- 11.2.2. Healthcare
- 11.2.3. Electrical and Electronics
- 11.2.4. Automotive
- 11.2.5. Buildings and Construction
- 11.2.6. Other End-user Industries
- 11.1. Market Analysis, Insights and Forecast - by Polymer Type
- 12. Competitive Analysis
- 12.1. Company Profiles
- 12.1.1 Chevron Phillips Chemical Company
- 12.1.1.1. Company Overview
- 12.1.1.2. Products
- 12.1.1.3. Company Financials
- 12.1.1.4. SWOT Analysis
- 12.1.2 Mitsubishi Engineering Plastics Corporation (Mitsubishi Chemical Corporation)
- 12.1.2.1. Company Overview
- 12.1.2.2. Products
- 12.1.2.3. Company Financials
- 12.1.2.4. SWOT Analysis
- 12.1.3 Teijin Limited
- 12.1.3.1. Company Overview
- 12.1.3.2. Products
- 12.1.3.3. Company Financials
- 12.1.3.4. SWOT Analysis
- 12.1.4 Asahi Kasei Corporation
- 12.1.4.1. Company Overview
- 12.1.4.2. Products
- 12.1.4.3. Company Financials
- 12.1.4.4. SWOT Analysis
- 12.1.5 Formosa Plastics Group
- 12.1.5.1. Company Overview
- 12.1.5.2. Products
- 12.1.5.3. Company Financials
- 12.1.5.4. SWOT Analysis
- 12.1.6 Ineos Chlorvinyls Ltd
- 12.1.6.1. Company Overview
- 12.1.6.2. Products
- 12.1.6.3. Company Financials
- 12.1.6.4. SWOT Analysis
- 12.1.7 Solvay
- 12.1.7.1. Company Overview
- 12.1.7.2. Products
- 12.1.7.3. Company Financials
- 12.1.7.4. SWOT Analysis
- 12.1.8 Westlake Chemical Corporation
- 12.1.8.1. Company Overview
- 12.1.8.2. Products
- 12.1.8.3. Company Financials
- 12.1.8.4. SWOT Analysis
- 12.1.9 Shin-Etsu Chemical Co Limited
- 12.1.9.1. Company Overview
- 12.1.9.2. Products
- 12.1.9.3. Company Financials
- 12.1.9.4. SWOT Analysis
- 12.1.10 Evonik Industries AG
- 12.1.10.1. Company Overview
- 12.1.10.2. Products
- 12.1.10.3. Company Financials
- 12.1.10.4. SWOT Analysis
- 12.1.11 Lotte Chemical Corporation
- 12.1.11.1. Company Overview
- 12.1.11.2. Products
- 12.1.11.3. Company Financials
- 12.1.11.4. SWOT Analysis
- 12.1.12 Ashland
- 12.1.12.1. Company Overview
- 12.1.12.2. Products
- 12.1.12.3. Company Financials
- 12.1.12.4. SWOT Analysis
- 12.1.13 BASF SE
- 12.1.13.1. Company Overview
- 12.1.13.2. Products
- 12.1.13.3. Company Financials
- 12.1.13.4. SWOT Analysis
- 12.1.14 Arkema Group
- 12.1.14.1. Company Overview
- 12.1.14.2. Products
- 12.1.14.3. Company Financials
- 12.1.14.4. SWOT Analysis
- 12.1.15 Samyang
- 12.1.15.1. Company Overview
- 12.1.15.2. Products
- 12.1.15.3. Company Financials
- 12.1.15.4. SWOT Analysis
- 12.1.16 SABIC
- 12.1.16.1. Company Overview
- 12.1.16.2. Products
- 12.1.16.3. Company Financials
- 12.1.16.4. SWOT Analysis
- 12.1.17 Huntsman Corp
- 12.1.17.1. Company Overview
- 12.1.17.2. Products
- 12.1.17.3. Company Financials
- 12.1.17.4. SWOT Analysis
- 12.1.18 Trinseo
- 12.1.18.1. Company Overview
- 12.1.18.2. Products
- 12.1.18.3. Company Financials
- 12.1.18.4. SWOT Analysis
- 12.1.19 DSM
- 12.1.19.1. Company Overview
- 12.1.19.2. Products
- 12.1.19.3. Company Financials
- 12.1.19.4. SWOT Analysis
- 12.1.20 LG Chem
- 12.1.20.1. Company Overview
- 12.1.20.2. Products
- 12.1.20.3. Company Financials
- 12.1.20.4. SWOT Analysis
- 12.1.21 DuPont
- 12.1.21.1. Company Overview
- 12.1.21.2. Products
- 12.1.21.3. Company Financials
- 12.1.21.4. SWOT Analysis
- 12.1.22 Idemitsu Kosan
- 12.1.22.1. Company Overview
- 12.1.22.2. Products
- 12.1.22.3. Company Financials
- 12.1.22.4. SWOT Analysis
- 12.1.23 Chi Mei Corp
- 12.1.23.1. Company Overview
- 12.1.23.2. Products
- 12.1.23.3. Company Financials
- 12.1.23.4. SWOT Analysis
- 12.1.24 Covestro AG
- 12.1.24.1. Company Overview
- 12.1.24.2. Products
- 12.1.24.3. Company Financials
- 12.1.24.4. SWOT Analysis
- 12.1.25 Lanxess
- 12.1.25.1. Company Overview
- 12.1.25.2. Products
- 12.1.25.3. Company Financials
- 12.1.25.4. SWOT Analysis
- 12.1.1 Chevron Phillips Chemical Company
- 12.2. Market Entropy
- 12.2.1 Company's Key Areas Served
- 12.2.2 Recent Developments
- 12.3. Company Market Share Analysis 2025
- 12.3.1 Top 5 Companies Market Share Analysis
- 12.3.2 Top 3 Companies Market Share Analysis
- 12.4. List of Potential Customers
- 13. Research Methodology
List of Figures
- Figure 1: Global Rigid Transparent Plastics Market Revenue Breakdown (billion, %) by Region 2025 & 2033
- Figure 2: Global Rigid Transparent Plastics Market Volume Breakdown (K Tons, %) by Region 2025 & 2033
- Figure 3: Asia Pacific Rigid Transparent Plastics Market Revenue (billion), by Polymer Type 2025 & 2033
- Figure 4: Asia Pacific Rigid Transparent Plastics Market Volume (K Tons), by Polymer Type 2025 & 2033
- Figure 5: Asia Pacific Rigid Transparent Plastics Market Revenue Share (%), by Polymer Type 2025 & 2033
- Figure 6: Asia Pacific Rigid Transparent Plastics Market Volume Share (%), by Polymer Type 2025 & 2033
- Figure 7: Asia Pacific Rigid Transparent Plastics Market Revenue (billion), by End-user Industry 2025 & 2033
- Figure 8: Asia Pacific Rigid Transparent Plastics Market Volume (K Tons), by End-user Industry 2025 & 2033
- Figure 9: Asia Pacific Rigid Transparent Plastics Market Revenue Share (%), by End-user Industry 2025 & 2033
- Figure 10: Asia Pacific Rigid Transparent Plastics Market Volume Share (%), by End-user Industry 2025 & 2033
- Figure 11: Asia Pacific Rigid Transparent Plastics Market Revenue (billion), by Country 2025 & 2033
- Figure 12: Asia Pacific Rigid Transparent Plastics Market Volume (K Tons), by Country 2025 & 2033
- Figure 13: Asia Pacific Rigid Transparent Plastics Market Revenue Share (%), by Country 2025 & 2033
- Figure 14: Asia Pacific Rigid Transparent Plastics Market Volume Share (%), by Country 2025 & 2033
- Figure 15: North America Rigid Transparent Plastics Market Revenue (billion), by Polymer Type 2025 & 2033
- Figure 16: North America Rigid Transparent Plastics Market Volume (K Tons), by Polymer Type 2025 & 2033
- Figure 17: North America Rigid Transparent Plastics Market Revenue Share (%), by Polymer Type 2025 & 2033
- Figure 18: North America Rigid Transparent Plastics Market Volume Share (%), by Polymer Type 2025 & 2033
- Figure 19: North America Rigid Transparent Plastics Market Revenue (billion), by End-user Industry 2025 & 2033
- Figure 20: North America Rigid Transparent Plastics Market Volume (K Tons), by End-user Industry 2025 & 2033
- Figure 21: North America Rigid Transparent Plastics Market Revenue Share (%), by End-user Industry 2025 & 2033
- Figure 22: North America Rigid Transparent Plastics Market Volume Share (%), by End-user Industry 2025 & 2033
- Figure 23: North America Rigid Transparent Plastics Market Revenue (billion), by Country 2025 & 2033
- Figure 24: North America Rigid Transparent Plastics Market Volume (K Tons), by Country 2025 & 2033
- Figure 25: North America Rigid Transparent Plastics Market Revenue Share (%), by Country 2025 & 2033
- Figure 26: North America Rigid Transparent Plastics Market Volume Share (%), by Country 2025 & 2033
- Figure 27: Europe Rigid Transparent Plastics Market Revenue (billion), by Polymer Type 2025 & 2033
- Figure 28: Europe Rigid Transparent Plastics Market Volume (K Tons), by Polymer Type 2025 & 2033
- Figure 29: Europe Rigid Transparent Plastics Market Revenue Share (%), by Polymer Type 2025 & 2033
- Figure 30: Europe Rigid Transparent Plastics Market Volume Share (%), by Polymer Type 2025 & 2033
- Figure 31: Europe Rigid Transparent Plastics Market Revenue (billion), by End-user Industry 2025 & 2033
- Figure 32: Europe Rigid Transparent Plastics Market Volume (K Tons), by End-user Industry 2025 & 2033
- Figure 33: Europe Rigid Transparent Plastics Market Revenue Share (%), by End-user Industry 2025 & 2033
- Figure 34: Europe Rigid Transparent Plastics Market Volume Share (%), by End-user Industry 2025 & 2033
- Figure 35: Europe Rigid Transparent Plastics Market Revenue (billion), by Country 2025 & 2033
- Figure 36: Europe Rigid Transparent Plastics Market Volume (K Tons), by Country 2025 & 2033
- Figure 37: Europe Rigid Transparent Plastics Market Revenue Share (%), by Country 2025 & 2033
- Figure 38: Europe Rigid Transparent Plastics Market Volume Share (%), by Country 2025 & 2033
- Figure 39: South America Rigid Transparent Plastics Market Revenue (billion), by Polymer Type 2025 & 2033
- Figure 40: South America Rigid Transparent Plastics Market Volume (K Tons), by Polymer Type 2025 & 2033
- Figure 41: South America Rigid Transparent Plastics Market Revenue Share (%), by Polymer Type 2025 & 2033
- Figure 42: South America Rigid Transparent Plastics Market Volume Share (%), by Polymer Type 2025 & 2033
- Figure 43: South America Rigid Transparent Plastics Market Revenue (billion), by End-user Industry 2025 & 2033
- Figure 44: South America Rigid Transparent Plastics Market Volume (K Tons), by End-user Industry 2025 & 2033
- Figure 45: South America Rigid Transparent Plastics Market Revenue Share (%), by End-user Industry 2025 & 2033
- Figure 46: South America Rigid Transparent Plastics Market Volume Share (%), by End-user Industry 2025 & 2033
- Figure 47: South America Rigid Transparent Plastics Market Revenue (billion), by Country 2025 & 2033
- Figure 48: South America Rigid Transparent Plastics Market Volume (K Tons), by Country 2025 & 2033
- Figure 49: South America Rigid Transparent Plastics Market Revenue Share (%), by Country 2025 & 2033
- Figure 50: South America Rigid Transparent Plastics Market Volume Share (%), by Country 2025 & 2033
- Figure 51: Middle East and Africa Rigid Transparent Plastics Market Revenue (billion), by Polymer Type 2025 & 2033
- Figure 52: Middle East and Africa Rigid Transparent Plastics Market Volume (K Tons), by Polymer Type 2025 & 2033
- Figure 53: Middle East and Africa Rigid Transparent Plastics Market Revenue Share (%), by Polymer Type 2025 & 2033
- Figure 54: Middle East and Africa Rigid Transparent Plastics Market Volume Share (%), by Polymer Type 2025 & 2033
- Figure 55: Middle East and Africa Rigid Transparent Plastics Market Revenue (billion), by End-user Industry 2025 & 2033
- Figure 56: Middle East and Africa Rigid Transparent Plastics Market Volume (K Tons), by End-user Industry 2025 & 2033
- Figure 57: Middle East and Africa Rigid Transparent Plastics Market Revenue Share (%), by End-user Industry 2025 & 2033
- Figure 58: Middle East and Africa Rigid Transparent Plastics Market Volume Share (%), by End-user Industry 2025 & 2033
- Figure 59: Middle East and Africa Rigid Transparent Plastics Market Revenue (billion), by Country 2025 & 2033
- Figure 60: Middle East and Africa Rigid Transparent Plastics Market Volume (K Tons), by Country 2025 & 2033
- Figure 61: Middle East and Africa Rigid Transparent Plastics Market Revenue Share (%), by Country 2025 & 2033
- Figure 62: Middle East and Africa Rigid Transparent Plastics Market Volume Share (%), by Country 2025 & 2033
List of Tables
- Table 1: Global Rigid Transparent Plastics Market Revenue billion Forecast, by Polymer Type 2020 & 2033
- Table 2: Global Rigid Transparent Plastics Market Volume K Tons Forecast, by Polymer Type 2020 & 2033
- Table 3: Global Rigid Transparent Plastics Market Revenue billion Forecast, by End-user Industry 2020 & 2033
- Table 4: Global Rigid Transparent Plastics Market Volume K Tons Forecast, by End-user Industry 2020 & 2033
- Table 5: Global Rigid Transparent Plastics Market Revenue billion Forecast, by Region 2020 & 2033
- Table 6: Global Rigid Transparent Plastics Market Volume K Tons Forecast, by Region 2020 & 2033
- Table 7: Global Rigid Transparent Plastics Market Revenue billion Forecast, by Polymer Type 2020 & 2033
- Table 8: Global Rigid Transparent Plastics Market Volume K Tons Forecast, by Polymer Type 2020 & 2033
- Table 9: Global Rigid Transparent Plastics Market Revenue billion Forecast, by End-user Industry 2020 & 2033
- Table 10: Global Rigid Transparent Plastics Market Volume K Tons Forecast, by End-user Industry 2020 & 2033
- Table 11: Global Rigid Transparent Plastics Market Revenue billion Forecast, by Country 2020 & 2033
- Table 12: Global Rigid Transparent Plastics Market Volume K Tons Forecast, by Country 2020 & 2033
- Table 13: China Rigid Transparent Plastics Market Revenue (billion) Forecast, by Application 2020 & 2033
- Table 14: China Rigid Transparent Plastics Market Volume (K Tons) Forecast, by Application 2020 & 2033
- Table 15: India Rigid Transparent Plastics Market Revenue (billion) Forecast, by Application 2020 & 2033
- Table 16: India Rigid Transparent Plastics Market Volume (K Tons) Forecast, by Application 2020 & 2033
- Table 17: Japan Rigid Transparent Plastics Market Revenue (billion) Forecast, by Application 2020 & 2033
- Table 18: Japan Rigid Transparent Plastics Market Volume (K Tons) Forecast, by Application 2020 & 2033
- Table 19: South Korea Rigid Transparent Plastics Market Revenue (billion) Forecast, by Application 2020 & 2033
- Table 20: South Korea Rigid Transparent Plastics Market Volume (K Tons) Forecast, by Application 2020 & 2033
- Table 21: Rest of Asia Pacific Rigid Transparent Plastics Market Revenue (billion) Forecast, by Application 2020 & 2033
- Table 22: Rest of Asia Pacific Rigid Transparent Plastics Market Volume (K Tons) Forecast, by Application 2020 & 2033
- Table 23: Global Rigid Transparent Plastics Market Revenue billion Forecast, by Polymer Type 2020 & 2033
- Table 24: Global Rigid Transparent Plastics Market Volume K Tons Forecast, by Polymer Type 2020 & 2033
- Table 25: Global Rigid Transparent Plastics Market Revenue billion Forecast, by End-user Industry 2020 & 2033
- Table 26: Global Rigid Transparent Plastics Market Volume K Tons Forecast, by End-user Industry 2020 & 2033
- Table 27: Global Rigid Transparent Plastics Market Revenue billion Forecast, by Country 2020 & 2033
- Table 28: Global Rigid Transparent Plastics Market Volume K Tons Forecast, by Country 2020 & 2033
- Table 29: United States Rigid Transparent Plastics Market Revenue (billion) Forecast, by Application 2020 & 2033
- Table 30: United States Rigid Transparent Plastics Market Volume (K Tons) Forecast, by Application 2020 & 2033
- Table 31: Canada Rigid Transparent Plastics Market Revenue (billion) Forecast, by Application 2020 & 2033
- Table 32: Canada Rigid Transparent Plastics Market Volume (K Tons) Forecast, by Application 2020 & 2033
- Table 33: Mexico Rigid Transparent Plastics Market Revenue (billion) Forecast, by Application 2020 & 2033
- Table 34: Mexico Rigid Transparent Plastics Market Volume (K Tons) Forecast, by Application 2020 & 2033
- Table 35: Global Rigid Transparent Plastics Market Revenue billion Forecast, by Polymer Type 2020 & 2033
- Table 36: Global Rigid Transparent Plastics Market Volume K Tons Forecast, by Polymer Type 2020 & 2033
- Table 37: Global Rigid Transparent Plastics Market Revenue billion Forecast, by End-user Industry 2020 & 2033
- Table 38: Global Rigid Transparent Plastics Market Volume K Tons Forecast, by End-user Industry 2020 & 2033
- Table 39: Global Rigid Transparent Plastics Market Revenue billion Forecast, by Country 2020 & 2033
- Table 40: Global Rigid Transparent Plastics Market Volume K Tons Forecast, by Country 2020 & 2033
- Table 41: Germany Rigid Transparent Plastics Market Revenue (billion) Forecast, by Application 2020 & 2033
- Table 42: Germany Rigid Transparent Plastics Market Volume (K Tons) Forecast, by Application 2020 & 2033
- Table 43: United Kingdom Rigid Transparent Plastics Market Revenue (billion) Forecast, by Application 2020 & 2033
- Table 44: United Kingdom Rigid Transparent Plastics Market Volume (K Tons) Forecast, by Application 2020 & 2033
- Table 45: Italy Rigid Transparent Plastics Market Revenue (billion) Forecast, by Application 2020 & 2033
- Table 46: Italy Rigid Transparent Plastics Market Volume (K Tons) Forecast, by Application 2020 & 2033
- Table 47: France Rigid Transparent Plastics Market Revenue (billion) Forecast, by Application 2020 & 2033
- Table 48: France Rigid Transparent Plastics Market Volume (K Tons) Forecast, by Application 2020 & 2033
- Table 49: Spain Rigid Transparent Plastics Market Revenue (billion) Forecast, by Application 2020 & 2033
- Table 50: Spain Rigid Transparent Plastics Market Volume (K Tons) Forecast, by Application 2020 & 2033
- Table 51: Rest of Europe Rigid Transparent Plastics Market Revenue (billion) Forecast, by Application 2020 & 2033
- Table 52: Rest of Europe Rigid Transparent Plastics Market Volume (K Tons) Forecast, by Application 2020 & 2033
- Table 53: Global Rigid Transparent Plastics Market Revenue billion Forecast, by Polymer Type 2020 & 2033
- Table 54: Global Rigid Transparent Plastics Market Volume K Tons Forecast, by Polymer Type 2020 & 2033
- Table 55: Global Rigid Transparent Plastics Market Revenue billion Forecast, by End-user Industry 2020 & 2033
- Table 56: Global Rigid Transparent Plastics Market Volume K Tons Forecast, by End-user Industry 2020 & 2033
- Table 57: Global Rigid Transparent Plastics Market Revenue billion Forecast, by Country 2020 & 2033
- Table 58: Global Rigid Transparent Plastics Market Volume K Tons Forecast, by Country 2020 & 2033
- Table 59: Brazil Rigid Transparent Plastics Market Revenue (billion) Forecast, by Application 2020 & 2033
- Table 60: Brazil Rigid Transparent Plastics Market Volume (K Tons) Forecast, by Application 2020 & 2033
- Table 61: Argentina Rigid Transparent Plastics Market Revenue (billion) Forecast, by Application 2020 & 2033
- Table 62: Argentina Rigid Transparent Plastics Market Volume (K Tons) Forecast, by Application 2020 & 2033
- Table 63: Rest of South America Rigid Transparent Plastics Market Revenue (billion) Forecast, by Application 2020 & 2033
- Table 64: Rest of South America Rigid Transparent Plastics Market Volume (K Tons) Forecast, by Application 2020 & 2033
- Table 65: Global Rigid Transparent Plastics Market Revenue billion Forecast, by Polymer Type 2020 & 2033
- Table 66: Global Rigid Transparent Plastics Market Volume K Tons Forecast, by Polymer Type 2020 & 2033
- Table 67: Global Rigid Transparent Plastics Market Revenue billion Forecast, by End-user Industry 2020 & 2033
- Table 68: Global Rigid Transparent Plastics Market Volume K Tons Forecast, by End-user Industry 2020 & 2033
- Table 69: Global Rigid Transparent Plastics Market Revenue billion Forecast, by Country 2020 & 2033
- Table 70: Global Rigid Transparent Plastics Market Volume K Tons Forecast, by Country 2020 & 2033
- Table 71: Saudi Arabia Rigid Transparent Plastics Market Revenue (billion) Forecast, by Application 2020 & 2033
- Table 72: Saudi Arabia Rigid Transparent Plastics Market Volume (K Tons) Forecast, by Application 2020 & 2033
- Table 73: South Africa Rigid Transparent Plastics Market Revenue (billion) Forecast, by Application 2020 & 2033
- Table 74: South Africa Rigid Transparent Plastics Market Volume (K Tons) Forecast, by Application 2020 & 2033
- Table 75: Rest of Middle East and Africa Rigid Transparent Plastics Market Revenue (billion) Forecast, by Application 2020 & 2033
- Table 76: Rest of Middle East and Africa Rigid Transparent Plastics Market Volume (K Tons) Forecast, by Application 2020 & 2033
Frequently Asked Questions
1. What is the projected Compound Annual Growth Rate (CAGR) of the Rigid Transparent Plastics Market?
The projected CAGR is approximately 16.44%.
2. Which companies are prominent players in the Rigid Transparent Plastics Market?
Key companies in the market include Chevron Phillips Chemical Company, Mitsubishi Engineering Plastics Corporation (Mitsubishi Chemical Corporation), Teijin Limited, Asahi Kasei Corporation, Formosa Plastics Group, Ineos Chlorvinyls Ltd, Solvay, Westlake Chemical Corporation, Shin-Etsu Chemical Co Limited, Evonik Industries AG, Lotte Chemical Corporation, Ashland, BASF SE, Arkema Group, Samyang, SABIC, Huntsman Corp, Trinseo, DSM, LG Chem, DuPont, Idemitsu Kosan, Chi Mei Corp, Covestro AG, Lanxess.
3. What are the main segments of the Rigid Transparent Plastics Market?
The market segments include Polymer Type, End-user Industry.
4. Can you provide details about the market size?
The market size is estimated to be USD 6.17 billion as of 2022.
5. What are some drivers contributing to market growth?
; Increasing Demand for Packed Foods from the Food & Beverage Industry; Rising Replacement of Conventional Materials by Rigid Transparent Plastics.
6. What are the notable trends driving market growth?
Increasing Demand from Packaging Industry.
7. Are there any restraints impacting market growth?
; Growing Concerns Regarding Plastic Disposal; Shifting of Focus Toward Flexible Packaging over Rigid Packaging.
8. Can you provide examples of recent developments in the market?
N/A
9. What pricing options are available for accessing the report?
Pricing options include single-user, multi-user, and enterprise licenses priced at USD 4750, USD 5250, and USD 8750 respectively.
10. Is the market size provided in terms of value or volume?
The market size is provided in terms of value, measured in billion and volume, measured in K Tons.
11. Are there any specific market keywords associated with the report?
Yes, the market keyword associated with the report is "Rigid Transparent Plastics Market," which aids in identifying and referencing the specific market segment covered.
12. How do I determine which pricing option suits my needs best?
The pricing options vary based on user requirements and access needs. Individual users may opt for single-user licenses, while businesses requiring broader access may choose multi-user or enterprise licenses for cost-effective access to the report.
13. Are there any additional resources or data provided in the Rigid Transparent Plastics Market report?
While the report offers comprehensive insights, it's advisable to review the specific contents or supplementary materials provided to ascertain if additional resources or data are available.
14. How can I stay updated on further developments or reports in the Rigid Transparent Plastics Market?
To stay informed about further developments, trends, and reports in the Rigid Transparent Plastics Market, consider subscribing to industry newsletters, following relevant companies and organizations, or regularly checking reputable industry news sources and publications.
Methodology
Step 1 - Identification of Relevant Samples Size from Population Database


Step 2 - Approaches for Defining Global Market Size (Value, Volume* & Price*)

Note*: In applicable scenarios
Step 3 - Data Sources
Primary Research
- Web Analytics
- Survey Reports
- Research Institute
- Latest Research Reports
- Opinion Leaders
Secondary Research
- Annual Reports
- White Paper
- Latest Press Release
- Industry Association
- Paid Database
- Investor Presentations

Step 4 - Data Triangulation
Involves using different sources of information in order to increase the validity of a study
These sources are likely to be stakeholders in a program - participants, other researchers, program staff, other community members, and so on.
Then we put all data in single framework & apply various statistical tools to find out the dynamic on the market.
During the analysis stage, feedback from the stakeholder groups would be compared to determine areas of agreement as well as areas of divergence