

Key Insights
The global market for Rotating Equipment Condition Monitoring and Fault Analysis Systems is poised for significant expansion, projected to reach an estimated $3.78 billion by 2025, demonstrating robust growth with a Compound Annual Growth Rate (CAGR) of 7% through 2033. This expansion is primarily fueled by the increasing demand for predictive maintenance solutions across various industrial sectors, aiming to minimize downtime, optimize operational efficiency, and extend the lifespan of critical machinery. The Energy sector, with its vast array of turbines, pumps, and compressors, represents a key application area, alongside the Chemical and Pharmaceutical industries where equipment reliability is paramount. Growing adoption of advanced technologies like the Industrial Internet of Things (IIoT), artificial intelligence (AI), and machine learning is further accelerating market growth. These technologies enable more sophisticated remote monitoring systems and online monitoring systems, offering real-time data analysis for early fault detection and proactive intervention. The push towards Industry 4.0 and smart manufacturing initiatives worldwide is also a significant contributor to the market's upward trajectory.
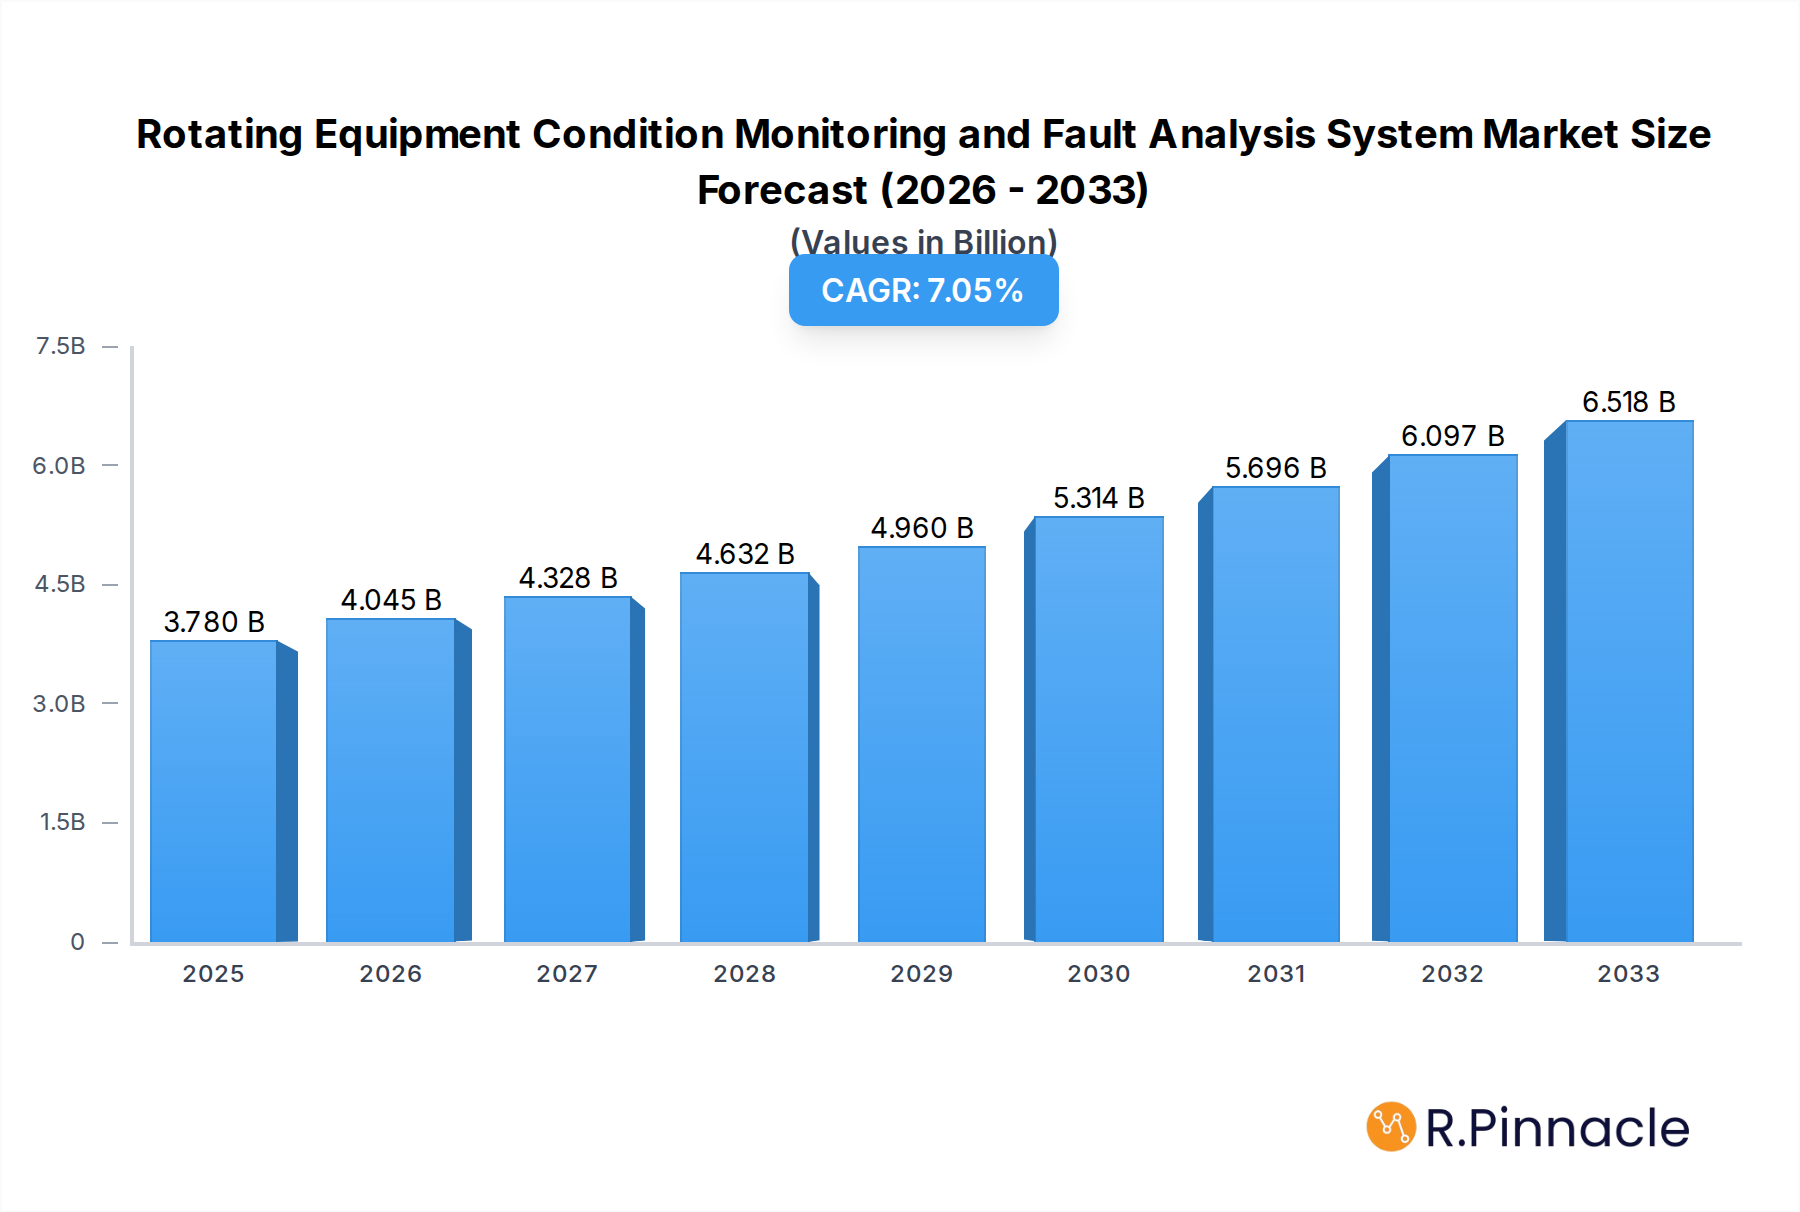
Rotating Equipment Condition Monitoring and Fault Analysis System Market Size (In Billion)
While the market benefits from strong growth drivers, certain factors can present challenges. The initial investment cost for sophisticated monitoring systems and the need for skilled personnel to operate and interpret data can be restraining factors for some small and medium-sized enterprises. However, the long-term cost savings derived from preventing catastrophic equipment failures and reducing unplanned downtime are increasingly outweighing these initial concerns. Key players such as GE, Emerson, SKF, Honeywell, and Siemens are actively investing in research and development, launching innovative solutions that address these challenges and further enhance the capabilities of rotating equipment monitoring. The Asia Pacific region, particularly China and India, is emerging as a dominant force due to rapid industrialization and a growing focus on operational excellence, alongside established markets in North America and Europe. The evolution towards integrated, intelligent monitoring platforms will continue to shape the market landscape, driving greater adoption and market value in the coming years.

Rotating Equipment Condition Monitoring and Fault Analysis System Company Market Share
Rotating Equipment Condition Monitoring and Fault Analysis System Market: Comprehensive Industry Report
This in-depth report offers a detailed analysis of the global Rotating Equipment Condition Monitoring and Fault Analysis System market, providing actionable insights for stakeholders across the Energy, Chemical, Pharmaceutical, and Other industries. Covering a comprehensive study period from 2019 to 2033, with a base year of 2025, this report leverages high-ranking keywords and reader-centric content to enhance search visibility and inform strategic decision-making for industry professionals.
Rotating Equipment Condition Monitoring and Fault Analysis System Market Structure & Innovation Trends
The global Rotating Equipment Condition Monitoring and Fault Analysis System market exhibits a moderately consolidated structure, with key players like GE, Emerson, SKF, Honeywell, National Instruments, Rockwell Automation, ABB, Siemens, Azima DLI, RMS, Eaton Corporation, Sensemore, and Sensoteq holding significant market share, estimated to be in the range of billions. Innovation is primarily driven by advancements in sensor technology, data analytics, and the integration of artificial intelligence (AI) and machine learning (ML) for predictive maintenance. Regulatory frameworks, particularly those focused on industrial safety and operational efficiency, are becoming increasingly stringent, mandating the adoption of these advanced monitoring systems. The threat of product substitutes, such as manual inspection methods, is diminishing as the cost-effectiveness and efficacy of automated systems become more apparent. End-user demographics are shifting towards industries with high operational demands and stringent uptime requirements, necessitating proactive maintenance strategies. Mergers and acquisitions (M&A) activities are prevalent, with recent deals valued in the billions of dollars, indicating a strategic drive for market expansion and technological integration.
Rotating Equipment Condition Monitoring and Fault Analysis System Market Dynamics & Trends
The Rotating Equipment Condition Monitoring and Fault Analysis System market is poised for substantial growth, driven by an escalating demand for enhanced operational efficiency, reduced downtime, and predictive maintenance capabilities across various industrial sectors. The market is experiencing a robust Compound Annual Growth Rate (CAGR) of approximately 9.5 billion USD, with market penetration expected to reach significant levels by 2033. Technological disruptions are at the forefront of market evolution. The integration of the Industrial Internet of Things (IIoT) has revolutionized how condition monitoring data is collected, transmitted, and analyzed. Advanced sensor technologies, including vibration sensors, acoustic emission sensors, and thermal imaging cameras, are providing more granular and accurate data. Furthermore, the application of AI and ML algorithms is enabling sophisticated fault diagnosis and prognostics, allowing for the prediction of equipment failures before they occur. This shift from reactive to proactive maintenance strategies is a major consumer preference, as it directly translates into significant cost savings, improved safety, and extended equipment lifespan. Competitive dynamics are characterized by a blend of established industrial giants and emerging specialized technology providers. Companies are investing heavily in research and development to offer integrated solutions that encompass data acquisition, real-time analysis, and actionable insights. The competitive landscape is also influenced by the increasing adoption of cloud-based platforms, which offer scalability, accessibility, and advanced analytics capabilities. Cybersecurity concerns related to connected industrial systems are a growing consideration, prompting vendors to invest in robust security measures for their monitoring solutions. The growing emphasis on sustainability and energy efficiency within industries also contributes to the demand for systems that can optimize the performance of rotating equipment, thereby reducing energy consumption and waste.
Dominant Regions & Segments in Rotating Equipment Condition Monitoring and Fault Analysis System
The Energy application segment, particularly in the North America region, stands as a dominant force in the global Rotating Equipment Condition Monitoring and Fault Analysis System market. This dominance is underpinned by a confluence of factors, including substantial investments in energy infrastructure, stringent safety regulations, and a proactive approach to optimizing the performance of critical assets such as turbines, generators, and pumps. Economic policies fostering industrial modernization and robust infrastructure development in countries like the United States and Canada have created a fertile ground for the adoption of advanced condition monitoring technologies. The Remote Monitoring System type also exhibits significant traction, driven by the vast geographical spread of energy facilities and the need for centralized oversight and expert analysis.
- Key Drivers for Dominance in North America's Energy Sector:
- High Operational Demands: The energy sector's need for uninterrupted power generation and distribution necessitates highly reliable rotating equipment, making condition monitoring indispensable.
- Stringent Safety & Environmental Regulations: Compliance with safety standards and environmental protection mandates drives investment in technologies that prevent catastrophic failures and reduce emissions.
- Technological Advancements & R&D: Significant investments in research and development within the region lead to the creation and adoption of cutting-edge monitoring solutions.
- Presence of Major Industry Players: Leading companies like GE, Emerson, and Honeywell have a strong presence and established customer base in North America.
Beyond North America, the Chemical and Pharmaceutical segments are also demonstrating robust growth, propelled by the inherent complexity and criticality of their manufacturing processes. The need to maintain product quality, prevent cross-contamination, and ensure operational continuity fuels the demand for sophisticated monitoring systems. The Online Monitoring System type is gaining prominence in these segments due to its ability to provide real-time data and immediate alerts for critical process parameters. Emerging economies in Asia-Pacific, with their rapidly expanding industrial base, are also presenting significant growth opportunities, driven by increasing investments in manufacturing and infrastructure.
Rotating Equipment Condition Monitoring and Fault Analysis System Product Innovations
Recent product innovations in Rotating Equipment Condition Monitoring and Fault Analysis Systems focus on enhanced data analytics, AI-driven prognostics, and seamless integration with existing industrial infrastructure. These advancements enable more precise fault detection, accurate prediction of remaining useful life, and optimized maintenance scheduling. The competitive advantage lies in offering intelligent, scalable, and user-friendly solutions that reduce operational costs and improve asset reliability, addressing the evolving needs of the Energy, Chemical, and Pharmaceutical sectors.
Report Scope & Segmentation Analysis
This report meticulously segments the Rotating Equipment Condition Monitoring and Fault Analysis System market. The Energy segment, valued in the billions, is projected to experience a CAGR of over 10 billion USD, driven by critical infrastructure needs. The Chemical segment, with an estimated market size in the billions, is expected to grow at a CAGR of approximately 8 billion USD, fueled by process optimization demands. The Pharmaceutical segment, also in the billions, anticipates a CAGR of around 7 billion USD, prioritizing product integrity and regulatory compliance. The Other segment encompasses diverse industries, contributing billions to the market with a projected CAGR of 6 billion USD. Within types, Remote Monitoring Systems, valued in the billions, are projected to expand at a CAGR of 9 billion USD, while Online Monitoring Systems, also in the billions, are expected to grow at a CAGR of 8.5 billion USD.
Key Drivers of Rotating Equipment Condition Monitoring and Fault Analysis System Growth
Several key drivers are propelling the growth of the Rotating Equipment Condition Monitoring and Fault Analysis System market. Technologically, the proliferation of IIoT devices and advanced sensor technology enables comprehensive data collection. Economically, the imperative to reduce operational expenditures and minimize downtime by preventing costly equipment failures is a significant motivator. Regulatory factors, particularly stringent safety and environmental standards in industries like Energy and Chemical, mandate proactive maintenance and therefore, condition monitoring solutions. The increasing sophistication of AI and ML algorithms for predictive analytics further enhances the value proposition, allowing for more accurate and timely fault identification.
Challenges in the Rotating Equipment Condition Monitoring and Fault Analysis System Sector
Despite robust growth, the Rotating Equipment Condition Monitoring and Fault Analysis System sector faces several challenges. Initial implementation costs can be substantial, posing a barrier for smaller enterprises. The complexity of integrating new systems with legacy industrial infrastructure requires specialized expertise. Cybersecurity threats to connected industrial systems are a growing concern, necessitating robust protective measures. Furthermore, a shortage of skilled personnel capable of analyzing complex data and managing advanced monitoring systems can hinder widespread adoption. Competitive pressures from established players and emerging niche providers also contribute to market dynamics, demanding continuous innovation and differentiation.
Emerging Opportunities in Rotating Equipment Condition Monitoring and Fault Analysis System
Emerging opportunities in the Rotating Equipment Condition Monitoring and Fault Analysis System market are multifaceted. The growing adoption of condition monitoring in previously underserved industries, such as mining and heavy manufacturing, presents new growth avenues. The development of more cost-effective and user-friendly solutions is expanding accessibility to a broader market. Advancements in edge computing are enabling real-time data processing closer to the equipment, reducing latency and improving decision-making. The increasing demand for integrated asset performance management (APM) solutions, which combine condition monitoring with other maintenance strategies, offers significant potential for market expansion and value creation.
Leading Players in the Rotating Equipment Condition Monitoring and Fault Analysis System Market
- GE
- Emerson
- SKF
- Honeywell
- National Instruments
- Rockwell Automation
- ABB
- Siemens
- Azima DLI
- RMS
- Eaton Corporation
- Sensemore
- Sensoteq
Key Developments in Rotating Equipment Condition Monitoring and Fault Analysis System Industry
- 2023: Siemens launched a new AI-powered predictive maintenance platform for industrial machinery.
- 2023: Emerson acquired a leading provider of vibration monitoring solutions to expand its condition monitoring portfolio.
- 2024: SKF introduced advanced wireless sensors for enhanced remote condition monitoring.
- 2024: Azima DLI released a cloud-based platform offering integrated machine learning fault diagnosis.
- 2024: Honeywell announced partnerships to integrate its monitoring solutions with IIoT ecosystems.
- 2024: ABB unveiled a new suite of smart sensors designed for critical rotating equipment.
- 2025: National Instruments released advanced data acquisition hardware for high-frequency condition monitoring.
- 2025: Rockwell Automation expanded its offerings with integrated software for asset health management.
- 2025: Sensemore launched a new generation of IoT sensors with built-in anomaly detection.
- 2025: Sensoteq introduced compact and robust condition monitoring solutions for challenging environments.
- 2025: RMS announced strategic collaborations to enhance its predictive analytics capabilities.
- 2025: Eaton Corporation expanded its condition monitoring services for power distribution systems.
Future Outlook for Rotating Equipment Condition Monitoring and Fault Analysis System Market
The future outlook for the Rotating Equipment Condition Monitoring and Fault Analysis System market is exceptionally bright, driven by an unyielding demand for operational excellence and asset reliability. Growth accelerators will include the continued maturation of AI and ML in delivering highly accurate predictive insights, the widespread adoption of IIoT across all industrial sectors, and the increasing focus on sustainability and energy efficiency. The market will witness a greater integration of condition monitoring with broader digital transformation initiatives, creating a more holistic approach to asset management. Strategic opportunities lie in developing tailored solutions for niche applications, enhancing cybersecurity features, and expanding into emerging geographical markets, ensuring sustained market expansion and innovation over the forecast period and beyond.
Rotating Equipment Condition Monitoring and Fault Analysis System Segmentation
-
1. Application
- 1.1. Energy
- 1.2. Chemical
- 1.3. Pharmaceutical
- 1.4. Other
-
2. Types
- 2.1. Remote Monitoring System
- 2.2. Online Monitoring System
- 2.3. Other
Rotating Equipment Condition Monitoring and Fault Analysis System Segmentation By Geography
-
1. North America
- 1.1. United States
- 1.2. Canada
- 1.3. Mexico
-
2. South America
- 2.1. Brazil
- 2.2. Argentina
- 2.3. Rest of South America
-
3. Europe
- 3.1. United Kingdom
- 3.2. Germany
- 3.3. France
- 3.4. Italy
- 3.5. Spain
- 3.6. Russia
- 3.7. Benelux
- 3.8. Nordics
- 3.9. Rest of Europe
-
4. Middle East & Africa
- 4.1. Turkey
- 4.2. Israel
- 4.3. GCC
- 4.4. North Africa
- 4.5. South Africa
- 4.6. Rest of Middle East & Africa
-
5. Asia Pacific
- 5.1. China
- 5.2. India
- 5.3. Japan
- 5.4. South Korea
- 5.5. ASEAN
- 5.6. Oceania
- 5.7. Rest of Asia Pacific
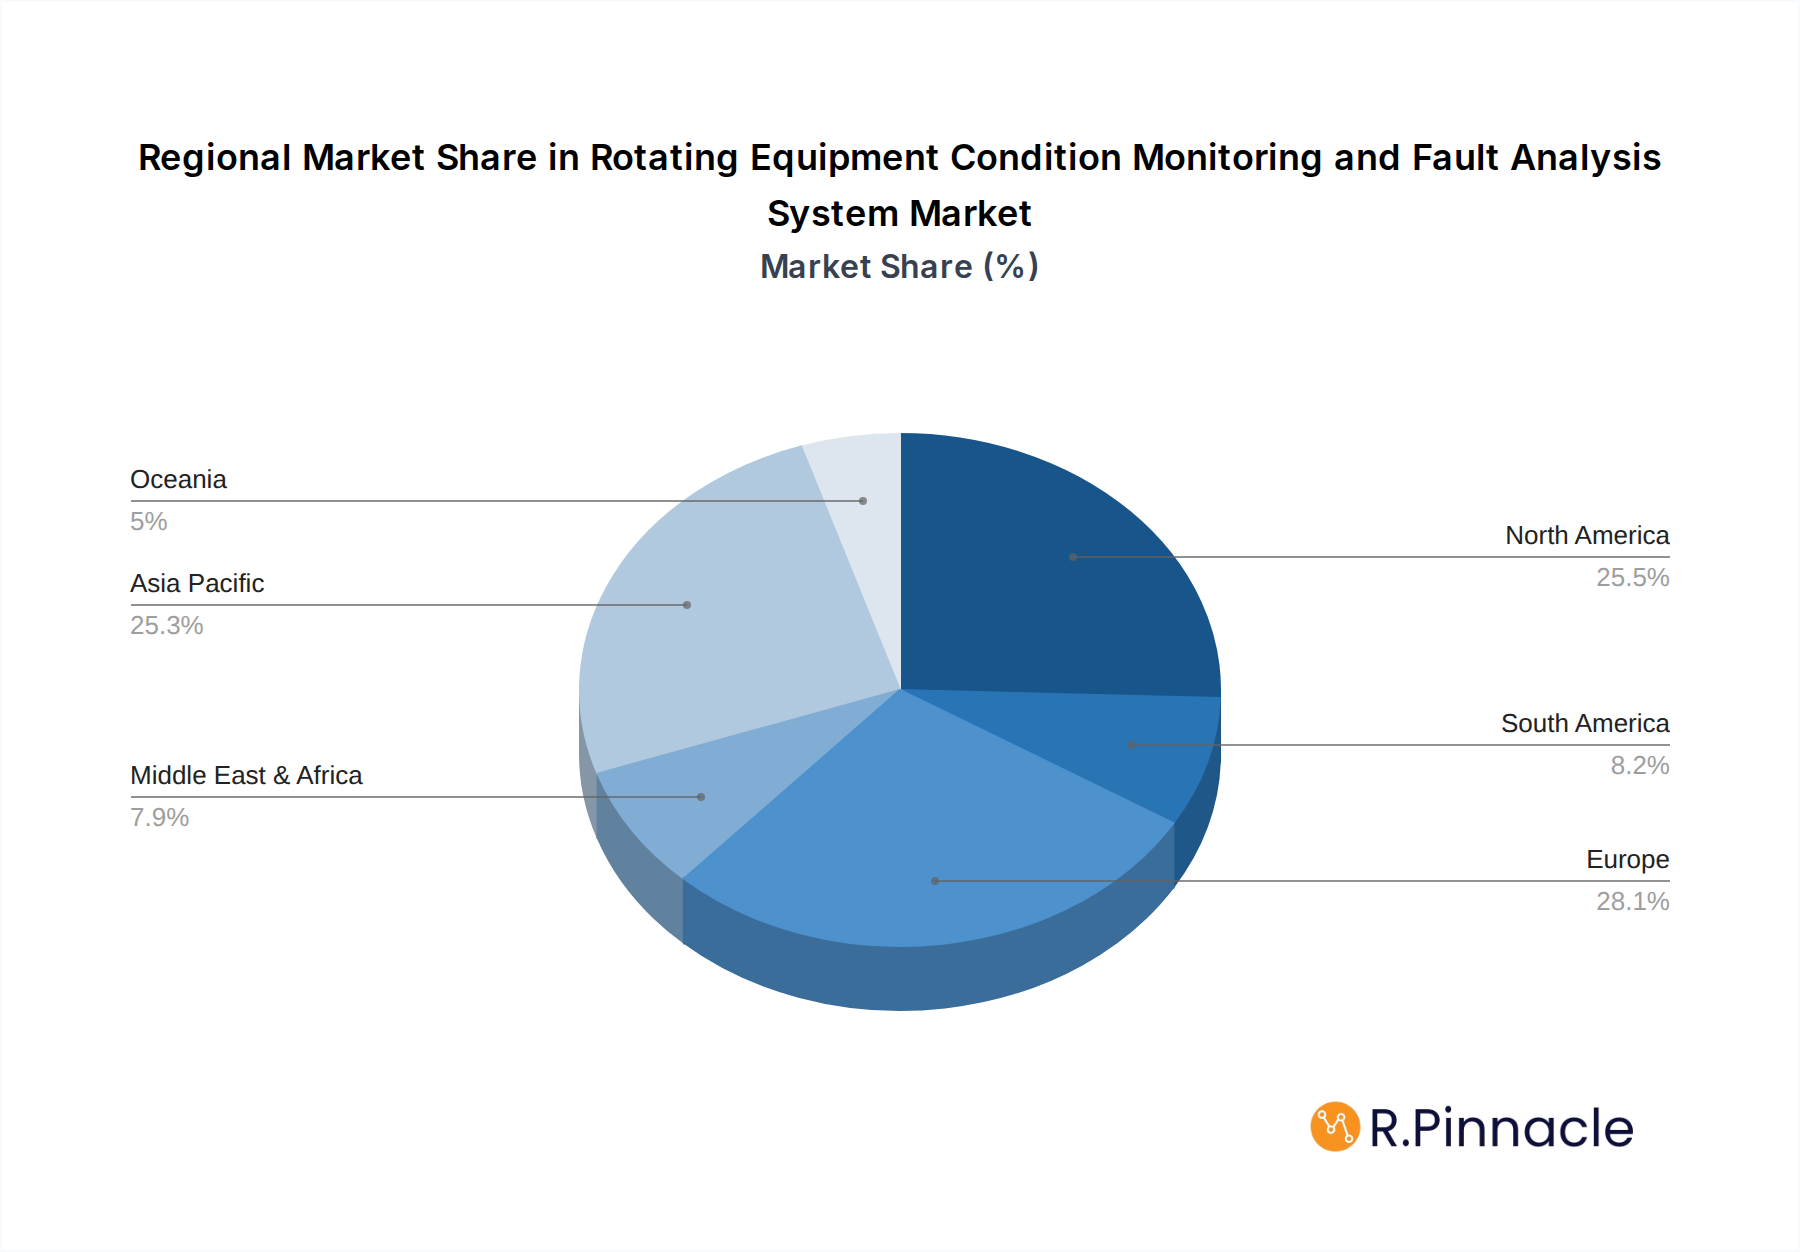
Rotating Equipment Condition Monitoring and Fault Analysis System Regional Market Share
Geographic Coverage of Rotating Equipment Condition Monitoring and Fault Analysis System
Rotating Equipment Condition Monitoring and Fault Analysis System REPORT HIGHLIGHTS
| Aspects | Details |
|---|---|
| Study Period | 2020-2034 |
| Base Year | 2025 |
| Estimated Year | 2026 |
| Forecast Period | 2026-2034 |
| Historical Period | 2020-2025 |
| Growth Rate | CAGR of 7% from 2020-2034 |
| Segmentation |
|
Table of Contents
- 1. Introduction
- 1.1. Research Scope
- 1.2. Market Segmentation
- 1.3. Research Methodology
- 1.4. Definitions and Assumptions
- 2. Executive Summary
- 2.1. Introduction
- 3. Market Dynamics
- 3.1. Introduction
- 3.2. Market Drivers
- 3.3. Market Restrains
- 3.4. Market Trends
- 4. Market Factor Analysis
- 4.1. Porters Five Forces
- 4.2. Supply/Value Chain
- 4.3. PESTEL analysis
- 4.4. Market Entropy
- 4.5. Patent/Trademark Analysis
- 5. Global Rotating Equipment Condition Monitoring and Fault Analysis System Analysis, Insights and Forecast, 2020-2032
- 5.1. Market Analysis, Insights and Forecast - by Application
- 5.1.1. Energy
- 5.1.2. Chemical
- 5.1.3. Pharmaceutical
- 5.1.4. Other
- 5.2. Market Analysis, Insights and Forecast - by Types
- 5.2.1. Remote Monitoring System
- 5.2.2. Online Monitoring System
- 5.2.3. Other
- 5.3. Market Analysis, Insights and Forecast - by Region
- 5.3.1. North America
- 5.3.2. South America
- 5.3.3. Europe
- 5.3.4. Middle East & Africa
- 5.3.5. Asia Pacific
- 5.1. Market Analysis, Insights and Forecast - by Application
- 6. North America Rotating Equipment Condition Monitoring and Fault Analysis System Analysis, Insights and Forecast, 2020-2032
- 6.1. Market Analysis, Insights and Forecast - by Application
- 6.1.1. Energy
- 6.1.2. Chemical
- 6.1.3. Pharmaceutical
- 6.1.4. Other
- 6.2. Market Analysis, Insights and Forecast - by Types
- 6.2.1. Remote Monitoring System
- 6.2.2. Online Monitoring System
- 6.2.3. Other
- 6.1. Market Analysis, Insights and Forecast - by Application
- 7. South America Rotating Equipment Condition Monitoring and Fault Analysis System Analysis, Insights and Forecast, 2020-2032
- 7.1. Market Analysis, Insights and Forecast - by Application
- 7.1.1. Energy
- 7.1.2. Chemical
- 7.1.3. Pharmaceutical
- 7.1.4. Other
- 7.2. Market Analysis, Insights and Forecast - by Types
- 7.2.1. Remote Monitoring System
- 7.2.2. Online Monitoring System
- 7.2.3. Other
- 7.1. Market Analysis, Insights and Forecast - by Application
- 8. Europe Rotating Equipment Condition Monitoring and Fault Analysis System Analysis, Insights and Forecast, 2020-2032
- 8.1. Market Analysis, Insights and Forecast - by Application
- 8.1.1. Energy
- 8.1.2. Chemical
- 8.1.3. Pharmaceutical
- 8.1.4. Other
- 8.2. Market Analysis, Insights and Forecast - by Types
- 8.2.1. Remote Monitoring System
- 8.2.2. Online Monitoring System
- 8.2.3. Other
- 8.1. Market Analysis, Insights and Forecast - by Application
- 9. Middle East & Africa Rotating Equipment Condition Monitoring and Fault Analysis System Analysis, Insights and Forecast, 2020-2032
- 9.1. Market Analysis, Insights and Forecast - by Application
- 9.1.1. Energy
- 9.1.2. Chemical
- 9.1.3. Pharmaceutical
- 9.1.4. Other
- 9.2. Market Analysis, Insights and Forecast - by Types
- 9.2.1. Remote Monitoring System
- 9.2.2. Online Monitoring System
- 9.2.3. Other
- 9.1. Market Analysis, Insights and Forecast - by Application
- 10. Asia Pacific Rotating Equipment Condition Monitoring and Fault Analysis System Analysis, Insights and Forecast, 2020-2032
- 10.1. Market Analysis, Insights and Forecast - by Application
- 10.1.1. Energy
- 10.1.2. Chemical
- 10.1.3. Pharmaceutical
- 10.1.4. Other
- 10.2. Market Analysis, Insights and Forecast - by Types
- 10.2.1. Remote Monitoring System
- 10.2.2. Online Monitoring System
- 10.2.3. Other
- 10.1. Market Analysis, Insights and Forecast - by Application
- 11. Competitive Analysis
- 11.1. Global Market Share Analysis 2025
- 11.2. Company Profiles
- 11.2.1 GE
- 11.2.1.1. Overview
- 11.2.1.2. Products
- 11.2.1.3. SWOT Analysis
- 11.2.1.4. Recent Developments
- 11.2.1.5. Financials (Based on Availability)
- 11.2.2 Emerson
- 11.2.2.1. Overview
- 11.2.2.2. Products
- 11.2.2.3. SWOT Analysis
- 11.2.2.4. Recent Developments
- 11.2.2.5. Financials (Based on Availability)
- 11.2.3 SKF
- 11.2.3.1. Overview
- 11.2.3.2. Products
- 11.2.3.3. SWOT Analysis
- 11.2.3.4. Recent Developments
- 11.2.3.5. Financials (Based on Availability)
- 11.2.4 Honeywell
- 11.2.4.1. Overview
- 11.2.4.2. Products
- 11.2.4.3. SWOT Analysis
- 11.2.4.4. Recent Developments
- 11.2.4.5. Financials (Based on Availability)
- 11.2.5 National Instruments
- 11.2.5.1. Overview
- 11.2.5.2. Products
- 11.2.5.3. SWOT Analysis
- 11.2.5.4. Recent Developments
- 11.2.5.5. Financials (Based on Availability)
- 11.2.6 Rockwell Automation
- 11.2.6.1. Overview
- 11.2.6.2. Products
- 11.2.6.3. SWOT Analysis
- 11.2.6.4. Recent Developments
- 11.2.6.5. Financials (Based on Availability)
- 11.2.7 ABB
- 11.2.7.1. Overview
- 11.2.7.2. Products
- 11.2.7.3. SWOT Analysis
- 11.2.7.4. Recent Developments
- 11.2.7.5. Financials (Based on Availability)
- 11.2.8 Siemens
- 11.2.8.1. Overview
- 11.2.8.2. Products
- 11.2.8.3. SWOT Analysis
- 11.2.8.4. Recent Developments
- 11.2.8.5. Financials (Based on Availability)
- 11.2.9 Azima DLI
- 11.2.9.1. Overview
- 11.2.9.2. Products
- 11.2.9.3. SWOT Analysis
- 11.2.9.4. Recent Developments
- 11.2.9.5. Financials (Based on Availability)
- 11.2.10 RMS
- 11.2.10.1. Overview
- 11.2.10.2. Products
- 11.2.10.3. SWOT Analysis
- 11.2.10.4. Recent Developments
- 11.2.10.5. Financials (Based on Availability)
- 11.2.11 Eaton Corporation
- 11.2.11.1. Overview
- 11.2.11.2. Products
- 11.2.11.3. SWOT Analysis
- 11.2.11.4. Recent Developments
- 11.2.11.5. Financials (Based on Availability)
- 11.2.12 Sensemore
- 11.2.12.1. Overview
- 11.2.12.2. Products
- 11.2.12.3. SWOT Analysis
- 11.2.12.4. Recent Developments
- 11.2.12.5. Financials (Based on Availability)
- 11.2.13 Sensoteq
- 11.2.13.1. Overview
- 11.2.13.2. Products
- 11.2.13.3. SWOT Analysis
- 11.2.13.4. Recent Developments
- 11.2.13.5. Financials (Based on Availability)
- 11.2.1 GE
List of Figures
- Figure 1: Global Rotating Equipment Condition Monitoring and Fault Analysis System Revenue Breakdown (billion, %) by Region 2025 & 2033
- Figure 2: North America Rotating Equipment Condition Monitoring and Fault Analysis System Revenue (billion), by Application 2025 & 2033
- Figure 3: North America Rotating Equipment Condition Monitoring and Fault Analysis System Revenue Share (%), by Application 2025 & 2033
- Figure 4: North America Rotating Equipment Condition Monitoring and Fault Analysis System Revenue (billion), by Types 2025 & 2033
- Figure 5: North America Rotating Equipment Condition Monitoring and Fault Analysis System Revenue Share (%), by Types 2025 & 2033
- Figure 6: North America Rotating Equipment Condition Monitoring and Fault Analysis System Revenue (billion), by Country 2025 & 2033
- Figure 7: North America Rotating Equipment Condition Monitoring and Fault Analysis System Revenue Share (%), by Country 2025 & 2033
- Figure 8: South America Rotating Equipment Condition Monitoring and Fault Analysis System Revenue (billion), by Application 2025 & 2033
- Figure 9: South America Rotating Equipment Condition Monitoring and Fault Analysis System Revenue Share (%), by Application 2025 & 2033
- Figure 10: South America Rotating Equipment Condition Monitoring and Fault Analysis System Revenue (billion), by Types 2025 & 2033
- Figure 11: South America Rotating Equipment Condition Monitoring and Fault Analysis System Revenue Share (%), by Types 2025 & 2033
- Figure 12: South America Rotating Equipment Condition Monitoring and Fault Analysis System Revenue (billion), by Country 2025 & 2033
- Figure 13: South America Rotating Equipment Condition Monitoring and Fault Analysis System Revenue Share (%), by Country 2025 & 2033
- Figure 14: Europe Rotating Equipment Condition Monitoring and Fault Analysis System Revenue (billion), by Application 2025 & 2033
- Figure 15: Europe Rotating Equipment Condition Monitoring and Fault Analysis System Revenue Share (%), by Application 2025 & 2033
- Figure 16: Europe Rotating Equipment Condition Monitoring and Fault Analysis System Revenue (billion), by Types 2025 & 2033
- Figure 17: Europe Rotating Equipment Condition Monitoring and Fault Analysis System Revenue Share (%), by Types 2025 & 2033
- Figure 18: Europe Rotating Equipment Condition Monitoring and Fault Analysis System Revenue (billion), by Country 2025 & 2033
- Figure 19: Europe Rotating Equipment Condition Monitoring and Fault Analysis System Revenue Share (%), by Country 2025 & 2033
- Figure 20: Middle East & Africa Rotating Equipment Condition Monitoring and Fault Analysis System Revenue (billion), by Application 2025 & 2033
- Figure 21: Middle East & Africa Rotating Equipment Condition Monitoring and Fault Analysis System Revenue Share (%), by Application 2025 & 2033
- Figure 22: Middle East & Africa Rotating Equipment Condition Monitoring and Fault Analysis System Revenue (billion), by Types 2025 & 2033
- Figure 23: Middle East & Africa Rotating Equipment Condition Monitoring and Fault Analysis System Revenue Share (%), by Types 2025 & 2033
- Figure 24: Middle East & Africa Rotating Equipment Condition Monitoring and Fault Analysis System Revenue (billion), by Country 2025 & 2033
- Figure 25: Middle East & Africa Rotating Equipment Condition Monitoring and Fault Analysis System Revenue Share (%), by Country 2025 & 2033
- Figure 26: Asia Pacific Rotating Equipment Condition Monitoring and Fault Analysis System Revenue (billion), by Application 2025 & 2033
- Figure 27: Asia Pacific Rotating Equipment Condition Monitoring and Fault Analysis System Revenue Share (%), by Application 2025 & 2033
- Figure 28: Asia Pacific Rotating Equipment Condition Monitoring and Fault Analysis System Revenue (billion), by Types 2025 & 2033
- Figure 29: Asia Pacific Rotating Equipment Condition Monitoring and Fault Analysis System Revenue Share (%), by Types 2025 & 2033
- Figure 30: Asia Pacific Rotating Equipment Condition Monitoring and Fault Analysis System Revenue (billion), by Country 2025 & 2033
- Figure 31: Asia Pacific Rotating Equipment Condition Monitoring and Fault Analysis System Revenue Share (%), by Country 2025 & 2033
List of Tables
- Table 1: Global Rotating Equipment Condition Monitoring and Fault Analysis System Revenue billion Forecast, by Application 2020 & 2033
- Table 2: Global Rotating Equipment Condition Monitoring and Fault Analysis System Revenue billion Forecast, by Types 2020 & 2033
- Table 3: Global Rotating Equipment Condition Monitoring and Fault Analysis System Revenue billion Forecast, by Region 2020 & 2033
- Table 4: Global Rotating Equipment Condition Monitoring and Fault Analysis System Revenue billion Forecast, by Application 2020 & 2033
- Table 5: Global Rotating Equipment Condition Monitoring and Fault Analysis System Revenue billion Forecast, by Types 2020 & 2033
- Table 6: Global Rotating Equipment Condition Monitoring and Fault Analysis System Revenue billion Forecast, by Country 2020 & 2033
- Table 7: United States Rotating Equipment Condition Monitoring and Fault Analysis System Revenue (billion) Forecast, by Application 2020 & 2033
- Table 8: Canada Rotating Equipment Condition Monitoring and Fault Analysis System Revenue (billion) Forecast, by Application 2020 & 2033
- Table 9: Mexico Rotating Equipment Condition Monitoring and Fault Analysis System Revenue (billion) Forecast, by Application 2020 & 2033
- Table 10: Global Rotating Equipment Condition Monitoring and Fault Analysis System Revenue billion Forecast, by Application 2020 & 2033
- Table 11: Global Rotating Equipment Condition Monitoring and Fault Analysis System Revenue billion Forecast, by Types 2020 & 2033
- Table 12: Global Rotating Equipment Condition Monitoring and Fault Analysis System Revenue billion Forecast, by Country 2020 & 2033
- Table 13: Brazil Rotating Equipment Condition Monitoring and Fault Analysis System Revenue (billion) Forecast, by Application 2020 & 2033
- Table 14: Argentina Rotating Equipment Condition Monitoring and Fault Analysis System Revenue (billion) Forecast, by Application 2020 & 2033
- Table 15: Rest of South America Rotating Equipment Condition Monitoring and Fault Analysis System Revenue (billion) Forecast, by Application 2020 & 2033
- Table 16: Global Rotating Equipment Condition Monitoring and Fault Analysis System Revenue billion Forecast, by Application 2020 & 2033
- Table 17: Global Rotating Equipment Condition Monitoring and Fault Analysis System Revenue billion Forecast, by Types 2020 & 2033
- Table 18: Global Rotating Equipment Condition Monitoring and Fault Analysis System Revenue billion Forecast, by Country 2020 & 2033
- Table 19: United Kingdom Rotating Equipment Condition Monitoring and Fault Analysis System Revenue (billion) Forecast, by Application 2020 & 2033
- Table 20: Germany Rotating Equipment Condition Monitoring and Fault Analysis System Revenue (billion) Forecast, by Application 2020 & 2033
- Table 21: France Rotating Equipment Condition Monitoring and Fault Analysis System Revenue (billion) Forecast, by Application 2020 & 2033
- Table 22: Italy Rotating Equipment Condition Monitoring and Fault Analysis System Revenue (billion) Forecast, by Application 2020 & 2033
- Table 23: Spain Rotating Equipment Condition Monitoring and Fault Analysis System Revenue (billion) Forecast, by Application 2020 & 2033
- Table 24: Russia Rotating Equipment Condition Monitoring and Fault Analysis System Revenue (billion) Forecast, by Application 2020 & 2033
- Table 25: Benelux Rotating Equipment Condition Monitoring and Fault Analysis System Revenue (billion) Forecast, by Application 2020 & 2033
- Table 26: Nordics Rotating Equipment Condition Monitoring and Fault Analysis System Revenue (billion) Forecast, by Application 2020 & 2033
- Table 27: Rest of Europe Rotating Equipment Condition Monitoring and Fault Analysis System Revenue (billion) Forecast, by Application 2020 & 2033
- Table 28: Global Rotating Equipment Condition Monitoring and Fault Analysis System Revenue billion Forecast, by Application 2020 & 2033
- Table 29: Global Rotating Equipment Condition Monitoring and Fault Analysis System Revenue billion Forecast, by Types 2020 & 2033
- Table 30: Global Rotating Equipment Condition Monitoring and Fault Analysis System Revenue billion Forecast, by Country 2020 & 2033
- Table 31: Turkey Rotating Equipment Condition Monitoring and Fault Analysis System Revenue (billion) Forecast, by Application 2020 & 2033
- Table 32: Israel Rotating Equipment Condition Monitoring and Fault Analysis System Revenue (billion) Forecast, by Application 2020 & 2033
- Table 33: GCC Rotating Equipment Condition Monitoring and Fault Analysis System Revenue (billion) Forecast, by Application 2020 & 2033
- Table 34: North Africa Rotating Equipment Condition Monitoring and Fault Analysis System Revenue (billion) Forecast, by Application 2020 & 2033
- Table 35: South Africa Rotating Equipment Condition Monitoring and Fault Analysis System Revenue (billion) Forecast, by Application 2020 & 2033
- Table 36: Rest of Middle East & Africa Rotating Equipment Condition Monitoring and Fault Analysis System Revenue (billion) Forecast, by Application 2020 & 2033
- Table 37: Global Rotating Equipment Condition Monitoring and Fault Analysis System Revenue billion Forecast, by Application 2020 & 2033
- Table 38: Global Rotating Equipment Condition Monitoring and Fault Analysis System Revenue billion Forecast, by Types 2020 & 2033
- Table 39: Global Rotating Equipment Condition Monitoring and Fault Analysis System Revenue billion Forecast, by Country 2020 & 2033
- Table 40: China Rotating Equipment Condition Monitoring and Fault Analysis System Revenue (billion) Forecast, by Application 2020 & 2033
- Table 41: India Rotating Equipment Condition Monitoring and Fault Analysis System Revenue (billion) Forecast, by Application 2020 & 2033
- Table 42: Japan Rotating Equipment Condition Monitoring and Fault Analysis System Revenue (billion) Forecast, by Application 2020 & 2033
- Table 43: South Korea Rotating Equipment Condition Monitoring and Fault Analysis System Revenue (billion) Forecast, by Application 2020 & 2033
- Table 44: ASEAN Rotating Equipment Condition Monitoring and Fault Analysis System Revenue (billion) Forecast, by Application 2020 & 2033
- Table 45: Oceania Rotating Equipment Condition Monitoring and Fault Analysis System Revenue (billion) Forecast, by Application 2020 & 2033
- Table 46: Rest of Asia Pacific Rotating Equipment Condition Monitoring and Fault Analysis System Revenue (billion) Forecast, by Application 2020 & 2033
Frequently Asked Questions
1. What is the projected Compound Annual Growth Rate (CAGR) of the Rotating Equipment Condition Monitoring and Fault Analysis System?
The projected CAGR is approximately 7%.
2. Which companies are prominent players in the Rotating Equipment Condition Monitoring and Fault Analysis System?
Key companies in the market include GE, Emerson, SKF, Honeywell, National Instruments, Rockwell Automation, ABB, Siemens, Azima DLI, RMS, Eaton Corporation, Sensemore, Sensoteq.
3. What are the main segments of the Rotating Equipment Condition Monitoring and Fault Analysis System?
The market segments include Application, Types.
4. Can you provide details about the market size?
The market size is estimated to be USD 3.78 billion as of 2022.
5. What are some drivers contributing to market growth?
N/A
6. What are the notable trends driving market growth?
N/A
7. Are there any restraints impacting market growth?
N/A
8. Can you provide examples of recent developments in the market?
N/A
9. What pricing options are available for accessing the report?
Pricing options include single-user, multi-user, and enterprise licenses priced at USD 2900.00, USD 4350.00, and USD 5800.00 respectively.
10. Is the market size provided in terms of value or volume?
The market size is provided in terms of value, measured in billion.
11. Are there any specific market keywords associated with the report?
Yes, the market keyword associated with the report is "Rotating Equipment Condition Monitoring and Fault Analysis System," which aids in identifying and referencing the specific market segment covered.
12. How do I determine which pricing option suits my needs best?
The pricing options vary based on user requirements and access needs. Individual users may opt for single-user licenses, while businesses requiring broader access may choose multi-user or enterprise licenses for cost-effective access to the report.
13. Are there any additional resources or data provided in the Rotating Equipment Condition Monitoring and Fault Analysis System report?
While the report offers comprehensive insights, it's advisable to review the specific contents or supplementary materials provided to ascertain if additional resources or data are available.
14. How can I stay updated on further developments or reports in the Rotating Equipment Condition Monitoring and Fault Analysis System?
To stay informed about further developments, trends, and reports in the Rotating Equipment Condition Monitoring and Fault Analysis System, consider subscribing to industry newsletters, following relevant companies and organizations, or regularly checking reputable industry news sources and publications.
Methodology
Step 1 - Identification of Relevant Samples Size from Population Database


Step 2 - Approaches for Defining Global Market Size (Value, Volume* & Price*)

Note*: In applicable scenarios
Step 3 - Data Sources
Primary Research
- Web Analytics
- Survey Reports
- Research Institute
- Latest Research Reports
- Opinion Leaders
Secondary Research
- Annual Reports
- White Paper
- Latest Press Release
- Industry Association
- Paid Database
- Investor Presentations

Step 4 - Data Triangulation
Involves using different sources of information in order to increase the validity of a study
These sources are likely to be stakeholders in a program - participants, other researchers, program staff, other community members, and so on.
Then we put all data in single framework & apply various statistical tools to find out the dynamic on the market.
During the analysis stage, feedback from the stakeholder groups would be compared to determine areas of agreement as well as areas of divergence