Satellite-based Earth Observation Market Navigating Dynamics Comprehensive Analysis and Forecasts 2025-2033

Satellite-based Earth Observation Market by Service (Data, Value-Added-Service), by Technology (Synthetic Aperture Radar (SAR), Optical), by Application (Urban Development (Includes Public Safety), Agriculture, Climate and Environment Services, Energy, Infrastructure Monitoring, Disaster and Emergency Management, Other Applications), by North America, by Europe, by Asia Pacific, by Middle East and Africa, by Latin America Forecast 2025-2033

Jul 23 2025
Base Year: 2024

234 Pages
Main Logo

Satellite-based Earth Observation Market Navigating Dynamics Comprehensive Analysis and Forecasts 2025-2033


Home
Industries
Technology, Media and Telecom
sponsor image
sponsor image
sponsor image
sponsor image
sponsor image
sponsor image
sponsor image
sponsor image
sponsor image
sponsor image
sponsor image
sponsor image
sponsor image
sponsor image
sponsor image
sponsor image
sponsor image
sponsor image
sponsor image
sponsor image

Tailored for you

  • In-depth Analysis Tailored to Specified Regions or Segments
  • Company Profiles Customized to User Preferences
  • Comprehensive Insights Focused on Specific Segments or Regions
  • Customized Evaluation of Competitive Landscape to Meet Your Needs
  • Tailored Customization to Address Other Specific Requirements
Ask for customization


Key Insights

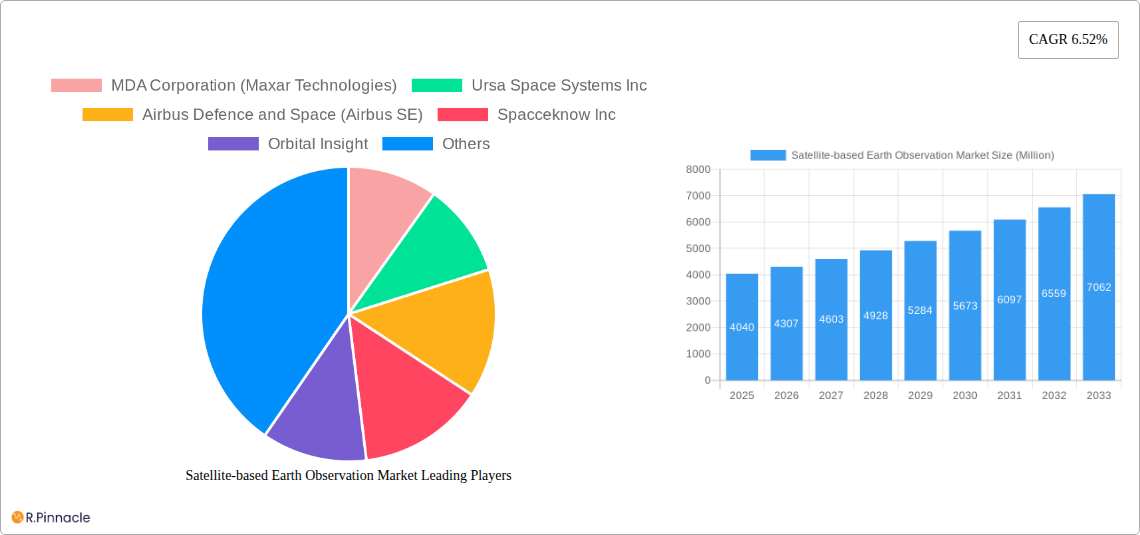
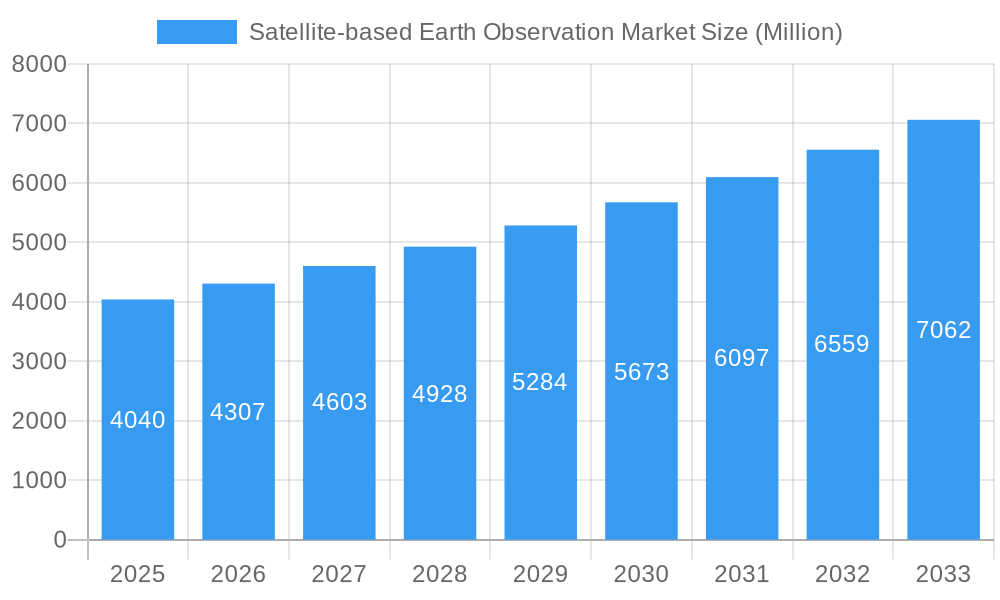
The global satellite-based Earth observation market is experiencing robust growth, projected to reach \$4.04 billion in 2025 and maintain a Compound Annual Growth Rate (CAGR) of 6.52% from 2025 to 2033. This expansion is driven by several key factors. Increasing demand for precise and timely geospatial data across diverse sectors fuels market growth. The agricultural sector leverages satellite imagery for precision farming, optimizing resource allocation and improving crop yields. Urban development benefits from satellite data for infrastructure planning, public safety monitoring, and efficient resource management. Furthermore, the critical role of satellite imagery in climate change monitoring, disaster response, and environmental protection is significantly contributing to market expansion. Technological advancements in sensor technology, particularly in Synthetic Aperture Radar (SAR) and high-resolution optical imagery, are improving data quality and accessibility, driving adoption. The market is segmented by service type (data and value-added services), technology (SAR and optical), and application (urban development, agriculture, climate monitoring, energy, infrastructure, disaster management, etc.). Competition is intense, with key players including Maxar Technologies, Airbus Defence and Space, Ursa Space Systems, Planet Labs, and Capella Space constantly innovating to offer advanced solutions and enhance market penetration. The North American market currently holds a significant share, but the Asia-Pacific region is poised for substantial growth driven by increasing investments in infrastructure and technological advancements.

The market's continued growth will be influenced by several factors. Government initiatives promoting the use of geospatial data for national development and environmental protection will provide significant impetus. The increasing affordability of satellite data and advanced analytics tools will broaden access across various sectors, stimulating demand. However, challenges remain, including data security concerns, regulatory hurdles surrounding data usage, and the need for skilled professionals to interpret and analyze the complex datasets. The successful navigation of these challenges will be crucial in ensuring the continued growth trajectory of the satellite-based Earth observation market. Furthermore, the development of smaller, more affordable satellites and constellations will democratize access to data and spur innovation, leading to new applications and market opportunities.

Satellite-based Earth Observation Market Report: 2019-2033

This comprehensive report provides an in-depth analysis of the Satellite-based Earth Observation market, offering actionable insights for industry professionals and strategic decision-makers. Covering the period 2019-2033, with a base year of 2025 and a forecast period of 2025-2033, this report delivers a detailed examination of market dynamics, key players, and emerging trends. The market is valued at xx Million in 2025 and is projected to reach xx Million by 2033, exhibiting a CAGR of xx% during the forecast period.

Satellite-based Earth Observation Market Research Report - Market Size, Growth & Forecast

Satellite-based Earth Observation Market Market Structure & Innovation Trends

The satellite-based Earth observation market exhibits a moderately concentrated structure, with several major players holding significant market share. MDA Corporation (Maxar Technologies), Airbus Defence and Space (Airbus SE), and Planet Labs PBC are among the leading companies, collectively accounting for an estimated xx% of the market share in 2025. However, the market also features numerous smaller, specialized companies, fostering innovation and competition.

  • Market Concentration: High concentration in certain segments (e.g., SAR technology) and fragmented in others (e.g., Value-added services).
  • Innovation Drivers: Advancements in sensor technology (e.g., hyperspectral imaging), increased processing power, and the development of AI-powered analytics are key drivers.
  • Regulatory Frameworks: Government regulations concerning data privacy, security, and access significantly impact market growth and operational procedures. Variations in regulations across different geographies present challenges.
  • Product Substitutes: While satellite imagery is unique, alternative data sources like aerial photography and LiDAR offer some level of substitution, but with limitations in coverage and detail.
  • End-User Demographics: The market is diverse, with customers ranging from government agencies (defense, environmental protection) to private sector organizations (agriculture, energy, infrastructure).
  • M&A Activities: The industry has seen significant M&A activity in recent years, with deal values totaling an estimated xx Million in the period 2019-2024. These acquisitions have largely focused on consolidating technology capabilities and expanding market reach.
Satellite-based Earth Observation Market Growth

Satellite-based Earth Observation Market Market Dynamics & Trends

The satellite-based Earth observation market is experiencing robust growth, driven by several key factors. The increasing demand for high-resolution imagery and analytics across various sectors such as agriculture, urban development, and environmental monitoring is a primary driver. Technological advancements, including the development of miniaturized satellites and improved sensor technologies, are fueling market expansion. Furthermore, the rising adoption of cloud-based platforms for data processing and analysis is enhancing accessibility and affordability, broadening market penetration. The competitive landscape is characterized by both intense competition among established players and the emergence of new entrants with innovative solutions. This is further fueled by the decreasing cost of launching and operating satellites. The market is expected to witness a significant increase in the adoption of AI and machine learning algorithms for image processing and data analysis, further improving accuracy and efficiency.

Satellite-based Earth Observation Market Growth

Dominant Regions & Segments in Satellite-based Earth Observation Market

The North American region currently dominates the global satellite-based Earth observation market, driven by substantial investments in space technology, a strong presence of major players, and high demand from government and commercial sectors. However, Asia-Pacific is witnessing rapid growth due to increasing urbanization, infrastructure development, and government initiatives to monitor natural resources and environmental changes. Within market segments:

  • By Service: The Data segment holds the largest market share, with Value-Added Services witnessing the fastest growth.

  • By Technology: Optical imagery currently dominates, but Synthetic Aperture Radar (SAR) is experiencing significant growth due to its all-weather capabilities.

  • By Application: Agriculture, Urban Development (including Public Safety), and Climate and Environment Services are the largest application segments. Disaster and Emergency Management is also a rapidly growing sector.

  • Key Drivers (North America): Robust government funding for space research and defense, strong private sector investment, advanced technological capabilities, well-established infrastructure.

  • Key Drivers (Asia-Pacific): Rapid urbanization and infrastructure development, increased awareness of environmental monitoring, government support for technological advancement.

Satellite-based Earth Observation Market Product Innovations

Recent product innovations focus on enhancing image resolution, expanding spectral range, and improving data processing capabilities. The integration of AI and machine learning into satellite imagery analysis is revolutionizing data interpretation, enabling faster and more accurate insights. New satellite constellations are providing more frequent and higher-resolution data, making real-time monitoring feasible across various applications. Miniaturization of satellites has reduced launch costs, allowing for greater accessibility and deployment of satellite networks.

Report Scope & Segmentation Analysis

This report segments the market by service (Data, Value-Added Services), technology (Optical, SAR), and application (Agriculture, Urban Development, Climate & Environment, Energy, Infrastructure, Disaster Management, Other). Each segment is analyzed based on its market size, growth rate, competitive landscape, and key drivers. The Data segment is expected to maintain its dominant position, while Value-Added Services will showcase higher growth rates. Optical technology will continue to hold a larger share compared to SAR, albeit with SAR experiencing strong growth due to the ability to penetrate cloud cover. Growth projections vary across applications, with Urban Development, Agriculture and Climate and Environment showing significant potential.

Key Drivers of Satellite-based Earth Observation Market Growth

Several factors drive market expansion:

  • Technological advancements: Enhanced sensor technology, AI-powered analytics, and miniaturized satellites.
  • Increased demand: Rising need for accurate and timely information across various sectors, particularly for monitoring environmental changes, infrastructure, and urban development.
  • Government initiatives: Investment in space programs and initiatives promoting the use of Earth observation data for various applications.
  • Falling launch costs: Reduction in the cost of launching satellites, making space-based data acquisition more affordable.

Challenges in the Satellite-based Earth Observation Market Sector

The market faces challenges, including:

  • Data security and privacy concerns: Protecting sensitive information necessitates robust security measures.
  • High initial investment costs: Developing and deploying satellite constellations requires significant upfront investment.
  • Regulatory hurdles: Navigating complex regulations surrounding data ownership and usage across different jurisdictions.
  • Competition: Increased competition among established players and new entrants might impact market prices and profitability.

Emerging Opportunities in Satellite-based Earth Observation Market

Emerging trends create significant opportunities:

  • Expansion into new applications: Growing adoption in precision agriculture, autonomous vehicles, and environmental monitoring.
  • Development of new sensor technologies: Hyperspectral imaging and LiDAR integration offer increased data richness.
  • Integration with IoT: Connecting satellite data with ground-based IoT sensors for comprehensive monitoring solutions.
  • Focus on sustainable solutions: Increasing demand for solutions addressing climate change and environmental sustainability.

Leading Players in the Satellite-based Earth Observation Market Market

  • MDA Corporation (Maxar Technologies)
  • Ursa Space Systems Inc
  • Airbus Defence and Space (Airbus SE)
  • Spacceknow Inc
  • Orbital Insight
  • BLACKSKY TECHNOLOGY INC
  • ESRI INC
  • PlanetIQ LLC
  • L3harris Technologies Inc
  • Descartes Lab
  • PLANET LABS PBC
  • EOS Data Analytics Inc
  • Capella Space
  • IMAGESAT International (I S I) LTD
  • ICEYE

Key Developments in Satellite-based Earth Observation Market Industry

  • March 2024: Planet Labs awarded a US Navy contract for maritime surveillance, leveraging AI-powered analytics.
  • March 2024: ICEYE launched ICEYE Ocean Vision, a SAR product family for enhanced maritime domain awareness.

Future Outlook for Satellite-based Earth Observation Market Market

The satellite-based Earth observation market is poised for continued strong growth, driven by technological advancements, increasing demand across diverse sectors, and the growing importance of monitoring environmental changes and infrastructure development. Strategic partnerships, mergers, and acquisitions will continue to shape the market landscape. The integration of AI and IoT technologies will create further opportunities for innovation and market expansion. The market's future potential is substantial, with significant opportunities for companies that can deliver innovative and cost-effective solutions.

Satellite-based Earth Observation Market Segmentation

  • 1. Service
    • 1.1. Data
    • 1.2. Value-Added-Service
  • 2. Technology
    • 2.1. Synthetic Aperture Radar (SAR)
    • 2.2. Optical
  • 3. Application
    • 3.1. Urban Development (Includes Public Safety)
    • 3.2. Agriculture
    • 3.3. Climate and Environment Services
    • 3.4. Energy
    • 3.5. Infrastructure Monitoring
    • 3.6. Disaster and Emergency Management
    • 3.7. Other Applications

Satellite-based Earth Observation Market Segmentation By Geography

  • 1. North America
  • 2. Europe
  • 3. Asia Pacific
  • 4. Middle East and Africa
  • 5. Latin America
Satellite-based Earth Observation Market Regional Share


Satellite-based Earth Observation Market REPORT HIGHLIGHTS

AspectsDetails
Study Period 2019-2033
Base Year 2024
Estimated Year 2025
Forecast Period2025-2033
Historical Period2019-2024
Growth RateCAGR of 6.52% from 2019-2033
Segmentation
    • By Service
      • Data
      • Value-Added-Service
    • By Technology
      • Synthetic Aperture Radar (SAR)
      • Optical
    • By Application
      • Urban Development (Includes Public Safety)
      • Agriculture
      • Climate and Environment Services
      • Energy
      • Infrastructure Monitoring
      • Disaster and Emergency Management
      • Other Applications
  • By Geography
    • North America
    • Europe
    • Asia Pacific
    • Middle East and Africa
    • Latin America


Table of Contents

  1. 1. Introduction
    • 1.1. Research Scope
    • 1.2. Market Segmentation
    • 1.3. Research Methodology
    • 1.4. Definitions and Assumptions
  2. 2. Executive Summary
    • 2.1. Introduction
  3. 3. Market Dynamics
    • 3.1. Introduction
      • 3.2. Market Drivers
        • 3.2.1. Increasing Requirement for Efficient Monitoring of Vast Land Areas; Rising Smart City Initiatives; Big Data and Imagery Analytics
      • 3.3. Market Restrains
        • 3.3.1. Availability of Open-source Data for Various Countries
      • 3.4. Market Trends
        • 3.4.1. Urban Development to be the Fastest Growing Application
  4. 4. Market Factor Analysis
    • 4.1. Porters Five Forces
    • 4.2. Supply/Value Chain
    • 4.3. PESTEL analysis
    • 4.4. Market Entropy
    • 4.5. Patent/Trademark Analysis
  5. 5. Global Satellite-based Earth Observation Market Analysis, Insights and Forecast, 2019-2031
    • 5.1. Market Analysis, Insights and Forecast - by Service
      • 5.1.1. Data
      • 5.1.2. Value-Added-Service
    • 5.2. Market Analysis, Insights and Forecast - by Technology
      • 5.2.1. Synthetic Aperture Radar (SAR)
      • 5.2.2. Optical
    • 5.3. Market Analysis, Insights and Forecast - by Application
      • 5.3.1. Urban Development (Includes Public Safety)
      • 5.3.2. Agriculture
      • 5.3.3. Climate and Environment Services
      • 5.3.4. Energy
      • 5.3.5. Infrastructure Monitoring
      • 5.3.6. Disaster and Emergency Management
      • 5.3.7. Other Applications
    • 5.4. Market Analysis, Insights and Forecast - by Region
      • 5.4.1. North America
      • 5.4.2. Europe
      • 5.4.3. Asia Pacific
      • 5.4.4. Middle East and Africa
      • 5.4.5. Latin America
  6. 6. North America Satellite-based Earth Observation Market Analysis, Insights and Forecast, 2019-2031
    • 6.1. Market Analysis, Insights and Forecast - by Service
      • 6.1.1. Data
      • 6.1.2. Value-Added-Service
    • 6.2. Market Analysis, Insights and Forecast - by Technology
      • 6.2.1. Synthetic Aperture Radar (SAR)
      • 6.2.2. Optical
    • 6.3. Market Analysis, Insights and Forecast - by Application
      • 6.3.1. Urban Development (Includes Public Safety)
      • 6.3.2. Agriculture
      • 6.3.3. Climate and Environment Services
      • 6.3.4. Energy
      • 6.3.5. Infrastructure Monitoring
      • 6.3.6. Disaster and Emergency Management
      • 6.3.7. Other Applications
  7. 7. Europe Satellite-based Earth Observation Market Analysis, Insights and Forecast, 2019-2031
    • 7.1. Market Analysis, Insights and Forecast - by Service
      • 7.1.1. Data
      • 7.1.2. Value-Added-Service
    • 7.2. Market Analysis, Insights and Forecast - by Technology
      • 7.2.1. Synthetic Aperture Radar (SAR)
      • 7.2.2. Optical
    • 7.3. Market Analysis, Insights and Forecast - by Application
      • 7.3.1. Urban Development (Includes Public Safety)
      • 7.3.2. Agriculture
      • 7.3.3. Climate and Environment Services
      • 7.3.4. Energy
      • 7.3.5. Infrastructure Monitoring
      • 7.3.6. Disaster and Emergency Management
      • 7.3.7. Other Applications
  8. 8. Asia Pacific Satellite-based Earth Observation Market Analysis, Insights and Forecast, 2019-2031
    • 8.1. Market Analysis, Insights and Forecast - by Service
      • 8.1.1. Data
      • 8.1.2. Value-Added-Service
    • 8.2. Market Analysis, Insights and Forecast - by Technology
      • 8.2.1. Synthetic Aperture Radar (SAR)
      • 8.2.2. Optical
    • 8.3. Market Analysis, Insights and Forecast - by Application
      • 8.3.1. Urban Development (Includes Public Safety)
      • 8.3.2. Agriculture
      • 8.3.3. Climate and Environment Services
      • 8.3.4. Energy
      • 8.3.5. Infrastructure Monitoring
      • 8.3.6. Disaster and Emergency Management
      • 8.3.7. Other Applications
  9. 9. Middle East and Africa Satellite-based Earth Observation Market Analysis, Insights and Forecast, 2019-2031
    • 9.1. Market Analysis, Insights and Forecast - by Service
      • 9.1.1. Data
      • 9.1.2. Value-Added-Service
    • 9.2. Market Analysis, Insights and Forecast - by Technology
      • 9.2.1. Synthetic Aperture Radar (SAR)
      • 9.2.2. Optical
    • 9.3. Market Analysis, Insights and Forecast - by Application
      • 9.3.1. Urban Development (Includes Public Safety)
      • 9.3.2. Agriculture
      • 9.3.3. Climate and Environment Services
      • 9.3.4. Energy
      • 9.3.5. Infrastructure Monitoring
      • 9.3.6. Disaster and Emergency Management
      • 9.3.7. Other Applications
  10. 10. Latin America Satellite-based Earth Observation Market Analysis, Insights and Forecast, 2019-2031
    • 10.1. Market Analysis, Insights and Forecast - by Service
      • 10.1.1. Data
      • 10.1.2. Value-Added-Service
    • 10.2. Market Analysis, Insights and Forecast - by Technology
      • 10.2.1. Synthetic Aperture Radar (SAR)
      • 10.2.2. Optical
    • 10.3. Market Analysis, Insights and Forecast - by Application
      • 10.3.1. Urban Development (Includes Public Safety)
      • 10.3.2. Agriculture
      • 10.3.3. Climate and Environment Services
      • 10.3.4. Energy
      • 10.3.5. Infrastructure Monitoring
      • 10.3.6. Disaster and Emergency Management
      • 10.3.7. Other Applications
  11. 11. North America Satellite-based Earth Observation Market Analysis, Insights and Forecast, 2019-2031
      • 11.1. Market Analysis, Insights and Forecast - By Country/Sub-region
        • 11.1.1 United States
        • 11.1.2 Canada
        • 11.1.3 Mexico
  12. 12. Europe Satellite-based Earth Observation Market Analysis, Insights and Forecast, 2019-2031
      • 12.1. Market Analysis, Insights and Forecast - By Country/Sub-region
        • 12.1.1 Germany
        • 12.1.2 United Kingdom
        • 12.1.3 France
        • 12.1.4 Spain
        • 12.1.5 Italy
        • 12.1.6 Spain
        • 12.1.7 Belgium
        • 12.1.8 Netherland
        • 12.1.9 Nordics
        • 12.1.10 Rest of Europe
  13. 13. Asia Pacific Satellite-based Earth Observation Market Analysis, Insights and Forecast, 2019-2031
      • 13.1. Market Analysis, Insights and Forecast - By Country/Sub-region
        • 13.1.1 China
        • 13.1.2 Japan
        • 13.1.3 India
        • 13.1.4 South Korea
        • 13.1.5 Southeast Asia
        • 13.1.6 Australia
        • 13.1.7 Indonesia
        • 13.1.8 Phillipes
        • 13.1.9 Singapore
        • 13.1.10 Thailandc
        • 13.1.11 Rest of Asia Pacific
  14. 14. South America Satellite-based Earth Observation Market Analysis, Insights and Forecast, 2019-2031
      • 14.1. Market Analysis, Insights and Forecast - By Country/Sub-region
        • 14.1.1 Brazil
        • 14.1.2 Argentina
        • 14.1.3 Peru
        • 14.1.4 Chile
        • 14.1.5 Colombia
        • 14.1.6 Ecuador
        • 14.1.7 Venezuela
        • 14.1.8 Rest of South America
  15. 15. North America Satellite-based Earth Observation Market Analysis, Insights and Forecast, 2019-2031
      • 15.1. Market Analysis, Insights and Forecast - By Country/Sub-region
        • 15.1.1 United States
        • 15.1.2 Canada
        • 15.1.3 Mexico
  16. 16. MEA Satellite-based Earth Observation Market Analysis, Insights and Forecast, 2019-2031
      • 16.1. Market Analysis, Insights and Forecast - By Country/Sub-region
        • 16.1.1 United Arab Emirates
        • 16.1.2 Saudi Arabia
        • 16.1.3 South Africa
        • 16.1.4 Rest of Middle East and Africa
  17. 17. Competitive Analysis
    • 17.1. Global Market Share Analysis 2024
      • 17.2. Company Profiles
        • 17.2.1 MDA Corporation (Maxar Technologies)
          • 17.2.1.1. Overview
          • 17.2.1.2. Products
          • 17.2.1.3. SWOT Analysis
          • 17.2.1.4. Recent Developments
          • 17.2.1.5. Financials (Based on Availability)
        • 17.2.2 Ursa Space Systems Inc
          • 17.2.2.1. Overview
          • 17.2.2.2. Products
          • 17.2.2.3. SWOT Analysis
          • 17.2.2.4. Recent Developments
          • 17.2.2.5. Financials (Based on Availability)
        • 17.2.3 Airbus Defence and Space (Airbus SE)
          • 17.2.3.1. Overview
          • 17.2.3.2. Products
          • 17.2.3.3. SWOT Analysis
          • 17.2.3.4. Recent Developments
          • 17.2.3.5. Financials (Based on Availability)
        • 17.2.4 Spacceknow Inc
          • 17.2.4.1. Overview
          • 17.2.4.2. Products
          • 17.2.4.3. SWOT Analysis
          • 17.2.4.4. Recent Developments
          • 17.2.4.5. Financials (Based on Availability)
        • 17.2.5 Orbital Insight
          • 17.2.5.1. Overview
          • 17.2.5.2. Products
          • 17.2.5.3. SWOT Analysis
          • 17.2.5.4. Recent Developments
          • 17.2.5.5. Financials (Based on Availability)
        • 17.2.6 BLACKSKY TECHNOLOGY INC
          • 17.2.6.1. Overview
          • 17.2.6.2. Products
          • 17.2.6.3. SWOT Analysis
          • 17.2.6.4. Recent Developments
          • 17.2.6.5. Financials (Based on Availability)
        • 17.2.7 ESRI INC
          • 17.2.7.1. Overview
          • 17.2.7.2. Products
          • 17.2.7.3. SWOT Analysis
          • 17.2.7.4. Recent Developments
          • 17.2.7.5. Financials (Based on Availability)
        • 17.2.8 PlanetIQ LLC
          • 17.2.8.1. Overview
          • 17.2.8.2. Products
          • 17.2.8.3. SWOT Analysis
          • 17.2.8.4. Recent Developments
          • 17.2.8.5. Financials (Based on Availability)
        • 17.2.9 L3harris Technologies Inc
          • 17.2.9.1. Overview
          • 17.2.9.2. Products
          • 17.2.9.3. SWOT Analysis
          • 17.2.9.4. Recent Developments
          • 17.2.9.5. Financials (Based on Availability)
        • 17.2.10 Descartes Lab
          • 17.2.10.1. Overview
          • 17.2.10.2. Products
          • 17.2.10.3. SWOT Analysis
          • 17.2.10.4. Recent Developments
          • 17.2.10.5. Financials (Based on Availability)
        • 17.2.11 PLANET LABS PBC
          • 17.2.11.1. Overview
          • 17.2.11.2. Products
          • 17.2.11.3. SWOT Analysis
          • 17.2.11.4. Recent Developments
          • 17.2.11.5. Financials (Based on Availability)
        • 17.2.12 EOS Data Analytics Inc
          • 17.2.12.1. Overview
          • 17.2.12.2. Products
          • 17.2.12.3. SWOT Analysis
          • 17.2.12.4. Recent Developments
          • 17.2.12.5. Financials (Based on Availability)
        • 17.2.13 Capella Space
          • 17.2.13.1. Overview
          • 17.2.13.2. Products
          • 17.2.13.3. SWOT Analysis
          • 17.2.13.4. Recent Developments
          • 17.2.13.5. Financials (Based on Availability)
        • 17.2.14 IMAGESAT International (I S I) LTD
          • 17.2.14.1. Overview
          • 17.2.14.2. Products
          • 17.2.14.3. SWOT Analysis
          • 17.2.14.4. Recent Developments
          • 17.2.14.5. Financials (Based on Availability)
        • 17.2.15 ICEYE
          • 17.2.15.1. Overview
          • 17.2.15.2. Products
          • 17.2.15.3. SWOT Analysis
          • 17.2.15.4. Recent Developments
          • 17.2.15.5. Financials (Based on Availability)

List of Figures

  1. Figure 1: Global Satellite-based Earth Observation Market Revenue Breakdown (Million, %) by Region 2024 & 2032
  2. Figure 2: Global Satellite-based Earth Observation Market Volume Breakdown (K Unit, %) by Region 2024 & 2032
  3. Figure 3: North America Satellite-based Earth Observation Market Revenue (Million), by Country 2024 & 2032
  4. Figure 4: North America Satellite-based Earth Observation Market Volume (K Unit), by Country 2024 & 2032
  5. Figure 5: North America Satellite-based Earth Observation Market Revenue Share (%), by Country 2024 & 2032
  6. Figure 6: North America Satellite-based Earth Observation Market Volume Share (%), by Country 2024 & 2032
  7. Figure 7: Europe Satellite-based Earth Observation Market Revenue (Million), by Country 2024 & 2032
  8. Figure 8: Europe Satellite-based Earth Observation Market Volume (K Unit), by Country 2024 & 2032
  9. Figure 9: Europe Satellite-based Earth Observation Market Revenue Share (%), by Country 2024 & 2032
  10. Figure 10: Europe Satellite-based Earth Observation Market Volume Share (%), by Country 2024 & 2032
  11. Figure 11: Asia Pacific Satellite-based Earth Observation Market Revenue (Million), by Country 2024 & 2032
  12. Figure 12: Asia Pacific Satellite-based Earth Observation Market Volume (K Unit), by Country 2024 & 2032
  13. Figure 13: Asia Pacific Satellite-based Earth Observation Market Revenue Share (%), by Country 2024 & 2032
  14. Figure 14: Asia Pacific Satellite-based Earth Observation Market Volume Share (%), by Country 2024 & 2032
  15. Figure 15: South America Satellite-based Earth Observation Market Revenue (Million), by Country 2024 & 2032
  16. Figure 16: South America Satellite-based Earth Observation Market Volume (K Unit), by Country 2024 & 2032
  17. Figure 17: South America Satellite-based Earth Observation Market Revenue Share (%), by Country 2024 & 2032
  18. Figure 18: South America Satellite-based Earth Observation Market Volume Share (%), by Country 2024 & 2032
  19. Figure 19: North America Satellite-based Earth Observation Market Revenue (Million), by Country 2024 & 2032
  20. Figure 20: North America Satellite-based Earth Observation Market Volume (K Unit), by Country 2024 & 2032
  21. Figure 21: North America Satellite-based Earth Observation Market Revenue Share (%), by Country 2024 & 2032
  22. Figure 22: North America Satellite-based Earth Observation Market Volume Share (%), by Country 2024 & 2032
  23. Figure 23: MEA Satellite-based Earth Observation Market Revenue (Million), by Country 2024 & 2032
  24. Figure 24: MEA Satellite-based Earth Observation Market Volume (K Unit), by Country 2024 & 2032
  25. Figure 25: MEA Satellite-based Earth Observation Market Revenue Share (%), by Country 2024 & 2032
  26. Figure 26: MEA Satellite-based Earth Observation Market Volume Share (%), by Country 2024 & 2032
  27. Figure 27: North America Satellite-based Earth Observation Market Revenue (Million), by Service 2024 & 2032
  28. Figure 28: North America Satellite-based Earth Observation Market Volume (K Unit), by Service 2024 & 2032
  29. Figure 29: North America Satellite-based Earth Observation Market Revenue Share (%), by Service 2024 & 2032
  30. Figure 30: North America Satellite-based Earth Observation Market Volume Share (%), by Service 2024 & 2032
  31. Figure 31: North America Satellite-based Earth Observation Market Revenue (Million), by Technology 2024 & 2032
  32. Figure 32: North America Satellite-based Earth Observation Market Volume (K Unit), by Technology 2024 & 2032
  33. Figure 33: North America Satellite-based Earth Observation Market Revenue Share (%), by Technology 2024 & 2032
  34. Figure 34: North America Satellite-based Earth Observation Market Volume Share (%), by Technology 2024 & 2032
  35. Figure 35: North America Satellite-based Earth Observation Market Revenue (Million), by Application 2024 & 2032
  36. Figure 36: North America Satellite-based Earth Observation Market Volume (K Unit), by Application 2024 & 2032
  37. Figure 37: North America Satellite-based Earth Observation Market Revenue Share (%), by Application 2024 & 2032
  38. Figure 38: North America Satellite-based Earth Observation Market Volume Share (%), by Application 2024 & 2032
  39. Figure 39: North America Satellite-based Earth Observation Market Revenue (Million), by Country 2024 & 2032
  40. Figure 40: North America Satellite-based Earth Observation Market Volume (K Unit), by Country 2024 & 2032
  41. Figure 41: North America Satellite-based Earth Observation Market Revenue Share (%), by Country 2024 & 2032
  42. Figure 42: North America Satellite-based Earth Observation Market Volume Share (%), by Country 2024 & 2032
  43. Figure 43: Europe Satellite-based Earth Observation Market Revenue (Million), by Service 2024 & 2032
  44. Figure 44: Europe Satellite-based Earth Observation Market Volume (K Unit), by Service 2024 & 2032
  45. Figure 45: Europe Satellite-based Earth Observation Market Revenue Share (%), by Service 2024 & 2032
  46. Figure 46: Europe Satellite-based Earth Observation Market Volume Share (%), by Service 2024 & 2032
  47. Figure 47: Europe Satellite-based Earth Observation Market Revenue (Million), by Technology 2024 & 2032
  48. Figure 48: Europe Satellite-based Earth Observation Market Volume (K Unit), by Technology 2024 & 2032
  49. Figure 49: Europe Satellite-based Earth Observation Market Revenue Share (%), by Technology 2024 & 2032
  50. Figure 50: Europe Satellite-based Earth Observation Market Volume Share (%), by Technology 2024 & 2032
  51. Figure 51: Europe Satellite-based Earth Observation Market Revenue (Million), by Application 2024 & 2032
  52. Figure 52: Europe Satellite-based Earth Observation Market Volume (K Unit), by Application 2024 & 2032
  53. Figure 53: Europe Satellite-based Earth Observation Market Revenue Share (%), by Application 2024 & 2032
  54. Figure 54: Europe Satellite-based Earth Observation Market Volume Share (%), by Application 2024 & 2032
  55. Figure 55: Europe Satellite-based Earth Observation Market Revenue (Million), by Country 2024 & 2032
  56. Figure 56: Europe Satellite-based Earth Observation Market Volume (K Unit), by Country 2024 & 2032
  57. Figure 57: Europe Satellite-based Earth Observation Market Revenue Share (%), by Country 2024 & 2032
  58. Figure 58: Europe Satellite-based Earth Observation Market Volume Share (%), by Country 2024 & 2032
  59. Figure 59: Asia Pacific Satellite-based Earth Observation Market Revenue (Million), by Service 2024 & 2032
  60. Figure 60: Asia Pacific Satellite-based Earth Observation Market Volume (K Unit), by Service 2024 & 2032
  61. Figure 61: Asia Pacific Satellite-based Earth Observation Market Revenue Share (%), by Service 2024 & 2032
  62. Figure 62: Asia Pacific Satellite-based Earth Observation Market Volume Share (%), by Service 2024 & 2032
  63. Figure 63: Asia Pacific Satellite-based Earth Observation Market Revenue (Million), by Technology 2024 & 2032
  64. Figure 64: Asia Pacific Satellite-based Earth Observation Market Volume (K Unit), by Technology 2024 & 2032
  65. Figure 65: Asia Pacific Satellite-based Earth Observation Market Revenue Share (%), by Technology 2024 & 2032
  66. Figure 66: Asia Pacific Satellite-based Earth Observation Market Volume Share (%), by Technology 2024 & 2032
  67. Figure 67: Asia Pacific Satellite-based Earth Observation Market Revenue (Million), by Application 2024 & 2032
  68. Figure 68: Asia Pacific Satellite-based Earth Observation Market Volume (K Unit), by Application 2024 & 2032
  69. Figure 69: Asia Pacific Satellite-based Earth Observation Market Revenue Share (%), by Application 2024 & 2032
  70. Figure 70: Asia Pacific Satellite-based Earth Observation Market Volume Share (%), by Application 2024 & 2032
  71. Figure 71: Asia Pacific Satellite-based Earth Observation Market Revenue (Million), by Country 2024 & 2032
  72. Figure 72: Asia Pacific Satellite-based Earth Observation Market Volume (K Unit), by Country 2024 & 2032
  73. Figure 73: Asia Pacific Satellite-based Earth Observation Market Revenue Share (%), by Country 2024 & 2032
  74. Figure 74: Asia Pacific Satellite-based Earth Observation Market Volume Share (%), by Country 2024 & 2032
  75. Figure 75: Middle East and Africa Satellite-based Earth Observation Market Revenue (Million), by Service 2024 & 2032
  76. Figure 76: Middle East and Africa Satellite-based Earth Observation Market Volume (K Unit), by Service 2024 & 2032
  77. Figure 77: Middle East and Africa Satellite-based Earth Observation Market Revenue Share (%), by Service 2024 & 2032
  78. Figure 78: Middle East and Africa Satellite-based Earth Observation Market Volume Share (%), by Service 2024 & 2032
  79. Figure 79: Middle East and Africa Satellite-based Earth Observation Market Revenue (Million), by Technology 2024 & 2032
  80. Figure 80: Middle East and Africa Satellite-based Earth Observation Market Volume (K Unit), by Technology 2024 & 2032
  81. Figure 81: Middle East and Africa Satellite-based Earth Observation Market Revenue Share (%), by Technology 2024 & 2032
  82. Figure 82: Middle East and Africa Satellite-based Earth Observation Market Volume Share (%), by Technology 2024 & 2032
  83. Figure 83: Middle East and Africa Satellite-based Earth Observation Market Revenue (Million), by Application 2024 & 2032
  84. Figure 84: Middle East and Africa Satellite-based Earth Observation Market Volume (K Unit), by Application 2024 & 2032
  85. Figure 85: Middle East and Africa Satellite-based Earth Observation Market Revenue Share (%), by Application 2024 & 2032
  86. Figure 86: Middle East and Africa Satellite-based Earth Observation Market Volume Share (%), by Application 2024 & 2032
  87. Figure 87: Middle East and Africa Satellite-based Earth Observation Market Revenue (Million), by Country 2024 & 2032
  88. Figure 88: Middle East and Africa Satellite-based Earth Observation Market Volume (K Unit), by Country 2024 & 2032
  89. Figure 89: Middle East and Africa Satellite-based Earth Observation Market Revenue Share (%), by Country 2024 & 2032
  90. Figure 90: Middle East and Africa Satellite-based Earth Observation Market Volume Share (%), by Country 2024 & 2032
  91. Figure 91: Latin America Satellite-based Earth Observation Market Revenue (Million), by Service 2024 & 2032
  92. Figure 92: Latin America Satellite-based Earth Observation Market Volume (K Unit), by Service 2024 & 2032
  93. Figure 93: Latin America Satellite-based Earth Observation Market Revenue Share (%), by Service 2024 & 2032
  94. Figure 94: Latin America Satellite-based Earth Observation Market Volume Share (%), by Service 2024 & 2032
  95. Figure 95: Latin America Satellite-based Earth Observation Market Revenue (Million), by Technology 2024 & 2032
  96. Figure 96: Latin America Satellite-based Earth Observation Market Volume (K Unit), by Technology 2024 & 2032
  97. Figure 97: Latin America Satellite-based Earth Observation Market Revenue Share (%), by Technology 2024 & 2032
  98. Figure 98: Latin America Satellite-based Earth Observation Market Volume Share (%), by Technology 2024 & 2032
  99. Figure 99: Latin America Satellite-based Earth Observation Market Revenue (Million), by Application 2024 & 2032
  100. Figure 100: Latin America Satellite-based Earth Observation Market Volume (K Unit), by Application 2024 & 2032
  101. Figure 101: Latin America Satellite-based Earth Observation Market Revenue Share (%), by Application 2024 & 2032
  102. Figure 102: Latin America Satellite-based Earth Observation Market Volume Share (%), by Application 2024 & 2032
  103. Figure 103: Latin America Satellite-based Earth Observation Market Revenue (Million), by Country 2024 & 2032
  104. Figure 104: Latin America Satellite-based Earth Observation Market Volume (K Unit), by Country 2024 & 2032
  105. Figure 105: Latin America Satellite-based Earth Observation Market Revenue Share (%), by Country 2024 & 2032
  106. Figure 106: Latin America Satellite-based Earth Observation Market Volume Share (%), by Country 2024 & 2032

List of Tables

  1. Table 1: Global Satellite-based Earth Observation Market Revenue Million Forecast, by Region 2019 & 2032
  2. Table 2: Global Satellite-based Earth Observation Market Volume K Unit Forecast, by Region 2019 & 2032
  3. Table 3: Global Satellite-based Earth Observation Market Revenue Million Forecast, by Service 2019 & 2032
  4. Table 4: Global Satellite-based Earth Observation Market Volume K Unit Forecast, by Service 2019 & 2032
  5. Table 5: Global Satellite-based Earth Observation Market Revenue Million Forecast, by Technology 2019 & 2032
  6. Table 6: Global Satellite-based Earth Observation Market Volume K Unit Forecast, by Technology 2019 & 2032
  7. Table 7: Global Satellite-based Earth Observation Market Revenue Million Forecast, by Application 2019 & 2032
  8. Table 8: Global Satellite-based Earth Observation Market Volume K Unit Forecast, by Application 2019 & 2032
  9. Table 9: Global Satellite-based Earth Observation Market Revenue Million Forecast, by Region 2019 & 2032
  10. Table 10: Global Satellite-based Earth Observation Market Volume K Unit Forecast, by Region 2019 & 2032
  11. Table 11: Global Satellite-based Earth Observation Market Revenue Million Forecast, by Country 2019 & 2032
  12. Table 12: Global Satellite-based Earth Observation Market Volume K Unit Forecast, by Country 2019 & 2032
  13. Table 13: United States Satellite-based Earth Observation Market Revenue (Million) Forecast, by Application 2019 & 2032
  14. Table 14: United States Satellite-based Earth Observation Market Volume (K Unit) Forecast, by Application 2019 & 2032
  15. Table 15: Canada Satellite-based Earth Observation Market Revenue (Million) Forecast, by Application 2019 & 2032
  16. Table 16: Canada Satellite-based Earth Observation Market Volume (K Unit) Forecast, by Application 2019 & 2032
  17. Table 17: Mexico Satellite-based Earth Observation Market Revenue (Million) Forecast, by Application 2019 & 2032
  18. Table 18: Mexico Satellite-based Earth Observation Market Volume (K Unit) Forecast, by Application 2019 & 2032
  19. Table 19: Global Satellite-based Earth Observation Market Revenue Million Forecast, by Country 2019 & 2032
  20. Table 20: Global Satellite-based Earth Observation Market Volume K Unit Forecast, by Country 2019 & 2032
  21. Table 21: Germany Satellite-based Earth Observation Market Revenue (Million) Forecast, by Application 2019 & 2032
  22. Table 22: Germany Satellite-based Earth Observation Market Volume (K Unit) Forecast, by Application 2019 & 2032
  23. Table 23: United Kingdom Satellite-based Earth Observation Market Revenue (Million) Forecast, by Application 2019 & 2032
  24. Table 24: United Kingdom Satellite-based Earth Observation Market Volume (K Unit) Forecast, by Application 2019 & 2032
  25. Table 25: France Satellite-based Earth Observation Market Revenue (Million) Forecast, by Application 2019 & 2032
  26. Table 26: France Satellite-based Earth Observation Market Volume (K Unit) Forecast, by Application 2019 & 2032
  27. Table 27: Spain Satellite-based Earth Observation Market Revenue (Million) Forecast, by Application 2019 & 2032
  28. Table 28: Spain Satellite-based Earth Observation Market Volume (K Unit) Forecast, by Application 2019 & 2032
  29. Table 29: Italy Satellite-based Earth Observation Market Revenue (Million) Forecast, by Application 2019 & 2032
  30. Table 30: Italy Satellite-based Earth Observation Market Volume (K Unit) Forecast, by Application 2019 & 2032
  31. Table 31: Spain Satellite-based Earth Observation Market Revenue (Million) Forecast, by Application 2019 & 2032
  32. Table 32: Spain Satellite-based Earth Observation Market Volume (K Unit) Forecast, by Application 2019 & 2032
  33. Table 33: Belgium Satellite-based Earth Observation Market Revenue (Million) Forecast, by Application 2019 & 2032
  34. Table 34: Belgium Satellite-based Earth Observation Market Volume (K Unit) Forecast, by Application 2019 & 2032
  35. Table 35: Netherland Satellite-based Earth Observation Market Revenue (Million) Forecast, by Application 2019 & 2032
  36. Table 36: Netherland Satellite-based Earth Observation Market Volume (K Unit) Forecast, by Application 2019 & 2032
  37. Table 37: Nordics Satellite-based Earth Observation Market Revenue (Million) Forecast, by Application 2019 & 2032
  38. Table 38: Nordics Satellite-based Earth Observation Market Volume (K Unit) Forecast, by Application 2019 & 2032
  39. Table 39: Rest of Europe Satellite-based Earth Observation Market Revenue (Million) Forecast, by Application 2019 & 2032
  40. Table 40: Rest of Europe Satellite-based Earth Observation Market Volume (K Unit) Forecast, by Application 2019 & 2032
  41. Table 41: Global Satellite-based Earth Observation Market Revenue Million Forecast, by Country 2019 & 2032
  42. Table 42: Global Satellite-based Earth Observation Market Volume K Unit Forecast, by Country 2019 & 2032
  43. Table 43: China Satellite-based Earth Observation Market Revenue (Million) Forecast, by Application 2019 & 2032
  44. Table 44: China Satellite-based Earth Observation Market Volume (K Unit) Forecast, by Application 2019 & 2032
  45. Table 45: Japan Satellite-based Earth Observation Market Revenue (Million) Forecast, by Application 2019 & 2032
  46. Table 46: Japan Satellite-based Earth Observation Market Volume (K Unit) Forecast, by Application 2019 & 2032
  47. Table 47: India Satellite-based Earth Observation Market Revenue (Million) Forecast, by Application 2019 & 2032
  48. Table 48: India Satellite-based Earth Observation Market Volume (K Unit) Forecast, by Application 2019 & 2032
  49. Table 49: South Korea Satellite-based Earth Observation Market Revenue (Million) Forecast, by Application 2019 & 2032
  50. Table 50: South Korea Satellite-based Earth Observation Market Volume (K Unit) Forecast, by Application 2019 & 2032
  51. Table 51: Southeast Asia Satellite-based Earth Observation Market Revenue (Million) Forecast, by Application 2019 & 2032
  52. Table 52: Southeast Asia Satellite-based Earth Observation Market Volume (K Unit) Forecast, by Application 2019 & 2032
  53. Table 53: Australia Satellite-based Earth Observation Market Revenue (Million) Forecast, by Application 2019 & 2032
  54. Table 54: Australia Satellite-based Earth Observation Market Volume (K Unit) Forecast, by Application 2019 & 2032
  55. Table 55: Indonesia Satellite-based Earth Observation Market Revenue (Million) Forecast, by Application 2019 & 2032
  56. Table 56: Indonesia Satellite-based Earth Observation Market Volume (K Unit) Forecast, by Application 2019 & 2032
  57. Table 57: Phillipes Satellite-based Earth Observation Market Revenue (Million) Forecast, by Application 2019 & 2032
  58. Table 58: Phillipes Satellite-based Earth Observation Market Volume (K Unit) Forecast, by Application 2019 & 2032
  59. Table 59: Singapore Satellite-based Earth Observation Market Revenue (Million) Forecast, by Application 2019 & 2032
  60. Table 60: Singapore Satellite-based Earth Observation Market Volume (K Unit) Forecast, by Application 2019 & 2032
  61. Table 61: Thailandc Satellite-based Earth Observation Market Revenue (Million) Forecast, by Application 2019 & 2032
  62. Table 62: Thailandc Satellite-based Earth Observation Market Volume (K Unit) Forecast, by Application 2019 & 2032
  63. Table 63: Rest of Asia Pacific Satellite-based Earth Observation Market Revenue (Million) Forecast, by Application 2019 & 2032
  64. Table 64: Rest of Asia Pacific Satellite-based Earth Observation Market Volume (K Unit) Forecast, by Application 2019 & 2032
  65. Table 65: Global Satellite-based Earth Observation Market Revenue Million Forecast, by Country 2019 & 2032
  66. Table 66: Global Satellite-based Earth Observation Market Volume K Unit Forecast, by Country 2019 & 2032
  67. Table 67: Brazil Satellite-based Earth Observation Market Revenue (Million) Forecast, by Application 2019 & 2032
  68. Table 68: Brazil Satellite-based Earth Observation Market Volume (K Unit) Forecast, by Application 2019 & 2032
  69. Table 69: Argentina Satellite-based Earth Observation Market Revenue (Million) Forecast, by Application 2019 & 2032
  70. Table 70: Argentina Satellite-based Earth Observation Market Volume (K Unit) Forecast, by Application 2019 & 2032
  71. Table 71: Peru Satellite-based Earth Observation Market Revenue (Million) Forecast, by Application 2019 & 2032
  72. Table 72: Peru Satellite-based Earth Observation Market Volume (K Unit) Forecast, by Application 2019 & 2032
  73. Table 73: Chile Satellite-based Earth Observation Market Revenue (Million) Forecast, by Application 2019 & 2032
  74. Table 74: Chile Satellite-based Earth Observation Market Volume (K Unit) Forecast, by Application 2019 & 2032
  75. Table 75: Colombia Satellite-based Earth Observation Market Revenue (Million) Forecast, by Application 2019 & 2032
  76. Table 76: Colombia Satellite-based Earth Observation Market Volume (K Unit) Forecast, by Application 2019 & 2032
  77. Table 77: Ecuador Satellite-based Earth Observation Market Revenue (Million) Forecast, by Application 2019 & 2032
  78. Table 78: Ecuador Satellite-based Earth Observation Market Volume (K Unit) Forecast, by Application 2019 & 2032
  79. Table 79: Venezuela Satellite-based Earth Observation Market Revenue (Million) Forecast, by Application 2019 & 2032
  80. Table 80: Venezuela Satellite-based Earth Observation Market Volume (K Unit) Forecast, by Application 2019 & 2032
  81. Table 81: Rest of South America Satellite-based Earth Observation Market Revenue (Million) Forecast, by Application 2019 & 2032
  82. Table 82: Rest of South America Satellite-based Earth Observation Market Volume (K Unit) Forecast, by Application 2019 & 2032
  83. Table 83: Global Satellite-based Earth Observation Market Revenue Million Forecast, by Country 2019 & 2032
  84. Table 84: Global Satellite-based Earth Observation Market Volume K Unit Forecast, by Country 2019 & 2032
  85. Table 85: United States Satellite-based Earth Observation Market Revenue (Million) Forecast, by Application 2019 & 2032
  86. Table 86: United States Satellite-based Earth Observation Market Volume (K Unit) Forecast, by Application 2019 & 2032
  87. Table 87: Canada Satellite-based Earth Observation Market Revenue (Million) Forecast, by Application 2019 & 2032
  88. Table 88: Canada Satellite-based Earth Observation Market Volume (K Unit) Forecast, by Application 2019 & 2032
  89. Table 89: Mexico Satellite-based Earth Observation Market Revenue (Million) Forecast, by Application 2019 & 2032
  90. Table 90: Mexico Satellite-based Earth Observation Market Volume (K Unit) Forecast, by Application 2019 & 2032
  91. Table 91: Global Satellite-based Earth Observation Market Revenue Million Forecast, by Country 2019 & 2032
  92. Table 92: Global Satellite-based Earth Observation Market Volume K Unit Forecast, by Country 2019 & 2032
  93. Table 93: United Arab Emirates Satellite-based Earth Observation Market Revenue (Million) Forecast, by Application 2019 & 2032
  94. Table 94: United Arab Emirates Satellite-based Earth Observation Market Volume (K Unit) Forecast, by Application 2019 & 2032
  95. Table 95: Saudi Arabia Satellite-based Earth Observation Market Revenue (Million) Forecast, by Application 2019 & 2032
  96. Table 96: Saudi Arabia Satellite-based Earth Observation Market Volume (K Unit) Forecast, by Application 2019 & 2032
  97. Table 97: South Africa Satellite-based Earth Observation Market Revenue (Million) Forecast, by Application 2019 & 2032
  98. Table 98: South Africa Satellite-based Earth Observation Market Volume (K Unit) Forecast, by Application 2019 & 2032
  99. Table 99: Rest of Middle East and Africa Satellite-based Earth Observation Market Revenue (Million) Forecast, by Application 2019 & 2032
  100. Table 100: Rest of Middle East and Africa Satellite-based Earth Observation Market Volume (K Unit) Forecast, by Application 2019 & 2032
  101. Table 101: Global Satellite-based Earth Observation Market Revenue Million Forecast, by Service 2019 & 2032
  102. Table 102: Global Satellite-based Earth Observation Market Volume K Unit Forecast, by Service 2019 & 2032
  103. Table 103: Global Satellite-based Earth Observation Market Revenue Million Forecast, by Technology 2019 & 2032
  104. Table 104: Global Satellite-based Earth Observation Market Volume K Unit Forecast, by Technology 2019 & 2032
  105. Table 105: Global Satellite-based Earth Observation Market Revenue Million Forecast, by Application 2019 & 2032
  106. Table 106: Global Satellite-based Earth Observation Market Volume K Unit Forecast, by Application 2019 & 2032
  107. Table 107: Global Satellite-based Earth Observation Market Revenue Million Forecast, by Country 2019 & 2032
  108. Table 108: Global Satellite-based Earth Observation Market Volume K Unit Forecast, by Country 2019 & 2032
  109. Table 109: Global Satellite-based Earth Observation Market Revenue Million Forecast, by Service 2019 & 2032
  110. Table 110: Global Satellite-based Earth Observation Market Volume K Unit Forecast, by Service 2019 & 2032
  111. Table 111: Global Satellite-based Earth Observation Market Revenue Million Forecast, by Technology 2019 & 2032
  112. Table 112: Global Satellite-based Earth Observation Market Volume K Unit Forecast, by Technology 2019 & 2032
  113. Table 113: Global Satellite-based Earth Observation Market Revenue Million Forecast, by Application 2019 & 2032
  114. Table 114: Global Satellite-based Earth Observation Market Volume K Unit Forecast, by Application 2019 & 2032
  115. Table 115: Global Satellite-based Earth Observation Market Revenue Million Forecast, by Country 2019 & 2032
  116. Table 116: Global Satellite-based Earth Observation Market Volume K Unit Forecast, by Country 2019 & 2032
  117. Table 117: Global Satellite-based Earth Observation Market Revenue Million Forecast, by Service 2019 & 2032
  118. Table 118: Global Satellite-based Earth Observation Market Volume K Unit Forecast, by Service 2019 & 2032
  119. Table 119: Global Satellite-based Earth Observation Market Revenue Million Forecast, by Technology 2019 & 2032
  120. Table 120: Global Satellite-based Earth Observation Market Volume K Unit Forecast, by Technology 2019 & 2032
  121. Table 121: Global Satellite-based Earth Observation Market Revenue Million Forecast, by Application 2019 & 2032
  122. Table 122: Global Satellite-based Earth Observation Market Volume K Unit Forecast, by Application 2019 & 2032
  123. Table 123: Global Satellite-based Earth Observation Market Revenue Million Forecast, by Country 2019 & 2032
  124. Table 124: Global Satellite-based Earth Observation Market Volume K Unit Forecast, by Country 2019 & 2032
  125. Table 125: Global Satellite-based Earth Observation Market Revenue Million Forecast, by Service 2019 & 2032
  126. Table 126: Global Satellite-based Earth Observation Market Volume K Unit Forecast, by Service 2019 & 2032
  127. Table 127: Global Satellite-based Earth Observation Market Revenue Million Forecast, by Technology 2019 & 2032
  128. Table 128: Global Satellite-based Earth Observation Market Volume K Unit Forecast, by Technology 2019 & 2032
  129. Table 129: Global Satellite-based Earth Observation Market Revenue Million Forecast, by Application 2019 & 2032
  130. Table 130: Global Satellite-based Earth Observation Market Volume K Unit Forecast, by Application 2019 & 2032
  131. Table 131: Global Satellite-based Earth Observation Market Revenue Million Forecast, by Country 2019 & 2032
  132. Table 132: Global Satellite-based Earth Observation Market Volume K Unit Forecast, by Country 2019 & 2032
  133. Table 133: Global Satellite-based Earth Observation Market Revenue Million Forecast, by Service 2019 & 2032
  134. Table 134: Global Satellite-based Earth Observation Market Volume K Unit Forecast, by Service 2019 & 2032
  135. Table 135: Global Satellite-based Earth Observation Market Revenue Million Forecast, by Technology 2019 & 2032
  136. Table 136: Global Satellite-based Earth Observation Market Volume K Unit Forecast, by Technology 2019 & 2032
  137. Table 137: Global Satellite-based Earth Observation Market Revenue Million Forecast, by Application 2019 & 2032
  138. Table 138: Global Satellite-based Earth Observation Market Volume K Unit Forecast, by Application 2019 & 2032
  139. Table 139: Global Satellite-based Earth Observation Market Revenue Million Forecast, by Country 2019 & 2032
  140. Table 140: Global Satellite-based Earth Observation Market Volume K Unit Forecast, by Country 2019 & 2032


Frequently Asked Questions

1. What is the projected Compound Annual Growth Rate (CAGR) of the Satellite-based Earth Observation Market?

The projected CAGR is approximately 6.52%.

2. Which companies are prominent players in the Satellite-based Earth Observation Market?

Key companies in the market include MDA Corporation (Maxar Technologies), Ursa Space Systems Inc, Airbus Defence and Space (Airbus SE), Spacceknow Inc, Orbital Insight, BLACKSKY TECHNOLOGY INC, ESRI INC, PlanetIQ LLC, L3harris Technologies Inc, Descartes Lab, PLANET LABS PBC, EOS Data Analytics Inc, Capella Space, IMAGESAT International (I S I) LTD, ICEYE.

3. What are the main segments of the Satellite-based Earth Observation Market?

The market segments include Service, Technology, Application.

4. Can you provide details about the market size?

The market size is estimated to be USD 4.04 Million as of 2022.

5. What are some drivers contributing to market growth?

Increasing Requirement for Efficient Monitoring of Vast Land Areas; Rising Smart City Initiatives; Big Data and Imagery Analytics.

6. What are the notable trends driving market growth?

Urban Development to be the Fastest Growing Application.

7. Are there any restraints impacting market growth?

Availability of Open-source Data for Various Countries.

8. Can you provide examples of recent developments in the market?

March 2024 - the US Navy awarded Planet Labs a contract for maritime surveillance in the Pacific. The company’s satellite imagery will be used for vessel detection and monitoring by the Naval Information Warfare Center Pacific. For this initiative, Planet will collaborate with SynMax, a data analytics organization specializing in artificial intelligence (AI) and satellite imagery, to deliver actionable intelligence to its customers.

9. What pricing options are available for accessing the report?

Pricing options include single-user, multi-user, and enterprise licenses priced at USD 4750, USD 5250, and USD 8750 respectively.

10. Is the market size provided in terms of value or volume?

The market size is provided in terms of value, measured in Million and volume, measured in K Unit.

11. Are there any specific market keywords associated with the report?

Yes, the market keyword associated with the report is "Satellite-based Earth Observation Market," which aids in identifying and referencing the specific market segment covered.

12. How do I determine which pricing option suits my needs best?

The pricing options vary based on user requirements and access needs. Individual users may opt for single-user licenses, while businesses requiring broader access may choose multi-user or enterprise licenses for cost-effective access to the report.

13. Are there any additional resources or data provided in the Satellite-based Earth Observation Market report?

While the report offers comprehensive insights, it's advisable to review the specific contents or supplementary materials provided to ascertain if additional resources or data are available.

14. How can I stay updated on further developments or reports in the Satellite-based Earth Observation Market?

To stay informed about further developments, trends, and reports in the Satellite-based Earth Observation Market, consider subscribing to industry newsletters, following relevant companies and organizations, or regularly checking reputable industry news sources and publications.


Methodology

Step 1 - Identification of Relevant Samples Size from Population Database

Step Chart
Bar Chart
Method Chart

Step 2 - Approaches for Defining Global Market Size (Value, Volume* & Price*)

Approach Chart
Top-down and bottom-up approaches are used to validate the global market size and estimate the market size for manufactures, regional segments, product, and application.

Note*: In applicable scenarios

Step 3 - Data Sources

Primary Research

  • Web Analytics
  • Survey Reports
  • Research Institute
  • Latest Research Reports
  • Opinion Leaders

Secondary Research

  • Annual Reports
  • White Paper
  • Latest Press Release
  • Industry Association
  • Paid Database
  • Investor Presentations
Analyst Chart

Step 4 - Data Triangulation

Involves using different sources of information in order to increase the validity of a study

These sources are likely to be stakeholders in a program - participants, other researchers, program staff, other community members, and so on.

Then we put all data in single framework & apply various statistical tools to find out the dynamic on the market.

During the analysis stage, feedback from the stakeholder groups would be compared to determine areas of agreement as well as areas of divergence

Additionally, after gathering mixed and scattered data from a wide range of sources, data is triangulated and correlated to come up with estimated figures which are further validated through primary mediums or industry experts, opinion leaders.

About Report Pinnacle

Report Pinnacle provides top-tier market research, industry intelligence, and actionable insights for finance, technology, healthcare, and consumer sectors. Our reports empower you to make informed decisions and achieve business success.

Our expert team combines primary research, data analytics, and industry knowledge to deliver insights you can trust. We offer syndicated reports, custom research, and consulting services tailored to your unique business needs.

At Report Pinnacle, we are committed to quality, transparency, and client satisfaction. Every report is rigorously validated to ensure accuracy and relevance. Our global perspective and local expertise help you understand both broad trends and detailed market shifts.

Stay ahead with Report Pinnacle. Subscribe to our newsletter for the latest insights and research highlights, and follow us on social media for real-time updates.

Report Pinnacle – Your Partner for Reaching the Top in Market Intelligence.

artwork spiralartwork spiralRelated Reports
artwork underline

LA LED Packaging Market CAGR Growth Drivers and Trends: Forecasts 2025-2033

Discover the booming LA LED Packaging market! This in-depth analysis reveals a CAGR of 5.30% through 2033, driven by energy-efficient lighting & smart technology. Explore market size, key players (Samsung, Osram, etc.), regional trends, and future growth projections.

September 2025
Base Year: 2024
No Of Pages: 210
Price: $4750

India Wire And Cable Market Market’s Growth Catalysts

Discover the booming India wire and cable market! This in-depth analysis reveals a ₹19.44 billion market (2025) projected to grow at a 9.14% CAGR until 2033, driven by construction, IT, and energy sectors. Explore key players, regional trends, and future opportunities in this comprehensive report.

September 2025
Base Year: 2024
No Of Pages: 197
Price: $3800

Exploring Growth Avenues in Global Discount-Marine Trenchers Market Market

Discover the booming global marine trenchers market! This in-depth analysis reveals a CAGR exceeding 3%, driven by offshore energy infrastructure expansion and technological advancements. Explore market segments, key players (SMD, Osbit, etc.), and regional trends in this comprehensive report. Learn how to capitalize on this lucrative opportunity.

September 2025
Base Year: 2024
No Of Pages: 234
Price: $4750

Exploring Growth Avenues in Graphic Design Market Market

The global graphic design market is booming, projected to reach \$[estimated 2033 value] by 2033, with a CAGR of 5.89%. Discover key trends, market segments (logo design, app design, etc.), top companies, and regional insights in this comprehensive market analysis.

September 2025
Base Year: 2024
No Of Pages: 234
Price: $4750

Freight Transport Management Market Insights: Growth at XX CAGR Through 2033

The Freight Transport Management market is booming, projected to reach $29.11 billion by 2025 with a 9.70% CAGR. Discover key trends, drivers, and regional insights in this comprehensive market analysis covering solutions, deployment models, and end-user industries. Learn about leading companies shaping this dynamic sector.

September 2025
Base Year: 2024
No Of Pages: 234
Price: $4750

Future Prospects for Africa Data Center Market Growth

Discover the booming African data center market! This comprehensive analysis reveals a 21.06% CAGR, driven by cloud adoption, FinTech growth, and government initiatives. Explore market size, key players (Equinix, Raxio, Teraco), regional trends (Nigeria, South Africa, Egypt), and future projections. Invest wisely in this rapidly expanding sector.

September 2025
Base Year: 2024
No Of Pages: 197
Price: $3800

Mobile Augmented Reality Market Market’s Evolution: Key Growth Drivers 2025-2033

The Mobile Augmented Reality (MAR) market is booming, projected to reach \$42.48 million in 2025 with a 42.36% CAGR. Discover key drivers, trends, and market segmentation across gaming, healthcare, retail, and more. Explore leading companies and regional insights in this comprehensive market analysis.

September 2025
Base Year: 2024
No Of Pages: 234
Price: $4750

Unlocking Growth in Europe Energy Management Systems Market Market 2025-2033

The European Energy Management Systems (EMS) market is booming, projected to reach €48.99 billion by 2033, with a CAGR of 14.57%. Driven by sustainability initiatives and rising energy costs, this report analyzes market trends, key players (Honeywell, Schneider Electric, etc.), and regional growth across the UK, Germany, France, and more. Discover the opportunities in BEMS, HEMS, and various distribution channels.

September 2025
Base Year: 2024
No Of Pages: 210
Price: $4750

Canada ICT Market in Emerging Markets: Analysis and Projections 2025-2033

Discover the booming Canadian ICT market! Explore its 7% CAGR, key drivers (cloud computing, AI, e-commerce), market segments (hardware, software, services), and leading companies. Get insights into market trends and future growth potential from 2025 to 2033.

September 2025
Base Year: 2024
No Of Pages: 197
Price: $3800

Regional Trends and Opportunities for Americas Optoelectronics Market Market

The Americas Optoelectronics Market is booming, projected to reach \$28.15 Billion by 2033, fueled by automotive, consumer electronics, and healthcare advancements. Explore market trends, key players (Vishay, OmniVision, Texas Instruments), and regional growth in North America and Latin America. Learn more about this high-growth sector!

September 2025
Base Year: 2024
No Of Pages: 234
Price: $4750

Outdoor LED Smart Lighting Solution Industry Strategic Insights: Analysis 2025 and Forecasts 2033

Discover the booming outdoor LED smart lighting market! Explore market size, CAGR, key drivers, trends, and regional analysis. Learn about top companies and future growth projections for this dynamic sector. Invest in the future of smart cities with our comprehensive market report.

September 2025
Base Year: 2024
No Of Pages: 197
Price: $3800

Reed Switch Sensor Market Future-proof Strategies: Trends, Competitor Dynamics, and Opportunities 2025-2033

The Reed Switch Sensor market is booming, projected to reach $XX million by 2033 with a 7.20% CAGR. Driven by automotive, consumer electronics, and industrial automation, this report analyzes market trends, key players (STG Germany, Littelfuse, etc.), and regional growth, offering valuable insights for investors and businesses.

September 2025
Base Year: 2024
No Of Pages: 234
Price: $4750

Exploring Regional Dynamics of Safety Programmable Controller Market Market 2025-2033

The Safety Programmable Controller (SPC) market is booming, projected to reach $XX million by 2033 with a CAGR of 6.5%. Discover key trends, drivers, restraints, and leading companies shaping this dynamic market across automotive, energy, and manufacturing sectors. Explore regional insights and future growth predictions in our comprehensive analysis.

September 2025
Base Year: 2024
No Of Pages: 234
Price: $4750

Norway Data Center Power Market Market’s Growth Blueprint

The Norway data center power market is booming, projected to reach $519.82 million by 2033 with an 8.90% CAGR. Driven by cloud computing and big data, this report analyzes market size, trends, restraints, segments (UPS systems, generators, power distribution), key players (ABB, Schneider Electric), and future forecasts. Discover insights for investment and strategic planning.

September 2025
Base Year: 2024
No Of Pages: 197
Price: $3800

E-commerce Market in Switzerland Unlocking Growth Potential: 2025-2033 Analysis and Forecasts

Discover the booming Swiss e-commerce market! Our analysis reveals a CHF 16.5 billion market in 2025, projected to grow at a 13.71% CAGR. Explore key trends, drivers, and top players shaping this dynamic sector. Learn more about market segmentation, regional breakdown, and future growth projections.

September 2025
Base Year: 2024
No Of Pages: 197
Price: $3800

Japan Data Center Power Market Analysis 2025-2033: Unlocking Competitive Opportunities

Discover the booming Japan Data Center Power market! This in-depth analysis reveals a $820 million market in 2025, projected to grow at a 5.27% CAGR through 2033. Explore key drivers, trends, and leading companies shaping this dynamic sector. Learn about the surging demand for UPS systems, generators, and power distribution solutions in IT, BFSI, and government sectors.

September 2025
Base Year: 2024
No Of Pages: 197
Price: $3800

Australia Switchgear Market Competitive Advantage: Trends and Opportunities to 2033

The Australian switchgear market is booming, projected to reach $2.296 billion by 2033, driven by renewable energy, smart grid development, and industrial growth. This in-depth analysis explores market size, CAGR, key players (ABB, Siemens, Schneider Electric), and future trends. Learn more about investment opportunities in this dynamic sector.

September 2025
Base Year: 2024
No Of Pages: 197
Price: $3800

Emerging Growth Patterns in Direct to Consumer Ecommerce Market in India Market

India's booming D2C e-commerce market is projected to reach \$272 Billion by 2033, fueled by a 34.5% CAGR. Discover key trends, leading brands (Nykaa, Boat, Licious), and regional insights in this comprehensive market analysis.

September 2025
Base Year: 2024
No Of Pages: 197
Price: $3800

South Korea MLCC Market Unlocking Growth Potential: Analysis and Forecasts 2025-2033

South Korea's booming MLCC market is projected to reach $XX million by 2025, growing at a CAGR of 5.91%. Discover key trends, market segmentation (dielectric type, case size, voltage, capacitance, mounting type, end-user), leading companies, and future growth forecasts for this dynamic sector.

September 2025
Base Year: 2024
No Of Pages: 197
Price: $3800

Navigating Latin America Consumer Electronic Industry Market Growth 2025-2033

Discover the booming Latin American consumer electronics market! Explore its 8.40% CAGR, key drivers (rising incomes, e-commerce), restraints, leading companies (Samsung, LG, Panasonic), and regional trends (Brazil, Mexico). Get insights into the 2025-2033 forecast for smartphones, TVs, appliances, and more.

September 2025
Base Year: 2024
No Of Pages: 210
Price: $4750

Future Prospects for Magnetic Sensor Market Growth

The magnetic sensor market is booming, projected to reach over $7 billion by 2033 with a CAGR of 7.91%. Driven by automotive, consumer electronics, and industrial applications, key players like Analog Devices and STMicroelectronics are leading the charge in this rapidly expanding sector. Explore market trends, segments (GMR, TMR, Hall Effect), and regional insights.

September 2025
Base Year: 2024
No Of Pages: 234
Price: $4750

Turkey Ecommerce Industry Market Overview: Trends and Strategic Forecasts 2025-2033

Discover the explosive growth of Turkey's e-commerce market, projected to reach [estimated 2033 market size in millions] by 2033 with a CAGR of 22.60%. This in-depth analysis reveals key drivers, trends, challenges, and top players shaping this dynamic sector, including Amazon, Trendyol, and Hepsiburada. Learn more about market segmentation and future growth potential.

September 2025
Base Year: 2024
No Of Pages: 197
Price: $3800

Nigeria Data Center Market Market Growth Fueled by CAGR to XXX Million by 2033

Nigeria's data center market is booming, with a 21.06% CAGR. This analysis explores market size, key drivers (digitalization, e-commerce), restraints, and leading companies like Africa Data Centers and MainOne. Discover the investment opportunities and growth trends in this dynamic sector.

September 2025
Base Year: 2024
No Of Pages: 197
Price: $3800

Saudi Arabia E-Commerce Market XX CAGR Growth to Drive Market Size to XXX Million by 2033

The Saudi Arabia e-commerce market is booming, projected to reach \$13.61 billion by 2025 with a 15.01% CAGR. Discover key drivers, trends, and challenges shaping this dynamic market, including leading companies and segment analysis. Explore the opportunities and future growth projections in this lucrative sector.

September 2025
Base Year: 2024
No Of Pages: 197
Price: $3800

Programmable Robotics Industry Insightful Market Analysis: Trends and Opportunities 2025-2033

Discover the booming programmable robotics market! This in-depth analysis reveals a CAGR of 9.66%, exploring key drivers, trends, and restraints from 2019-2033. Learn about market segmentation, leading companies, and regional growth projections in education, entertainment, and household applications. Get the data you need to understand this dynamic sector.

September 2025
Base Year: 2024
No Of Pages: 234
Price: $4750

Unveiling Cognitive Operations Market Growth Patterns: CAGR Analysis and Forecasts 2025-2033

The Cognitive Operations market is booming, projected to reach $17.59B in 2025 with a 16.38% CAGR. This report analyzes market drivers, trends, restraints, and key players like IBM & Splunk, covering segments like cloud deployment, application performance management, and key verticals. Discover growth opportunities in this rapidly expanding market.

September 2025
Base Year: 2024
No Of Pages: 234
Price: $4750

Enterprise Server Market Strategic Dynamics: Competitor Analysis 2025-2033

The enterprise server market is booming, projected to reach \$164.7 billion by 2033 with an 8.03% CAGR. This in-depth analysis explores key drivers, trends, restraints, and market segmentation across operating systems, server types, and end-user verticals. Learn about leading companies and regional market shares.

September 2025
Base Year: 2024
No Of Pages: 234
Price: $4750

France Fixed Wireless Access (FWA) Market Unlocking Growth Potential: Analysis and Forecasts 2025-2033

The France Fixed Wireless Access (FWA) market is booming, projected to reach €430 million in 2025 and grow at a CAGR of 29.48% until 2033. Driven by 5G advancements and government initiatives, this market offers significant opportunities for providers and investors. Learn more about market trends, key players, and future growth potential.

September 2025
Base Year: 2024
No Of Pages: 197
Price: $3800

Geospatial Data Analytics Market Market’s Consumer Landscape: Insights and Trends 2025-2033

The Geospatial Data Analytics market is booming, projected to reach $86.39 million in 2025, with a CAGR of 12.81% through 2033. Discover key drivers, trends, and regional insights in this comprehensive market analysis covering leading companies and applications in agriculture, defense, and more.

September 2025
Base Year: 2024
No Of Pages: 234
Price: $4750

Strategic Vision for Europe Alternating Current (AC) Motor Market Market Expansion

Discover the latest insights on the booming European AC Motor market. Our analysis reveals a CAGR of 4.20% through 2033, driven by automation, energy efficiency mandates, and renewable energy growth. Explore market size, segmentation, key players (ABB, Siemens, Nidec), and regional trends. Download the full report for a comprehensive overview.

September 2025
Base Year: 2024
No Of Pages: 210
Price: $4750

Hardware Wallet Market Market’s Drivers and Challenges: Strategic Overview 2025-2033

The hardware wallet market is booming, projected to reach $2.55 billion by 2033 with a CAGR of 28.79%. Driven by rising cryptocurrency adoption and security concerns, this in-depth analysis explores market trends, key players (Ledger, Trezor, etc.), and regional growth, offering valuable insights for investors and businesses.

September 2025
Base Year: 2024
No Of Pages: 234
Price: $4750

Strategic Growth Drivers for Mexico LED Lighting Market Market

Discover the booming Mexico LED lighting market! This comprehensive analysis reveals a $1.91B market (2025) with a 9.87% CAGR, driven by government initiatives and technological advancements. Explore market segments, key players, and future growth projections.

September 2025
Base Year: 2024
No Of Pages: 197
Price: $3800

NA Electric Drives Market to Grow at XX CAGR: Market Size Analysis and Forecasts 2025-2033

Discover the booming North American electric drives market! This comprehensive analysis reveals key trends, growth drivers, and market segmentation (AC, DC, Servo drives) from 2019-2033, highlighting leading companies like ABB, Rockwell, and Siemens. Explore the significant opportunities and challenges in oil & gas, chemical, and renewable energy sectors.

September 2025
Base Year: 2024
No Of Pages: 210
Price: $4750

Robotics in Construction Industry Comprehensive Market Study: Trends and Predictions 2025-2033

The Robotics in Construction market is booming, projected to reach \$383.11 million in 2025 and grow at a CAGR of 15.50% through 2033. Driven by labor shortages and technological advancements, this report analyzes market trends, key players (Dusty Robotics, Advanced Construction Robotics), and regional growth in demolition, bricklaying, 3D printing, and more. Discover the future of construction automation.

September 2025
Base Year: 2024
No Of Pages: 234
Price: $4750

Self-Serve Industry Report: Trends and Forecasts 2025-2033

The self-service industry is booming, projected to reach $38.22B in 2025 with a 7.79% CAGR. Explore market trends, key players (NCR, Diebold Nixdorf), and growth drivers in this comprehensive analysis of kiosks, ATMs, vending machines, and more across BFSI, retail, and other sectors.

September 2025
Base Year: 2024
No Of Pages: 234
Price: $4750

Exploring Key Dynamics of Non-Destructive Testing (NDT) Software Market Industry

The NDT Software Market is booming, projected to reach $0.63B in 2025 and grow at a CAGR of 11.10% through 2033. Driven by AI, automation, and increasing demand across industries like oil & gas and aerospace, this report analyzes market trends, key players (Baker Hughes, Zeiss, etc.), and regional growth. Discover the future of non-destructive testing software.

September 2025
Base Year: 2024
No Of Pages: 234
Price: $4750

Strategic Growth Drivers for France Outdoor LED Lighting Market Market

Discover the booming France Outdoor LED Lighting market! This in-depth analysis reveals a CAGR of 19.50% (2025-2033), driven by smart city initiatives and energy efficiency demands. Explore market size, key players (Signify, Thorn Lighting), and future trends.

September 2025
Base Year: 2024
No Of Pages: 197
Price: $3800

Aluminum Electrolytic Capacitor Market Trends and Forecast 2025-2033

The Aluminum Electrolytic Capacitor market is booming, projected to reach [estimated 2033 market size based on CAGR] by 2033. Driven by automotive and electronics growth, this report analyzes market size, CAGR, key players (TDK, Panasonic, Murata), and regional trends. Discover insights into high-voltage, low-voltage segments and future opportunities.

September 2025
Base Year: 2024
No Of Pages: 234
Price: $4750

Exploring LA Package Testing Market Market Disruption and Innovation

Discover the booming LA Package Testing market! This comprehensive analysis reveals a CAGR of 6.00%, driven by e-commerce, sustainability, and regulatory changes. Explore market size, segmentation (glass, paper, plastic, metal packaging; physical, chemical, environmental testing), key players (Intertek, SGS, etc.), and regional trends (North America, Europe, Asia-Pacific). Get insights to optimize your packaging strategy.

September 2025
Base Year: 2024
No Of Pages: 210
Price: $4750

Eye Tracking Solutions Market Growth Pathways: Strategic Analysis and Forecasts 2025-2033

The Eye Tracking Solutions market is booming, projected to reach $9.5 billion by 2033 with a 26% CAGR. This in-depth analysis explores market drivers, trends, restraints, and key players across sectors like automotive, retail, and healthcare. Discover growth opportunities and the latest technological advancements shaping this dynamic industry.

September 2025
Base Year: 2024
No Of Pages: 234
Price: $4750

Netherlands E-commerce Market 2025 Trends and Forecasts 2033: Analyzing Growth Opportunities

Discover the booming Netherlands e-commerce market! This in-depth analysis reveals a €33.43B market in 2025, growing at a 9.31% CAGR until 2033. Explore key drivers, trends, segments (beauty, electronics, fashion), and top players like Bol.com and Zalando.

September 2025
Base Year: 2024
No Of Pages: 197
Price: $3800

Wireless Infrastructure Monitoring Industry Industry’s Future Growth Prospects

The Wireless Infrastructure Monitoring market is booming, projected to reach \$4.18B by 2025 with a 12.90% CAGR. Discover key drivers, trends, and market segmentation insights, including data on geotechnical, structural, and environmental monitoring applications across major industries. Learn about leading companies and regional market shares.

September 2025
Base Year: 2024
No Of Pages: 234
Price: $4750

North America Security Services Market: Disruptive Technologies Driving Market Growth 2025-2033

The North American security services market is booming, projected to reach over $70 billion by 2033, driven by rising cyber threats and stringent regulations. Learn about market trends, key players (IBM, GardaWorld, etc.), and growth opportunities in this comprehensive analysis.

September 2025
Base Year: 2024
No Of Pages: 210
Price: $4750

SMS Firewall Market Industry’s Future Growth Prospects

The SMS Firewall market is booming, projected to reach $XX million by 2033 with a 10.2% CAGR. This report analyzes market drivers, trends, and key players like Twilio and Sinch, covering segments like A2P SMS, cloud platforms, and major industries. Learn about securing your SMS communications against fraud and boosting compliance.

September 2025
Base Year: 2024
No Of Pages: 234
Price: $4750

Overcoming Challenges in Asia Pacific IT Device Market Market: Strategic Insights 2025-2033

Discover the latest insights into the booming Asia-Pacific IT device market. This comprehensive analysis reveals key growth drivers, emerging trends, and regional market shares for PCs, smartphones, and other devices, forecasting market size through 2033. Learn about major players and competitive landscapes.

September 2025
Base Year: 2024
No Of Pages: 234
Price: $4750

UAE Cloud Accounting Software Market Market Expansion Strategies

UAE Cloud Accounting Software Market booming with a CAGR of 14.94%, driven by digital transformation and SME growth. Explore market size, trends, key players (Intuit, Zoho, SAP), and regional insights. Forecast to 2033.

September 2025
Base Year: 2024
No Of Pages: 197
Price: $3800

APAC Data Center Construction Market Market Report: Strategic Insights

Discover the booming APAC data center construction market! This in-depth analysis reveals a projected CAGR of 8.62% through 2033, driven by digitalization, cloud computing, and 5G adoption. Learn about key segments, regional trends, and leading companies shaping this dynamic industry.

September 2025
Base Year: 2024
No Of Pages: 210
Price: $4750

Unveiling Germany Access Control Market Growth Patterns: CAGR Analysis and Forecasts 2025-2033

Discover the booming German access control market! Our in-depth analysis reveals a €520 million market in 2025, projected to grow at a CAGR of 5.92% until 2033. Learn about key drivers, trends, restraints, and leading companies shaping this dynamic sector. Explore market segmentation by device type and end-user vertical.

September 2025
Base Year: 2024
No Of Pages: 197
Price: $3800

Smart Sound and Gateway Market Market Report: Trends and Growth

Discover the booming smart sound & gateway market! Explore its 29.24% CAGR, key drivers like Alexa & Google Assistant, leading companies like Amazon & Google, and regional trends shaping this multi-billion dollar industry. Get insights into smart speaker and hearable market growth forecasts to 2033.

September 2025
Base Year: 2024
No Of Pages: 234
Price: $4750

Hospitality Property Management Software (PMS) Industry Market’s Tech Revolution: Projections to 2033

Discover the booming Hospitality Property Management Software (PMS) market! This comprehensive analysis reveals key trends, growth drivers, and leading companies shaping the future of hotel management. Explore market size projections, regional breakdowns, and emerging technologies driving innovation in the industry. Learn how cloud-based PMS, personalized guest experiences, and revenue management solutions are transforming hospitality.

September 2025
Base Year: 2024
No Of Pages: 234
Price: $4750
  • Home
  • About Us
  • Industries
    • Aerospace & Defense
    • Agriculture
    • Animal Nutrition & Wellness
    • Automotive
    • Chemicals & Materials
    • Consumer Goods and Services
    • Energy & Power
    • Financial Services and Investment Intelligence
    • Food & Beverage
    • Home and Property Improvement
    • Hospitality and Tourism
    • Logistics
    • Manufacturing Products and Services
    • Packaging
    • Professional and Commercial Services
    • Real Estate and Construction
    • Retail
    • Technology, Media and Telecom
    • Healthcare
  • Services
  • Contact
Main Logo
  • Home
  • About Us
  • Industries
    • Aerospace & Defense
    • Agriculture
    • Animal Nutrition & Wellness
    • Automotive
    • Chemicals & Materials
    • Consumer Goods and Services
    • Energy & Power
    • Financial Services and Investment Intelligence
    • Food & Beverage
    • Home and Property Improvement
    • Hospitality and Tourism
    • Logistics
    • Manufacturing Products and Services
    • Packaging
    • Professional and Commercial Services
    • Real Estate and Construction
    • Retail
    • Technology, Media and Telecom
    • Healthcare
  • Services
  • Contact
+17162654855
[email protected]

+17162654855

[email protected]

Business Address

Head Office

Ansec House 3 rd floor Tank Road, Yerwada, Pune, Maharashtra 411014

Contact Information

Craig Francis

Business Development Head

+17162654855

[email protected]

Secure Payment Partners

payment image
RetailLogisticsPackagingAutomotiveHealthcareAgricultureEnergy & PowerFood & BeverageAerospace & DefenseChemicals & MaterialsHospitality and TourismAnimal Nutrition & WellnessConsumer Goods and ServicesReal Estate and ConstructionHome and Property ImprovementTechnology, Media and TelecomManufacturing Products and ServicesFinancial Services and Investment Intelligence

© 2025 PRDUA Research & Media Private Limited, All rights reserved

Privacy Policy
Terms and Conditions
FAQ