Key Insights
The global styrene-butadiene rubber (SBR) and solution styrene-butadiene rubber (SSBR) market is experiencing robust growth, driven by increasing demand from the tire and automotive industries. The market's expansion is fueled by the rising global vehicle production, particularly in developing economies, and the growing preference for high-performance tires demanding advanced rubber compounds. Technological advancements in SBR and SSBR manufacturing processes, leading to improved product properties like enhanced durability, fuel efficiency, and grip, are further bolstering market growth. Furthermore, the increasing adoption of electric vehicles (EVs) is creating new opportunities, as SSBR's excellent low rolling resistance properties are particularly suitable for EV tires, contributing to extended driving range. However, fluctuations in raw material prices, particularly styrene and butadiene, pose a significant challenge to market stability and profitability. Additionally, stringent environmental regulations regarding volatile organic compound (VOC) emissions during manufacturing processes are prompting manufacturers to invest in cleaner production technologies, adding to the overall cost of production. Competition among established players and emerging market entrants is intense, with companies constantly innovating to improve product performance and reduce costs. Looking ahead, the market is expected to witness sustained growth, propelled by ongoing technological advancements and the increasing demand for high-performance tires globally.
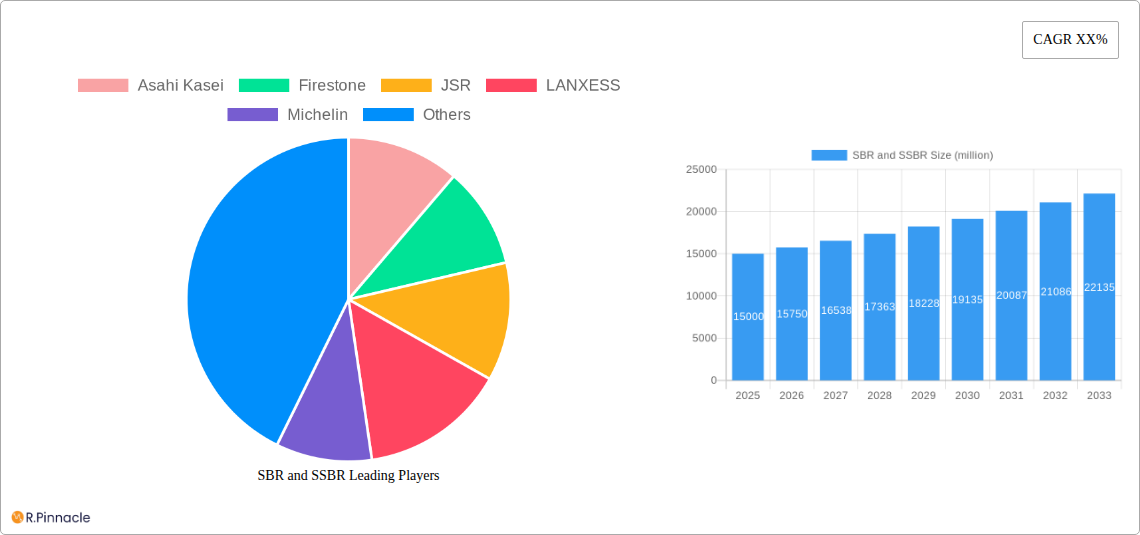
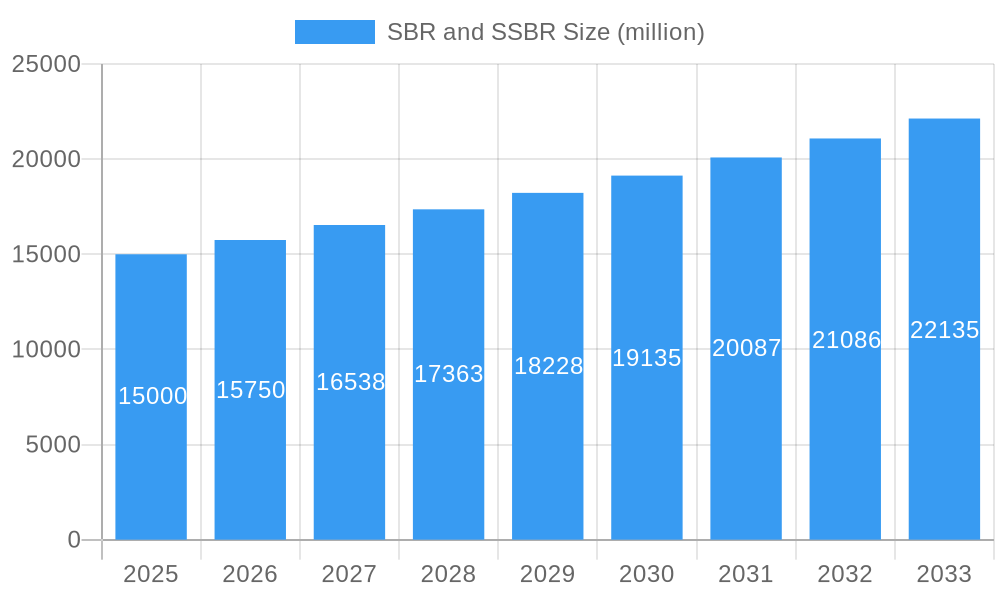
SBR and SSBR Market Size (In Billion)
The segmentation of the SBR and SSBR market is largely driven by application (tires, non-tire applications like footwear and adhesives), type (SBR, SSBR), and geography. Major players in this competitive landscape include Asahi Kasei, Firestone, JSR, LANXESS, Michelin, Goodyear, and others. These companies are constantly engaging in research and development to introduce new grades of SBR and SSBR with improved properties. Strategic alliances, mergers, and acquisitions are also common strategies to enhance market share and expand geographic reach. Regional market shares vary considerably, with North America, Europe, and Asia-Pacific emerging as prominent consumers and production hubs. Growth in developing economies is significantly impacting the market, while mature markets show steady demand driven by technological innovation and replacement cycles. The forecast period (2025-2033) anticipates a continued positive trajectory, albeit moderated by potential economic fluctuations and the evolving regulatory landscape. Sustained growth is projected despite challenges, reflecting the irreplaceable role of SBR and SSBR in critical industries.
SBR and SSBR Company Market Share
SBR and SSBR Market Report: 2019-2033 Forecast
This comprehensive report provides a detailed analysis of the global Styrene Butadiene Rubber (SBR) and Solution Styrene Butadiene Rubber (SSBR) market, offering invaluable insights for industry professionals, investors, and strategic decision-makers. The report covers the period 2019-2033, with a focus on the 2025-2033 forecast period. The study incorporates millions of dollars in market valuation data, providing granular insights into market segmentation, growth drivers, challenges, and future opportunities.
SBR and SSBR Market Structure & Innovation Trends
This section analyzes the competitive landscape of the SBR and SSBR market, examining market concentration, innovation drivers, regulatory influences, and key industry activities. The global SBR and SSBR market is estimated to be worth $xx million in 2025.
Market Concentration: The market demonstrates a moderately concentrated structure, with key players holding significant market share. The top five players, including Asahi Kasei, Firestone, JSR, LANXESS, and Michelin, collectively account for approximately xx% of the total market share in 2025.
Innovation Drivers: Continuous research and development efforts focused on improving tire performance, fuel efficiency, and sustainability are driving innovation. This includes the development of new grades of SBR and SSBR with enhanced properties.
Regulatory Framework: Stringent environmental regulations related to emissions and waste management are influencing the adoption of sustainable SBR and SSBR production processes.
M&A Activity: Significant M&A activity has been observed in recent years, with deal values exceeding $xx million in the period 2019-2024. These activities aim to consolidate market share and enhance technological capabilities.
SBR and SSBR Market Dynamics & Trends
This section delves into the key market dynamics influencing the growth trajectory of SBR and SSBR. The market is projected to experience a Compound Annual Growth Rate (CAGR) of xx% during the forecast period (2025-2033), reaching a value of $xx million by 2033.
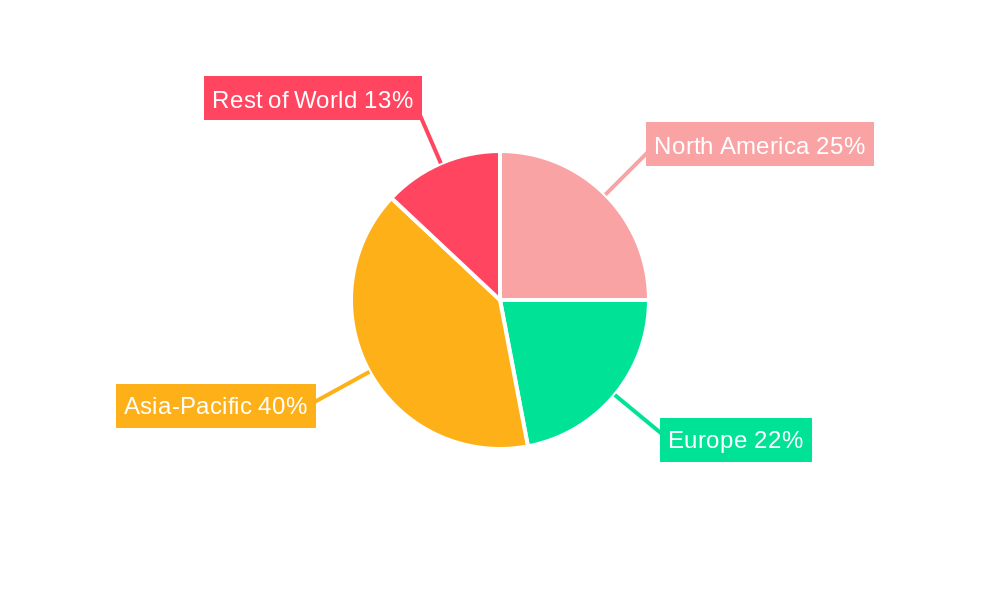
The growth is driven by increasing demand from the automotive industry, particularly the rising production of passenger cars and commercial vehicles globally. Technological advancements leading to improved tire performance and fuel efficiency further propel market growth. Consumer preference for high-performance tires is another key factor. Furthermore, the increasing adoption of sustainable manufacturing practices and eco-friendly materials adds to this trend. Intense competition among major players drives innovation and price competitiveness.
Dominant Regions & Segments in SBR and SSBR
This section identifies the leading regions and segments within the SBR and SSBR market. Asia-Pacific is projected to be the dominant region, holding the largest market share in 2025, valued at $xx million.
- Key Drivers in Asia-Pacific:
- Rapid industrialization and urbanization
- Growing automotive sector
- Favorable government policies supporting infrastructure development
- Expanding tire manufacturing capabilities
Detailed analysis indicates that the robust growth in Asia-Pacific is fueled by a combination of factors, including rapidly expanding automotive production in China and India, significant investments in infrastructure projects, and increasing disposable incomes leading to higher demand for vehicles. The region's dominance is further reinforced by the presence of major SBR and SSBR manufacturing facilities.
SBR and SSBR Product Innovations
Recent product innovations include the development of high-performance SBR and SSBR grades with improved wear resistance, wet grip, and rolling resistance. These innovations enhance tire performance, addressing the increasing demand for fuel-efficient and long-lasting tires. The focus on sustainability has led to the introduction of bio-based SBR and SSBR grades.
Report Scope & Segmentation Analysis
This report segments the SBR and SSBR market based on type (SBR, SSBR), grade (general-purpose, high-styrene, low-styrene), application (tires, non-tires), and region (North America, Europe, Asia-Pacific, Middle East & Africa, South America). Each segment provides detailed analysis of market size, growth projections, and competitive dynamics. For example, the tire segment is projected to dominate due to its extensive use in various vehicle types.
Key Drivers of SBR and SSBR Growth
Several factors drive the growth of the SBR and SSBR market: The automotive industry's growth is a primary driver, fuelled by increasing vehicle production globally. Furthermore, technological advancements leading to enhanced tire performance and fuel efficiency significantly contribute to market expansion. Government regulations promoting sustainable manufacturing practices are also shaping market growth.
Challenges in the SBR and SSBR Sector
The SBR and SSBR market faces challenges such as fluctuating raw material prices, stringent environmental regulations, and intense competition among manufacturers. Supply chain disruptions due to global events can also impact production and market stability. These factors can lead to variations in profitability and market growth.
Emerging Opportunities in SBR and SSBR
Emerging opportunities include the growing demand for high-performance tires in emerging economies, increasing adoption of electric vehicles (EVs) requiring specialized tire materials, and the development of sustainable and bio-based SBR and SSBR. These present significant growth avenues for industry participants.
Leading Players in the SBR and SSBR Market
- Asahi Kasei
- Firestone
- JSR
- LANXESS
- Michelin
- Goodyear
- Trinseo
- Kumho Petrochemical
- Dynasol
- Zeon
- LG Chem
- Eni
- Sibur
- Sumitomo
- TSRC
- Chi Mei
- NKNH
- Karbochem
- Sinopec
- CNPC
- Ashland
- Synthos
- Bridgestone
- HIP-Petrohemija
- Zhechen
- Tianjin Lugang
- Fujian Petrochemical Industrial Group
Future Outlook for SBR and SSBR Market
The SBR and SSBR market is poised for continued growth, driven by factors such as the expanding automotive sector, increasing demand for high-performance tires, and ongoing innovations in tire technology. The focus on sustainability and the development of bio-based materials will shape the market's future trajectory. Strategic partnerships and collaborations will become increasingly important for success in this competitive landscape.
SBR and SSBR Segmentation
-
1. Application
- 1.1. Adhesives
- 1.2. Automotive
- 1.3. Tires
- 1.4. Footwear
- 1.5. Others
-
2. Types
- 2.1. Solution Polymerized Styrene-Butadiene Rubber (SSBR)
- 2.2. Styrene–Butadiene Rubber (SBR)
SBR and SSBR Segmentation By Geography
-
1. North America
- 1.1. United States
- 1.2. Canada
- 1.3. Mexico
-
2. South America
- 2.1. Brazil
- 2.2. Argentina
- 2.3. Rest of South America
-
3. Europe
- 3.1. United Kingdom
- 3.2. Germany
- 3.3. France
- 3.4. Italy
- 3.5. Spain
- 3.6. Russia
- 3.7. Benelux
- 3.8. Nordics
- 3.9. Rest of Europe
-
4. Middle East & Africa
- 4.1. Turkey
- 4.2. Israel
- 4.3. GCC
- 4.4. North Africa
- 4.5. South Africa
- 4.6. Rest of Middle East & Africa
-
5. Asia Pacific
- 5.1. China
- 5.2. India
- 5.3. Japan
- 5.4. South Korea
- 5.5. ASEAN
- 5.6. Oceania
- 5.7. Rest of Asia Pacific
SBR and SSBR Regional Market Share
Geographic Coverage of SBR and SSBR
SBR and SSBR REPORT HIGHLIGHTS
| Aspects | Details |
|---|---|
| Study Period | 2020-2034 |
| Base Year | 2025 |
| Estimated Year | 2026 |
| Forecast Period | 2026-2034 |
| Historical Period | 2020-2025 |
| Growth Rate | CAGR of XX% from 2020-2034 |
| Segmentation |
|
Table of Contents
- 1. Introduction
- 1.1. Research Scope
- 1.2. Market Segmentation
- 1.3. Research Objective
- 1.4. Definitions and Assumptions
- 2. Executive Summary
- 2.1. Market Snapshot
- 3. Market Dynamics
- 3.1. Market Drivers
- 3.2. Market Restrains
- 3.3. Market Trends
- 3.4. Market Opportunities
- 4. Market Factor Analysis
- 4.1. Porters Five Forces
- 4.1.1. Bargaining Power of Suppliers
- 4.1.2. Bargaining Power of Buyers
- 4.1.3. Threat of New Entrants
- 4.1.4. Threat of Substitutes
- 4.1.5. Competitive Rivalry
- 4.2. PESTEL analysis
- 4.3. BCG Analysis
- 4.3.1. Stars (High Growth, High Market Share)
- 4.3.2. Cash Cows (Low Growth, High Market Share)
- 4.3.3. Question Mark (High Growth, Low Market Share)
- 4.3.4. Dogs (Low Growth, Low Market Share)
- 4.4. Ansoff Matrix Analysis
- 4.5. Supply Chain Analysis
- 4.6. Regulatory Landscape
- 4.7. Current Market Potential and Opportunity Assessment (TAM–SAM–SOM Framework)
- 4.8. PRI Analyst Note
- 4.1. Porters Five Forces
- 5. Market Analysis, Insights and Forecast 2021-2033
- 5.1. Market Analysis, Insights and Forecast - by Application
- 5.1.1. Adhesives
- 5.1.2. Automotive
- 5.1.3. Tires
- 5.1.4. Footwear
- 5.1.5. Others
- 5.2. Market Analysis, Insights and Forecast - by Types
- 5.2.1. Solution Polymerized Styrene-Butadiene Rubber (SSBR)
- 5.2.2. Styrene–Butadiene Rubber (SBR)
- 5.3. Market Analysis, Insights and Forecast - by Region
- 5.3.1. North America
- 5.3.2. South America
- 5.3.3. Europe
- 5.3.4. Middle East & Africa
- 5.3.5. Asia Pacific
- 5.1. Market Analysis, Insights and Forecast - by Application
- 6. Global SBR and SSBR Analysis, Insights and Forecast, 2021-2033
- 6.1. Market Analysis, Insights and Forecast - by Application
- 6.1.1. Adhesives
- 6.1.2. Automotive
- 6.1.3. Tires
- 6.1.4. Footwear
- 6.1.5. Others
- 6.2. Market Analysis, Insights and Forecast - by Types
- 6.2.1. Solution Polymerized Styrene-Butadiene Rubber (SSBR)
- 6.2.2. Styrene–Butadiene Rubber (SBR)
- 6.1. Market Analysis, Insights and Forecast - by Application
- 7. North America SBR and SSBR Analysis, Insights and Forecast, 2020-2032
- 7.1. Market Analysis, Insights and Forecast - by Application
- 7.1.1. Adhesives
- 7.1.2. Automotive
- 7.1.3. Tires
- 7.1.4. Footwear
- 7.1.5. Others
- 7.2. Market Analysis, Insights and Forecast - by Types
- 7.2.1. Solution Polymerized Styrene-Butadiene Rubber (SSBR)
- 7.2.2. Styrene–Butadiene Rubber (SBR)
- 7.1. Market Analysis, Insights and Forecast - by Application
- 8. South America SBR and SSBR Analysis, Insights and Forecast, 2020-2032
- 8.1. Market Analysis, Insights and Forecast - by Application
- 8.1.1. Adhesives
- 8.1.2. Automotive
- 8.1.3. Tires
- 8.1.4. Footwear
- 8.1.5. Others
- 8.2. Market Analysis, Insights and Forecast - by Types
- 8.2.1. Solution Polymerized Styrene-Butadiene Rubber (SSBR)
- 8.2.2. Styrene–Butadiene Rubber (SBR)
- 8.1. Market Analysis, Insights and Forecast - by Application
- 9. Europe SBR and SSBR Analysis, Insights and Forecast, 2020-2032
- 9.1. Market Analysis, Insights and Forecast - by Application
- 9.1.1. Adhesives
- 9.1.2. Automotive
- 9.1.3. Tires
- 9.1.4. Footwear
- 9.1.5. Others
- 9.2. Market Analysis, Insights and Forecast - by Types
- 9.2.1. Solution Polymerized Styrene-Butadiene Rubber (SSBR)
- 9.2.2. Styrene–Butadiene Rubber (SBR)
- 9.1. Market Analysis, Insights and Forecast - by Application
- 10. Middle East & Africa SBR and SSBR Analysis, Insights and Forecast, 2020-2032
- 10.1. Market Analysis, Insights and Forecast - by Application
- 10.1.1. Adhesives
- 10.1.2. Automotive
- 10.1.3. Tires
- 10.1.4. Footwear
- 10.1.5. Others
- 10.2. Market Analysis, Insights and Forecast - by Types
- 10.2.1. Solution Polymerized Styrene-Butadiene Rubber (SSBR)
- 10.2.2. Styrene–Butadiene Rubber (SBR)
- 10.1. Market Analysis, Insights and Forecast - by Application
- 11. Asia Pacific SBR and SSBR Analysis, Insights and Forecast, 2020-2032
- 11.1. Market Analysis, Insights and Forecast - by Application
- 11.1.1. Adhesives
- 11.1.2. Automotive
- 11.1.3. Tires
- 11.1.4. Footwear
- 11.1.5. Others
- 11.2. Market Analysis, Insights and Forecast - by Types
- 11.2.1. Solution Polymerized Styrene-Butadiene Rubber (SSBR)
- 11.2.2. Styrene–Butadiene Rubber (SBR)
- 11.1. Market Analysis, Insights and Forecast - by Application
- 12. Competitive Analysis
- 12.1. Company Profiles
- 12.1.1 Asahi Kasei
- 12.1.1.1. Company Overview
- 12.1.1.2. Products
- 12.1.1.3. Company Financials
- 12.1.1.4. SWOT Analysis
- 12.1.2 Firestone
- 12.1.2.1. Company Overview
- 12.1.2.2. Products
- 12.1.2.3. Company Financials
- 12.1.2.4. SWOT Analysis
- 12.1.3 JSR
- 12.1.3.1. Company Overview
- 12.1.3.2. Products
- 12.1.3.3. Company Financials
- 12.1.3.4. SWOT Analysis
- 12.1.4 LANXESS
- 12.1.4.1. Company Overview
- 12.1.4.2. Products
- 12.1.4.3. Company Financials
- 12.1.4.4. SWOT Analysis
- 12.1.5 Michelin
- 12.1.5.1. Company Overview
- 12.1.5.2. Products
- 12.1.5.3. Company Financials
- 12.1.5.4. SWOT Analysis
- 12.1.6 Goodyear
- 12.1.6.1. Company Overview
- 12.1.6.2. Products
- 12.1.6.3. Company Financials
- 12.1.6.4. SWOT Analysis
- 12.1.7 Trinseo
- 12.1.7.1. Company Overview
- 12.1.7.2. Products
- 12.1.7.3. Company Financials
- 12.1.7.4. SWOT Analysis
- 12.1.8 Kumho Petrochemical
- 12.1.8.1. Company Overview
- 12.1.8.2. Products
- 12.1.8.3. Company Financials
- 12.1.8.4. SWOT Analysis
- 12.1.9 Dynasol
- 12.1.9.1. Company Overview
- 12.1.9.2. Products
- 12.1.9.3. Company Financials
- 12.1.9.4. SWOT Analysis
- 12.1.10 Zeon
- 12.1.10.1. Company Overview
- 12.1.10.2. Products
- 12.1.10.3. Company Financials
- 12.1.10.4. SWOT Analysis
- 12.1.11 LG Chem
- 12.1.11.1. Company Overview
- 12.1.11.2. Products
- 12.1.11.3. Company Financials
- 12.1.11.4. SWOT Analysis
- 12.1.12 Eni
- 12.1.12.1. Company Overview
- 12.1.12.2. Products
- 12.1.12.3. Company Financials
- 12.1.12.4. SWOT Analysis
- 12.1.13 Sibur
- 12.1.13.1. Company Overview
- 12.1.13.2. Products
- 12.1.13.3. Company Financials
- 12.1.13.4. SWOT Analysis
- 12.1.14 Sumitomo
- 12.1.14.1. Company Overview
- 12.1.14.2. Products
- 12.1.14.3. Company Financials
- 12.1.14.4. SWOT Analysis
- 12.1.15 TSRC
- 12.1.15.1. Company Overview
- 12.1.15.2. Products
- 12.1.15.3. Company Financials
- 12.1.15.4. SWOT Analysis
- 12.1.16 Chi Mei
- 12.1.16.1. Company Overview
- 12.1.16.2. Products
- 12.1.16.3. Company Financials
- 12.1.16.4. SWOT Analysis
- 12.1.17 NKNH
- 12.1.17.1. Company Overview
- 12.1.17.2. Products
- 12.1.17.3. Company Financials
- 12.1.17.4. SWOT Analysis
- 12.1.18 Karbochem
- 12.1.18.1. Company Overview
- 12.1.18.2. Products
- 12.1.18.3. Company Financials
- 12.1.18.4. SWOT Analysis
- 12.1.19 Sinopec
- 12.1.19.1. Company Overview
- 12.1.19.2. Products
- 12.1.19.3. Company Financials
- 12.1.19.4. SWOT Analysis
- 12.1.20 CNPC
- 12.1.20.1. Company Overview
- 12.1.20.2. Products
- 12.1.20.3. Company Financials
- 12.1.20.4. SWOT Analysis
- 12.1.21 Ashland
- 12.1.21.1. Company Overview
- 12.1.21.2. Products
- 12.1.21.3. Company Financials
- 12.1.21.4. SWOT Analysis
- 12.1.22 Synthos
- 12.1.22.1. Company Overview
- 12.1.22.2. Products
- 12.1.22.3. Company Financials
- 12.1.22.4. SWOT Analysis
- 12.1.23 Bridgestone
- 12.1.23.1. Company Overview
- 12.1.23.2. Products
- 12.1.23.3. Company Financials
- 12.1.23.4. SWOT Analysis
- 12.1.24 HIP-Petrohemija
- 12.1.24.1. Company Overview
- 12.1.24.2. Products
- 12.1.24.3. Company Financials
- 12.1.24.4. SWOT Analysis
- 12.1.25 Zhechen
- 12.1.25.1. Company Overview
- 12.1.25.2. Products
- 12.1.25.3. Company Financials
- 12.1.25.4. SWOT Analysis
- 12.1.26 Tianjin Lugang
- 12.1.26.1. Company Overview
- 12.1.26.2. Products
- 12.1.26.3. Company Financials
- 12.1.26.4. SWOT Analysis
- 12.1.27 Fujian Petrochemical Industrial Group
- 12.1.27.1. Company Overview
- 12.1.27.2. Products
- 12.1.27.3. Company Financials
- 12.1.27.4. SWOT Analysis
- 12.1.1 Asahi Kasei
- 12.2. Market Entropy
- 12.2.1 Company's Key Areas Served
- 12.2.2 Recent Developments
- 12.3. Company Market Share Analysis 2025
- 12.3.1 Top 5 Companies Market Share Analysis
- 12.3.2 Top 3 Companies Market Share Analysis
- 12.4. List of Potential Customers
- 13. Research Methodology
List of Figures
- Figure 1: Global SBR and SSBR Revenue Breakdown (million, %) by Region 2025 & 2033
- Figure 2: North America SBR and SSBR Revenue (million), by Application 2025 & 2033
- Figure 3: North America SBR and SSBR Revenue Share (%), by Application 2025 & 2033
- Figure 4: North America SBR and SSBR Revenue (million), by Types 2025 & 2033
- Figure 5: North America SBR and SSBR Revenue Share (%), by Types 2025 & 2033
- Figure 6: North America SBR and SSBR Revenue (million), by Country 2025 & 2033
- Figure 7: North America SBR and SSBR Revenue Share (%), by Country 2025 & 2033
- Figure 8: South America SBR and SSBR Revenue (million), by Application 2025 & 2033
- Figure 9: South America SBR and SSBR Revenue Share (%), by Application 2025 & 2033
- Figure 10: South America SBR and SSBR Revenue (million), by Types 2025 & 2033
- Figure 11: South America SBR and SSBR Revenue Share (%), by Types 2025 & 2033
- Figure 12: South America SBR and SSBR Revenue (million), by Country 2025 & 2033
- Figure 13: South America SBR and SSBR Revenue Share (%), by Country 2025 & 2033
- Figure 14: Europe SBR and SSBR Revenue (million), by Application 2025 & 2033
- Figure 15: Europe SBR and SSBR Revenue Share (%), by Application 2025 & 2033
- Figure 16: Europe SBR and SSBR Revenue (million), by Types 2025 & 2033
- Figure 17: Europe SBR and SSBR Revenue Share (%), by Types 2025 & 2033
- Figure 18: Europe SBR and SSBR Revenue (million), by Country 2025 & 2033
- Figure 19: Europe SBR and SSBR Revenue Share (%), by Country 2025 & 2033
- Figure 20: Middle East & Africa SBR and SSBR Revenue (million), by Application 2025 & 2033
- Figure 21: Middle East & Africa SBR and SSBR Revenue Share (%), by Application 2025 & 2033
- Figure 22: Middle East & Africa SBR and SSBR Revenue (million), by Types 2025 & 2033
- Figure 23: Middle East & Africa SBR and SSBR Revenue Share (%), by Types 2025 & 2033
- Figure 24: Middle East & Africa SBR and SSBR Revenue (million), by Country 2025 & 2033
- Figure 25: Middle East & Africa SBR and SSBR Revenue Share (%), by Country 2025 & 2033
- Figure 26: Asia Pacific SBR and SSBR Revenue (million), by Application 2025 & 2033
- Figure 27: Asia Pacific SBR and SSBR Revenue Share (%), by Application 2025 & 2033
- Figure 28: Asia Pacific SBR and SSBR Revenue (million), by Types 2025 & 2033
- Figure 29: Asia Pacific SBR and SSBR Revenue Share (%), by Types 2025 & 2033
- Figure 30: Asia Pacific SBR and SSBR Revenue (million), by Country 2025 & 2033
- Figure 31: Asia Pacific SBR and SSBR Revenue Share (%), by Country 2025 & 2033
List of Tables
- Table 1: Global SBR and SSBR Revenue million Forecast, by Application 2020 & 2033
- Table 2: Global SBR and SSBR Revenue million Forecast, by Types 2020 & 2033
- Table 3: Global SBR and SSBR Revenue million Forecast, by Region 2020 & 2033
- Table 4: Global SBR and SSBR Revenue million Forecast, by Application 2020 & 2033
- Table 5: Global SBR and SSBR Revenue million Forecast, by Types 2020 & 2033
- Table 6: Global SBR and SSBR Revenue million Forecast, by Country 2020 & 2033
- Table 7: United States SBR and SSBR Revenue (million) Forecast, by Application 2020 & 2033
- Table 8: Canada SBR and SSBR Revenue (million) Forecast, by Application 2020 & 2033
- Table 9: Mexico SBR and SSBR Revenue (million) Forecast, by Application 2020 & 2033
- Table 10: Global SBR and SSBR Revenue million Forecast, by Application 2020 & 2033
- Table 11: Global SBR and SSBR Revenue million Forecast, by Types 2020 & 2033
- Table 12: Global SBR and SSBR Revenue million Forecast, by Country 2020 & 2033
- Table 13: Brazil SBR and SSBR Revenue (million) Forecast, by Application 2020 & 2033
- Table 14: Argentina SBR and SSBR Revenue (million) Forecast, by Application 2020 & 2033
- Table 15: Rest of South America SBR and SSBR Revenue (million) Forecast, by Application 2020 & 2033
- Table 16: Global SBR and SSBR Revenue million Forecast, by Application 2020 & 2033
- Table 17: Global SBR and SSBR Revenue million Forecast, by Types 2020 & 2033
- Table 18: Global SBR and SSBR Revenue million Forecast, by Country 2020 & 2033
- Table 19: United Kingdom SBR and SSBR Revenue (million) Forecast, by Application 2020 & 2033
- Table 20: Germany SBR and SSBR Revenue (million) Forecast, by Application 2020 & 2033
- Table 21: France SBR and SSBR Revenue (million) Forecast, by Application 2020 & 2033
- Table 22: Italy SBR and SSBR Revenue (million) Forecast, by Application 2020 & 2033
- Table 23: Spain SBR and SSBR Revenue (million) Forecast, by Application 2020 & 2033
- Table 24: Russia SBR and SSBR Revenue (million) Forecast, by Application 2020 & 2033
- Table 25: Benelux SBR and SSBR Revenue (million) Forecast, by Application 2020 & 2033
- Table 26: Nordics SBR and SSBR Revenue (million) Forecast, by Application 2020 & 2033
- Table 27: Rest of Europe SBR and SSBR Revenue (million) Forecast, by Application 2020 & 2033
- Table 28: Global SBR and SSBR Revenue million Forecast, by Application 2020 & 2033
- Table 29: Global SBR and SSBR Revenue million Forecast, by Types 2020 & 2033
- Table 30: Global SBR and SSBR Revenue million Forecast, by Country 2020 & 2033
- Table 31: Turkey SBR and SSBR Revenue (million) Forecast, by Application 2020 & 2033
- Table 32: Israel SBR and SSBR Revenue (million) Forecast, by Application 2020 & 2033
- Table 33: GCC SBR and SSBR Revenue (million) Forecast, by Application 2020 & 2033
- Table 34: North Africa SBR and SSBR Revenue (million) Forecast, by Application 2020 & 2033
- Table 35: South Africa SBR and SSBR Revenue (million) Forecast, by Application 2020 & 2033
- Table 36: Rest of Middle East & Africa SBR and SSBR Revenue (million) Forecast, by Application 2020 & 2033
- Table 37: Global SBR and SSBR Revenue million Forecast, by Application 2020 & 2033
- Table 38: Global SBR and SSBR Revenue million Forecast, by Types 2020 & 2033
- Table 39: Global SBR and SSBR Revenue million Forecast, by Country 2020 & 2033
- Table 40: China SBR and SSBR Revenue (million) Forecast, by Application 2020 & 2033
- Table 41: India SBR and SSBR Revenue (million) Forecast, by Application 2020 & 2033
- Table 42: Japan SBR and SSBR Revenue (million) Forecast, by Application 2020 & 2033
- Table 43: South Korea SBR and SSBR Revenue (million) Forecast, by Application 2020 & 2033
- Table 44: ASEAN SBR and SSBR Revenue (million) Forecast, by Application 2020 & 2033
- Table 45: Oceania SBR and SSBR Revenue (million) Forecast, by Application 2020 & 2033
- Table 46: Rest of Asia Pacific SBR and SSBR Revenue (million) Forecast, by Application 2020 & 2033
Frequently Asked Questions
1. What is the projected Compound Annual Growth Rate (CAGR) of the SBR and SSBR?
The projected CAGR is approximately XX%.
2. Which companies are prominent players in the SBR and SSBR?
Key companies in the market include Asahi Kasei, Firestone, JSR, LANXESS, Michelin, Goodyear, Trinseo, Kumho Petrochemical, Dynasol, Zeon, LG Chem, Eni, Sibur, Sumitomo, TSRC, Chi Mei, NKNH, Karbochem, Sinopec, CNPC, Ashland, Synthos, Bridgestone, HIP-Petrohemija, Zhechen, Tianjin Lugang, Fujian Petrochemical Industrial Group.
3. What are the main segments of the SBR and SSBR?
The market segments include Application, Types.
4. Can you provide details about the market size?
The market size is estimated to be USD XXX million as of 2022.
5. What are some drivers contributing to market growth?
N/A
6. What are the notable trends driving market growth?
N/A
7. Are there any restraints impacting market growth?
N/A
8. Can you provide examples of recent developments in the market?
N/A
9. What pricing options are available for accessing the report?
Pricing options include single-user, multi-user, and enterprise licenses priced at USD 4900.00, USD 7350.00, and USD 9800.00 respectively.
10. Is the market size provided in terms of value or volume?
The market size is provided in terms of value, measured in million.
11. Are there any specific market keywords associated with the report?
Yes, the market keyword associated with the report is "SBR and SSBR," which aids in identifying and referencing the specific market segment covered.
12. How do I determine which pricing option suits my needs best?
The pricing options vary based on user requirements and access needs. Individual users may opt for single-user licenses, while businesses requiring broader access may choose multi-user or enterprise licenses for cost-effective access to the report.
13. Are there any additional resources or data provided in the SBR and SSBR report?
While the report offers comprehensive insights, it's advisable to review the specific contents or supplementary materials provided to ascertain if additional resources or data are available.
14. How can I stay updated on further developments or reports in the SBR and SSBR?
To stay informed about further developments, trends, and reports in the SBR and SSBR, consider subscribing to industry newsletters, following relevant companies and organizations, or regularly checking reputable industry news sources and publications.
Methodology
Step 1 - Identification of Relevant Samples Size from Population Database


Step 2 - Approaches for Defining Global Market Size (Value, Volume* & Price*)

Note*: In applicable scenarios
Step 3 - Data Sources
Primary Research
- Web Analytics
- Survey Reports
- Research Institute
- Latest Research Reports
- Opinion Leaders
Secondary Research
- Annual Reports
- White Paper
- Latest Press Release
- Industry Association
- Paid Database
- Investor Presentations

Step 4 - Data Triangulation
Involves using different sources of information in order to increase the validity of a study
These sources are likely to be stakeholders in a program - participants, other researchers, program staff, other community members, and so on.
Then we put all data in single framework & apply various statistical tools to find out the dynamic on the market.
During the analysis stage, feedback from the stakeholder groups would be compared to determine areas of agreement as well as areas of divergence

