
Key Insights
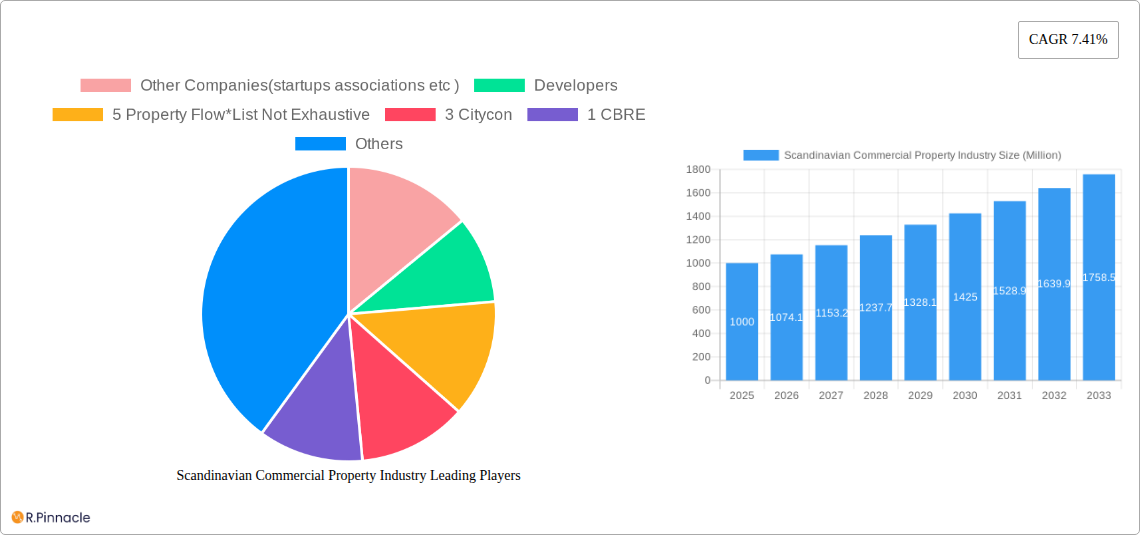
The Scandinavian commercial property market, encompassing Denmark, Norway, and Sweden, exhibits robust growth potential, driven by a confluence of factors. Strong economic performance across the region, coupled with increasing urbanization and a burgeoning population in key cities like Oslo, Stockholm, and Copenhagen, fuels demand for office, retail, and logistics spaces. The rise of e-commerce significantly boosts the logistics sector, while a thriving tech industry and a focus on sustainable development influence the demand for modern, energy-efficient office buildings. Furthermore, a growing tourism sector supports expansion in the hospitality segment. While construction costs and potential interest rate fluctuations pose challenges, the overall market outlook remains positive, projected to maintain a Compound Annual Growth Rate (CAGR) of 7.41% from 2025 to 2033. This growth is further segmented across various property types, with office spaces likely holding a significant share, followed by retail and logistics, reflecting the diversified economic landscape. Key players like CBRE, Cushman & Wakefield, and Nordic real estate investment firms are actively shaping the market through development and investment activities. The presence of numerous smaller developers and real estate agencies underscores a competitive but dynamic market environment.
The significant investment in infrastructure development and government initiatives promoting sustainable urban planning further enhance the market's positive trajectory. However, challenges remain. Limited land availability in prime city locations can restrict new development. Furthermore, the market's susceptibility to global economic downturns requires careful consideration. Nevertheless, the long-term prospects for the Scandinavian commercial property market remain strong, particularly in strategically located cities benefiting from robust economic activity and population growth. Diversification across property types and a focus on sustainability are likely to be key factors driving future growth. The industry's competitive landscape, with both large international players and smaller local firms, ensures a dynamic and adaptive market capable of meeting evolving demands.
Scandinavian Commercial Property Industry: Market Analysis & Forecast (2019-2033)
This comprehensive report provides a detailed analysis of the Scandinavian commercial property market, encompassing market structure, dynamics, key players, and future outlook. Covering Denmark, Norway, and Sweden, with a focus on key cities like Oslo, Stockholm, and Copenhagen, this report is an essential resource for industry professionals, investors, and strategists. The study period spans 2019-2033, with a base year of 2025 and a forecast period of 2025-2033. Market values are expressed in Millions.
Scandinavian Commercial Property Industry Market Structure & Innovation Trends
This section analyzes the market concentration, innovation drivers, regulatory frameworks, product substitutes, end-user demographics, and M&A activities within the Scandinavian commercial property sector. The market is characterized by a mix of large international players and smaller, specialized firms.
- Market Concentration: The market exhibits moderate concentration, with a few dominant players alongside numerous smaller firms. The top 5 developers (including BPT Group, Citycon, and others) hold an estimated xx% market share in 2025.
- Innovation Drivers: Sustainability initiatives, technological advancements (proptech), and evolving consumer preferences drive innovation.
- Regulatory Frameworks: Varying regulations across the three countries influence development and investment decisions.
- M&A Activity: The historical period (2019-2024) saw approximately xx Million in M&A deal value, with an anticipated increase in the forecast period. Key drivers include consolidation and expansion strategies.
- Product Substitutes: The rise of co-working spaces and flexible office solutions presents a notable substitute for traditional office leases.
Scandinavian Commercial Property Industry Market Dynamics & Trends
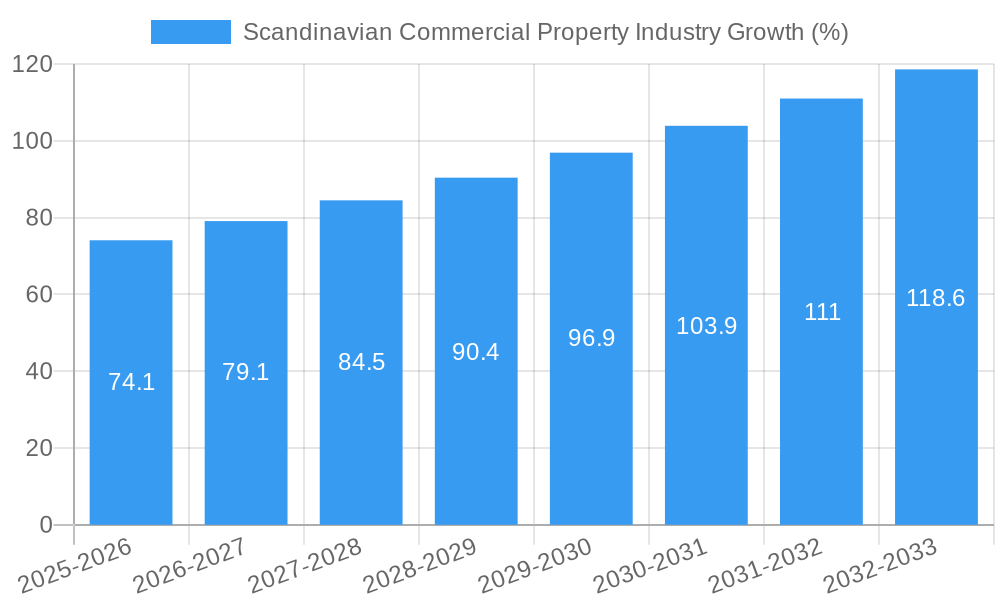
This section explores the market's growth trajectory, technological disruptions, consumer preferences, and competitive dynamics. The Scandinavian commercial property market is experiencing robust growth, driven by factors like urbanization, population growth, and increasing demand for modern, sustainable spaces.
The Compound Annual Growth Rate (CAGR) for the overall market is projected at xx% from 2025 to 2033. Market penetration of green building certifications is steadily increasing, indicating a shift towards sustainable practices. Technological advancements in areas such as building management systems and data analytics are reshaping operational efficiency. Increased competition necessitates strategic investments in technology and customer experience to maintain a competitive edge.
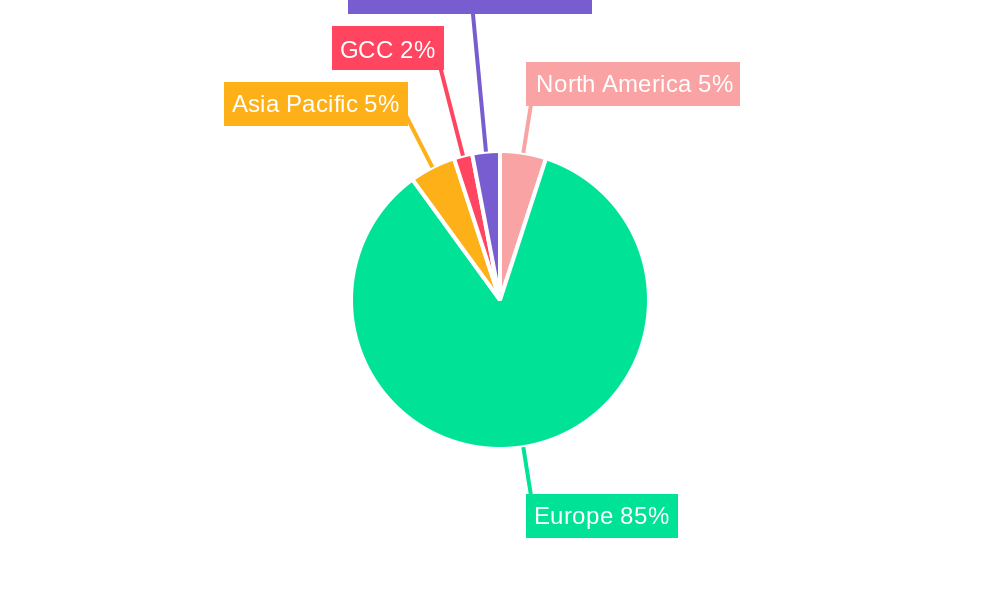
Dominant Regions & Segments in Scandinavian Commercial Property Industry
This section pinpoints the leading regions and segments within the Scandinavian commercial property market.
By Country: Sweden is projected to be the largest market by 2033, driven by strong economic growth and significant investments in infrastructure. However, all three countries—Denmark, Norway, and Sweden—demonstrate significant growth.
By City: Stockholm, Copenhagen, and Oslo dominate as key commercial hubs. Their strengths stem from strong economies, established infrastructure, and attractive business environments.
By Type: The office segment holds the largest market share, followed closely by the industrial/logistics segment, fueled by e-commerce growth and increasing demand for warehouse and distribution space. The multi-family sector experiences steady growth, driven by population growth and changing living preferences.
Key Drivers: Strong economic performance, robust infrastructure development, favorable government policies, and a thriving technology sector are key drivers of dominance in these regions and segments.
Scandinavian Commercial Property Industry Product Innovations
Recent innovations focus on sustainable building materials, smart building technologies (IoT integration), and flexible workspaces catering to evolving user needs. These innovations offer competitive advantages through increased efficiency, reduced operational costs, and improved tenant satisfaction, enhancing market appeal and attracting investors.
Report Scope & Segmentation Analysis
This report segments the market by country (Denmark, Norway, Sweden), city (Oslo, Stockholm, Copenhagen), and property type (Offices, Retail, Industrial, Logistics, Multi-family, Hospitality). Each segment's growth projections, market sizes, and competitive dynamics are analyzed individually, offering a granular understanding of the market landscape. For example, the office segment is expected to experience a xx% CAGR driven by expansion of tech companies in major cities.
Key Drivers of Scandinavian Commercial Property Industry Growth
The Scandinavian commercial property market's growth is fueled by several key factors:
- Strong Economic Fundamentals: The region benefits from strong economic growth and low unemployment rates.
- Technological Advancements: Proptech innovations enhance efficiency and attract investment.
- Sustainable Development Initiatives: Growing focus on environmentally friendly buildings attracts investors and tenants.
- Urbanization and Population Growth: Increasing urbanization and population density fuel demand for commercial spaces.
Challenges in the Scandinavian Commercial Property Industry Sector
The industry faces several challenges:
- Supply Chain Disruptions: Global supply chain issues impacting construction timelines and material costs.
- Regulatory Hurdles: Navigating varying regulations across countries can complicate development projects.
- Increased Competition: Intense competition necessitates strategic innovation and differentiation. This impact is estimated to result in a xx% reduction in profit margin for some segments.
Emerging Opportunities in Scandinavian Commercial Property Industry
The market presents significant opportunities:
- Growth of the Tech Sector: Expanding tech industry demand for modern office spaces and data centers.
- Focus on Sustainability: Increased demand for green and sustainable buildings presents significant investment opportunities.
- E-commerce Boom: The rise of e-commerce fuels growth in the industrial/logistics sector.
Leading Players in the Scandinavian Commercial Property Industry Market
- Other Companies (startups, associations, etc.)
- Developers:
- Property Flow (5)
- Citycon (3)
- BPT Group (5)
- Jeudan A/S (2)
- Vasakronan AB (1)
- Cushman and Wakefield (4)
- Real Estate Agencies:
- CBRE (1)
- Colliers International (3)
- Europages (2)
- NREP (Logicenters) (4)
- Nordkap (2)
- Spotscale (3)
- WEC360 (4)
- Stronghold (1)
Note: Numbers in parentheses indicate estimated market presence. This list is not exhaustive.
Key Developments in Scandinavian Commercial Property Industry Industry
- 2022 Q4: Increased investment in sustainable building projects across the region.
- 2023 Q1: Launch of several new proptech platforms focused on improving building management.
- 2023 Q3: Significant merger between two major developers, resulting in increased market consolidation. (Further details are needed for specific impact).
Future Outlook for Scandinavian Commercial Property Industry Market
The Scandinavian commercial property market is poised for continued growth, driven by strong economic fundamentals, technological advancements, and a focus on sustainable development. The increasing demand for modern, flexible, and sustainable spaces will present significant opportunities for investors and developers in the coming years. Further expansion into new technologies and adaptation to evolving consumer preferences will be crucial for success.
Scandinavian Commercial Property Industry Segmentation
-
1. Type
- 1.1. Offices
- 1.2. Retail
- 1.3. Industrial
- 1.4. Logistics
- 1.5. Multi-family
- 1.6. Hospitality
-
2. Countries
- 2.1. Denmark
- 2.2. Norway
- 2.3. Sweden
-
3. Key Cities
- 3.1. Oslo
- 3.2. Stockholm
- 3.3. Copenhagen
Scandinavian Commercial Property Industry Segmentation By Geography
-
1. North America
- 1.1. United States
- 1.2. Canada
- 1.3. Mexico
-
2. South America
- 2.1. Brazil
- 2.2. Argentina
- 2.3. Rest of South America
-
3. Europe
- 3.1. United Kingdom
- 3.2. Germany
- 3.3. France
- 3.4. Italy
- 3.5. Spain
- 3.6. Russia
- 3.7. Benelux
- 3.8. Nordics
- 3.9. Rest of Europe
-
4. Middle East & Africa
- 4.1. Turkey
- 4.2. Israel
- 4.3. GCC
- 4.4. North Africa
- 4.5. South Africa
- 4.6. Rest of Middle East & Africa
-
5. Asia Pacific
- 5.1. China
- 5.2. India
- 5.3. Japan
- 5.4. South Korea
- 5.5. ASEAN
- 5.6. Oceania
- 5.7. Rest of Asia Pacific
Scandinavian Commercial Property Industry REPORT HIGHLIGHTS
| Aspects | Details |
|---|---|
| Study Period | 2019-2033 |
| Base Year | 2024 |
| Estimated Year | 2025 |
| Forecast Period | 2025-2033 |
| Historical Period | 2019-2024 |
| Growth Rate | CAGR of 7.41% from 2019-2033 |
| Segmentation |
|
Table of Contents
- 1. Introduction
- 1.1. Research Scope
- 1.2. Market Segmentation
- 1.3. Research Methodology
- 1.4. Definitions and Assumptions
- 2. Executive Summary
- 2.1. Introduction
- 3. Market Dynamics
- 3.1. Introduction
- 3.2. Market Drivers
- 3.2.1. Overall economic growth driving the market; The growth of business and industries driving the market
- 3.3. Market Restrains
- 3.3.1. Fluctuating economic conditions hindering the growth of the market; Difficulty in landownership and leasing rights affecting the market
- 3.4. Market Trends
- 3.4.1. Increase in Transaction Volume in the Office Market of Scandinavian Countries
- 4. Market Factor Analysis
- 4.1. Porters Five Forces
- 4.2. Supply/Value Chain
- 4.3. PESTEL analysis
- 4.4. Market Entropy
- 4.5. Patent/Trademark Analysis
- 5. Global Scandinavian Commercial Property Industry Analysis, Insights and Forecast, 2019-2031
- 5.1. Market Analysis, Insights and Forecast - by Type
- 5.1.1. Offices
- 5.1.2. Retail
- 5.1.3. Industrial
- 5.1.4. Logistics
- 5.1.5. Multi-family
- 5.1.6. Hospitality
- 5.2. Market Analysis, Insights and Forecast - by Countries
- 5.2.1. Denmark
- 5.2.2. Norway
- 5.2.3. Sweden
- 5.3. Market Analysis, Insights and Forecast - by Key Cities
- 5.3.1. Oslo
- 5.3.2. Stockholm
- 5.3.3. Copenhagen
- 5.4. Market Analysis, Insights and Forecast - by Region
- 5.4.1. North America
- 5.4.2. South America
- 5.4.3. Europe
- 5.4.4. Middle East & Africa
- 5.4.5. Asia Pacific
- 5.1. Market Analysis, Insights and Forecast - by Type
- 6. North America Scandinavian Commercial Property Industry Analysis, Insights and Forecast, 2019-2031
- 6.1. Market Analysis, Insights and Forecast - by Type
- 6.1.1. Offices
- 6.1.2. Retail
- 6.1.3. Industrial
- 6.1.4. Logistics
- 6.1.5. Multi-family
- 6.1.6. Hospitality
- 6.2. Market Analysis, Insights and Forecast - by Countries
- 6.2.1. Denmark
- 6.2.2. Norway
- 6.2.3. Sweden
- 6.3. Market Analysis, Insights and Forecast - by Key Cities
- 6.3.1. Oslo
- 6.3.2. Stockholm
- 6.3.3. Copenhagen
- 6.1. Market Analysis, Insights and Forecast - by Type
- 7. South America Scandinavian Commercial Property Industry Analysis, Insights and Forecast, 2019-2031
- 7.1. Market Analysis, Insights and Forecast - by Type
- 7.1.1. Offices
- 7.1.2. Retail
- 7.1.3. Industrial
- 7.1.4. Logistics
- 7.1.5. Multi-family
- 7.1.6. Hospitality
- 7.2. Market Analysis, Insights and Forecast - by Countries
- 7.2.1. Denmark
- 7.2.2. Norway
- 7.2.3. Sweden
- 7.3. Market Analysis, Insights and Forecast - by Key Cities
- 7.3.1. Oslo
- 7.3.2. Stockholm
- 7.3.3. Copenhagen
- 7.1. Market Analysis, Insights and Forecast - by Type
- 8. Europe Scandinavian Commercial Property Industry Analysis, Insights and Forecast, 2019-2031
- 8.1. Market Analysis, Insights and Forecast - by Type
- 8.1.1. Offices
- 8.1.2. Retail
- 8.1.3. Industrial
- 8.1.4. Logistics
- 8.1.5. Multi-family
- 8.1.6. Hospitality
- 8.2. Market Analysis, Insights and Forecast - by Countries
- 8.2.1. Denmark
- 8.2.2. Norway
- 8.2.3. Sweden
- 8.3. Market Analysis, Insights and Forecast - by Key Cities
- 8.3.1. Oslo
- 8.3.2. Stockholm
- 8.3.3. Copenhagen
- 8.1. Market Analysis, Insights and Forecast - by Type
- 9. Middle East & Africa Scandinavian Commercial Property Industry Analysis, Insights and Forecast, 2019-2031
- 9.1. Market Analysis, Insights and Forecast - by Type
- 9.1.1. Offices
- 9.1.2. Retail
- 9.1.3. Industrial
- 9.1.4. Logistics
- 9.1.5. Multi-family
- 9.1.6. Hospitality
- 9.2. Market Analysis, Insights and Forecast - by Countries
- 9.2.1. Denmark
- 9.2.2. Norway
- 9.2.3. Sweden
- 9.3. Market Analysis, Insights and Forecast - by Key Cities
- 9.3.1. Oslo
- 9.3.2. Stockholm
- 9.3.3. Copenhagen
- 9.1. Market Analysis, Insights and Forecast - by Type
- 10. Asia Pacific Scandinavian Commercial Property Industry Analysis, Insights and Forecast, 2019-2031
- 10.1. Market Analysis, Insights and Forecast - by Type
- 10.1.1. Offices
- 10.1.2. Retail
- 10.1.3. Industrial
- 10.1.4. Logistics
- 10.1.5. Multi-family
- 10.1.6. Hospitality
- 10.2. Market Analysis, Insights and Forecast - by Countries
- 10.2.1. Denmark
- 10.2.2. Norway
- 10.2.3. Sweden
- 10.3. Market Analysis, Insights and Forecast - by Key Cities
- 10.3.1. Oslo
- 10.3.2. Stockholm
- 10.3.3. Copenhagen
- 10.1. Market Analysis, Insights and Forecast - by Type
- 11. North America Scandinavian Commercial Property Industry Analysis, Insights and Forecast, 2019-2031
- 11.1. Market Analysis, Insights and Forecast - By Country/Sub-region
- 11.1.1.
- 12. Asia Pacific Scandinavian Commercial Property Industry Analysis, Insights and Forecast, 2019-2031
- 12.1. Market Analysis, Insights and Forecast - By Country/Sub-region
- 12.1.1.
- 13. Europe Scandinavian Commercial Property Industry Analysis, Insights and Forecast, 2019-2031
- 13.1. Market Analysis, Insights and Forecast - By Country/Sub-region
- 13.1.1.
- 14. GCC Scandinavian Commercial Property Industry Analysis, Insights and Forecast, 2019-2031
- 14.1. Market Analysis, Insights and Forecast - By Country/Sub-region
- 14.1.1.
- 15. Rest of the World Scandinavian Commercial Property Industry Analysis, Insights and Forecast, 2019-2031
- 15.1. Market Analysis, Insights and Forecast - By Country/Sub-region
- 15.1.1.
- 16. Competitive Analysis
- 16.1. Global Market Share Analysis 2024
- 16.2. Company Profiles
- 16.2.1 Other Companies(startups associations etc )
- 16.2.1.1. Overview
- 16.2.1.2. Products
- 16.2.1.3. SWOT Analysis
- 16.2.1.4. Recent Developments
- 16.2.1.5. Financials (Based on Availability)
- 16.2.2 Developers
- 16.2.2.1. Overview
- 16.2.2.2. Products
- 16.2.2.3. SWOT Analysis
- 16.2.2.4. Recent Developments
- 16.2.2.5. Financials (Based on Availability)
- 16.2.3 5 Property Flow*List Not Exhaustive
- 16.2.3.1. Overview
- 16.2.3.2. Products
- 16.2.3.3. SWOT Analysis
- 16.2.3.4. Recent Developments
- 16.2.3.5. Financials (Based on Availability)
- 16.2.4 3 Citycon
- 16.2.4.1. Overview
- 16.2.4.2. Products
- 16.2.4.3. SWOT Analysis
- 16.2.4.4. Recent Developments
- 16.2.4.5. Financials (Based on Availability)
- 16.2.5 1 CBRE
- 16.2.5.1. Overview
- 16.2.5.2. Products
- 16.2.5.3. SWOT Analysis
- 16.2.5.4. Recent Developments
- 16.2.5.5. Financials (Based on Availability)
- 16.2.6 5 BPT Group
- 16.2.6.1. Overview
- 16.2.6.2. Products
- 16.2.6.3. SWOT Analysis
- 16.2.6.4. Recent Developments
- 16.2.6.5. Financials (Based on Availability)
- 16.2.7 2 Jeudan A/S
- 16.2.7.1. Overview
- 16.2.7.2. Products
- 16.2.7.3. SWOT Analysis
- 16.2.7.4. Recent Developments
- 16.2.7.5. Financials (Based on Availability)
- 16.2.8 1 Vasakronan AB
- 16.2.8.1. Overview
- 16.2.8.2. Products
- 16.2.8.3. SWOT Analysis
- 16.2.8.4. Recent Developments
- 16.2.8.5. Financials (Based on Availability)
- 16.2.9 4 Cushman and wakefield
- 16.2.9.1. Overview
- 16.2.9.2. Products
- 16.2.9.3. SWOT Analysis
- 16.2.9.4. Recent Developments
- 16.2.9.5. Financials (Based on Availability)
- 16.2.10 Real Estate Agencies
- 16.2.10.1. Overview
- 16.2.10.2. Products
- 16.2.10.3. SWOT Analysis
- 16.2.10.4. Recent Developments
- 16.2.10.5. Financials (Based on Availability)
- 16.2.11 3 Colliers international
- 16.2.11.1. Overview
- 16.2.11.2. Products
- 16.2.11.3. SWOT Analysis
- 16.2.11.4. Recent Developments
- 16.2.11.5. Financials (Based on Availability)
- 16.2.12 2 Europages
- 16.2.12.1. Overview
- 16.2.12.2. Products
- 16.2.12.3. SWOT Analysis
- 16.2.12.4. Recent Developments
- 16.2.12.5. Financials (Based on Availability)
- 16.2.13 4 NREP (Logicenters)
- 16.2.13.1. Overview
- 16.2.13.2. Products
- 16.2.13.3. SWOT Analysis
- 16.2.13.4. Recent Developments
- 16.2.13.5. Financials (Based on Availability)
- 16.2.14 2 Nordkap
- 16.2.14.1. Overview
- 16.2.14.2. Products
- 16.2.14.3. SWOT Analysis
- 16.2.14.4. Recent Developments
- 16.2.14.5. Financials (Based on Availability)
- 16.2.15 3 Spotscale
- 16.2.15.1. Overview
- 16.2.15.2. Products
- 16.2.15.3. SWOT Analysis
- 16.2.15.4. Recent Developments
- 16.2.15.5. Financials (Based on Availability)
- 16.2.16 4 WEC360
- 16.2.16.1. Overview
- 16.2.16.2. Products
- 16.2.16.3. SWOT Analysis
- 16.2.16.4. Recent Developments
- 16.2.16.5. Financials (Based on Availability)
- 16.2.17 1 Stronghold
- 16.2.17.1. Overview
- 16.2.17.2. Products
- 16.2.17.3. SWOT Analysis
- 16.2.17.4. Recent Developments
- 16.2.17.5. Financials (Based on Availability)
- 16.2.1 Other Companies(startups associations etc )
List of Figures
- Figure 1: Global Scandinavian Commercial Property Industry Revenue Breakdown (Million, %) by Region 2024 & 2032
- Figure 2: North America Scandinavian Commercial Property Industry Revenue (Million), by Country 2024 & 2032
- Figure 3: North America Scandinavian Commercial Property Industry Revenue Share (%), by Country 2024 & 2032
- Figure 4: Asia Pacific Scandinavian Commercial Property Industry Revenue (Million), by Country 2024 & 2032
- Figure 5: Asia Pacific Scandinavian Commercial Property Industry Revenue Share (%), by Country 2024 & 2032
- Figure 6: Europe Scandinavian Commercial Property Industry Revenue (Million), by Country 2024 & 2032
- Figure 7: Europe Scandinavian Commercial Property Industry Revenue Share (%), by Country 2024 & 2032
- Figure 8: GCC Scandinavian Commercial Property Industry Revenue (Million), by Country 2024 & 2032
- Figure 9: GCC Scandinavian Commercial Property Industry Revenue Share (%), by Country 2024 & 2032
- Figure 10: Rest of the World Scandinavian Commercial Property Industry Revenue (Million), by Country 2024 & 2032
- Figure 11: Rest of the World Scandinavian Commercial Property Industry Revenue Share (%), by Country 2024 & 2032
- Figure 12: North America Scandinavian Commercial Property Industry Revenue (Million), by Type 2024 & 2032
- Figure 13: North America Scandinavian Commercial Property Industry Revenue Share (%), by Type 2024 & 2032
- Figure 14: North America Scandinavian Commercial Property Industry Revenue (Million), by Countries 2024 & 2032
- Figure 15: North America Scandinavian Commercial Property Industry Revenue Share (%), by Countries 2024 & 2032
- Figure 16: North America Scandinavian Commercial Property Industry Revenue (Million), by Key Cities 2024 & 2032
- Figure 17: North America Scandinavian Commercial Property Industry Revenue Share (%), by Key Cities 2024 & 2032
- Figure 18: North America Scandinavian Commercial Property Industry Revenue (Million), by Country 2024 & 2032
- Figure 19: North America Scandinavian Commercial Property Industry Revenue Share (%), by Country 2024 & 2032
- Figure 20: South America Scandinavian Commercial Property Industry Revenue (Million), by Type 2024 & 2032
- Figure 21: South America Scandinavian Commercial Property Industry Revenue Share (%), by Type 2024 & 2032
- Figure 22: South America Scandinavian Commercial Property Industry Revenue (Million), by Countries 2024 & 2032
- Figure 23: South America Scandinavian Commercial Property Industry Revenue Share (%), by Countries 2024 & 2032
- Figure 24: South America Scandinavian Commercial Property Industry Revenue (Million), by Key Cities 2024 & 2032
- Figure 25: South America Scandinavian Commercial Property Industry Revenue Share (%), by Key Cities 2024 & 2032
- Figure 26: South America Scandinavian Commercial Property Industry Revenue (Million), by Country 2024 & 2032
- Figure 27: South America Scandinavian Commercial Property Industry Revenue Share (%), by Country 2024 & 2032
- Figure 28: Europe Scandinavian Commercial Property Industry Revenue (Million), by Type 2024 & 2032
- Figure 29: Europe Scandinavian Commercial Property Industry Revenue Share (%), by Type 2024 & 2032
- Figure 30: Europe Scandinavian Commercial Property Industry Revenue (Million), by Countries 2024 & 2032
- Figure 31: Europe Scandinavian Commercial Property Industry Revenue Share (%), by Countries 2024 & 2032
- Figure 32: Europe Scandinavian Commercial Property Industry Revenue (Million), by Key Cities 2024 & 2032
- Figure 33: Europe Scandinavian Commercial Property Industry Revenue Share (%), by Key Cities 2024 & 2032
- Figure 34: Europe Scandinavian Commercial Property Industry Revenue (Million), by Country 2024 & 2032
- Figure 35: Europe Scandinavian Commercial Property Industry Revenue Share (%), by Country 2024 & 2032
- Figure 36: Middle East & Africa Scandinavian Commercial Property Industry Revenue (Million), by Type 2024 & 2032
- Figure 37: Middle East & Africa Scandinavian Commercial Property Industry Revenue Share (%), by Type 2024 & 2032
- Figure 38: Middle East & Africa Scandinavian Commercial Property Industry Revenue (Million), by Countries 2024 & 2032
- Figure 39: Middle East & Africa Scandinavian Commercial Property Industry Revenue Share (%), by Countries 2024 & 2032
- Figure 40: Middle East & Africa Scandinavian Commercial Property Industry Revenue (Million), by Key Cities 2024 & 2032
- Figure 41: Middle East & Africa Scandinavian Commercial Property Industry Revenue Share (%), by Key Cities 2024 & 2032
- Figure 42: Middle East & Africa Scandinavian Commercial Property Industry Revenue (Million), by Country 2024 & 2032
- Figure 43: Middle East & Africa Scandinavian Commercial Property Industry Revenue Share (%), by Country 2024 & 2032
- Figure 44: Asia Pacific Scandinavian Commercial Property Industry Revenue (Million), by Type 2024 & 2032
- Figure 45: Asia Pacific Scandinavian Commercial Property Industry Revenue Share (%), by Type 2024 & 2032
- Figure 46: Asia Pacific Scandinavian Commercial Property Industry Revenue (Million), by Countries 2024 & 2032
- Figure 47: Asia Pacific Scandinavian Commercial Property Industry Revenue Share (%), by Countries 2024 & 2032
- Figure 48: Asia Pacific Scandinavian Commercial Property Industry Revenue (Million), by Key Cities 2024 & 2032
- Figure 49: Asia Pacific Scandinavian Commercial Property Industry Revenue Share (%), by Key Cities 2024 & 2032
- Figure 50: Asia Pacific Scandinavian Commercial Property Industry Revenue (Million), by Country 2024 & 2032
- Figure 51: Asia Pacific Scandinavian Commercial Property Industry Revenue Share (%), by Country 2024 & 2032
List of Tables
- Table 1: Global Scandinavian Commercial Property Industry Revenue Million Forecast, by Region 2019 & 2032
- Table 2: Global Scandinavian Commercial Property Industry Revenue Million Forecast, by Type 2019 & 2032
- Table 3: Global Scandinavian Commercial Property Industry Revenue Million Forecast, by Countries 2019 & 2032
- Table 4: Global Scandinavian Commercial Property Industry Revenue Million Forecast, by Key Cities 2019 & 2032
- Table 5: Global Scandinavian Commercial Property Industry Revenue Million Forecast, by Region 2019 & 2032
- Table 6: Global Scandinavian Commercial Property Industry Revenue Million Forecast, by Country 2019 & 2032
- Table 7: Scandinavian Commercial Property Industry Revenue (Million) Forecast, by Application 2019 & 2032
- Table 8: Global Scandinavian Commercial Property Industry Revenue Million Forecast, by Country 2019 & 2032
- Table 9: Scandinavian Commercial Property Industry Revenue (Million) Forecast, by Application 2019 & 2032
- Table 10: Global Scandinavian Commercial Property Industry Revenue Million Forecast, by Country 2019 & 2032
- Table 11: Scandinavian Commercial Property Industry Revenue (Million) Forecast, by Application 2019 & 2032
- Table 12: Global Scandinavian Commercial Property Industry Revenue Million Forecast, by Country 2019 & 2032
- Table 13: Scandinavian Commercial Property Industry Revenue (Million) Forecast, by Application 2019 & 2032
- Table 14: Global Scandinavian Commercial Property Industry Revenue Million Forecast, by Country 2019 & 2032
- Table 15: Scandinavian Commercial Property Industry Revenue (Million) Forecast, by Application 2019 & 2032
- Table 16: Global Scandinavian Commercial Property Industry Revenue Million Forecast, by Type 2019 & 2032
- Table 17: Global Scandinavian Commercial Property Industry Revenue Million Forecast, by Countries 2019 & 2032
- Table 18: Global Scandinavian Commercial Property Industry Revenue Million Forecast, by Key Cities 2019 & 2032
- Table 19: Global Scandinavian Commercial Property Industry Revenue Million Forecast, by Country 2019 & 2032
- Table 20: United States Scandinavian Commercial Property Industry Revenue (Million) Forecast, by Application 2019 & 2032
- Table 21: Canada Scandinavian Commercial Property Industry Revenue (Million) Forecast, by Application 2019 & 2032
- Table 22: Mexico Scandinavian Commercial Property Industry Revenue (Million) Forecast, by Application 2019 & 2032
- Table 23: Global Scandinavian Commercial Property Industry Revenue Million Forecast, by Type 2019 & 2032
- Table 24: Global Scandinavian Commercial Property Industry Revenue Million Forecast, by Countries 2019 & 2032
- Table 25: Global Scandinavian Commercial Property Industry Revenue Million Forecast, by Key Cities 2019 & 2032
- Table 26: Global Scandinavian Commercial Property Industry Revenue Million Forecast, by Country 2019 & 2032
- Table 27: Brazil Scandinavian Commercial Property Industry Revenue (Million) Forecast, by Application 2019 & 2032
- Table 28: Argentina Scandinavian Commercial Property Industry Revenue (Million) Forecast, by Application 2019 & 2032
- Table 29: Rest of South America Scandinavian Commercial Property Industry Revenue (Million) Forecast, by Application 2019 & 2032
- Table 30: Global Scandinavian Commercial Property Industry Revenue Million Forecast, by Type 2019 & 2032
- Table 31: Global Scandinavian Commercial Property Industry Revenue Million Forecast, by Countries 2019 & 2032
- Table 32: Global Scandinavian Commercial Property Industry Revenue Million Forecast, by Key Cities 2019 & 2032
- Table 33: Global Scandinavian Commercial Property Industry Revenue Million Forecast, by Country 2019 & 2032
- Table 34: United Kingdom Scandinavian Commercial Property Industry Revenue (Million) Forecast, by Application 2019 & 2032
- Table 35: Germany Scandinavian Commercial Property Industry Revenue (Million) Forecast, by Application 2019 & 2032
- Table 36: France Scandinavian Commercial Property Industry Revenue (Million) Forecast, by Application 2019 & 2032
- Table 37: Italy Scandinavian Commercial Property Industry Revenue (Million) Forecast, by Application 2019 & 2032
- Table 38: Spain Scandinavian Commercial Property Industry Revenue (Million) Forecast, by Application 2019 & 2032
- Table 39: Russia Scandinavian Commercial Property Industry Revenue (Million) Forecast, by Application 2019 & 2032
- Table 40: Benelux Scandinavian Commercial Property Industry Revenue (Million) Forecast, by Application 2019 & 2032
- Table 41: Nordics Scandinavian Commercial Property Industry Revenue (Million) Forecast, by Application 2019 & 2032
- Table 42: Rest of Europe Scandinavian Commercial Property Industry Revenue (Million) Forecast, by Application 2019 & 2032
- Table 43: Global Scandinavian Commercial Property Industry Revenue Million Forecast, by Type 2019 & 2032
- Table 44: Global Scandinavian Commercial Property Industry Revenue Million Forecast, by Countries 2019 & 2032
- Table 45: Global Scandinavian Commercial Property Industry Revenue Million Forecast, by Key Cities 2019 & 2032
- Table 46: Global Scandinavian Commercial Property Industry Revenue Million Forecast, by Country 2019 & 2032
- Table 47: Turkey Scandinavian Commercial Property Industry Revenue (Million) Forecast, by Application 2019 & 2032
- Table 48: Israel Scandinavian Commercial Property Industry Revenue (Million) Forecast, by Application 2019 & 2032
- Table 49: GCC Scandinavian Commercial Property Industry Revenue (Million) Forecast, by Application 2019 & 2032
- Table 50: North Africa Scandinavian Commercial Property Industry Revenue (Million) Forecast, by Application 2019 & 2032
- Table 51: South Africa Scandinavian Commercial Property Industry Revenue (Million) Forecast, by Application 2019 & 2032
- Table 52: Rest of Middle East & Africa Scandinavian Commercial Property Industry Revenue (Million) Forecast, by Application 2019 & 2032
- Table 53: Global Scandinavian Commercial Property Industry Revenue Million Forecast, by Type 2019 & 2032
- Table 54: Global Scandinavian Commercial Property Industry Revenue Million Forecast, by Countries 2019 & 2032
- Table 55: Global Scandinavian Commercial Property Industry Revenue Million Forecast, by Key Cities 2019 & 2032
- Table 56: Global Scandinavian Commercial Property Industry Revenue Million Forecast, by Country 2019 & 2032
- Table 57: China Scandinavian Commercial Property Industry Revenue (Million) Forecast, by Application 2019 & 2032
- Table 58: India Scandinavian Commercial Property Industry Revenue (Million) Forecast, by Application 2019 & 2032
- Table 59: Japan Scandinavian Commercial Property Industry Revenue (Million) Forecast, by Application 2019 & 2032
- Table 60: South Korea Scandinavian Commercial Property Industry Revenue (Million) Forecast, by Application 2019 & 2032
- Table 61: ASEAN Scandinavian Commercial Property Industry Revenue (Million) Forecast, by Application 2019 & 2032
- Table 62: Oceania Scandinavian Commercial Property Industry Revenue (Million) Forecast, by Application 2019 & 2032
- Table 63: Rest of Asia Pacific Scandinavian Commercial Property Industry Revenue (Million) Forecast, by Application 2019 & 2032
Frequently Asked Questions
1. What is the projected Compound Annual Growth Rate (CAGR) of the Scandinavian Commercial Property Industry?
The projected CAGR is approximately 7.41%.
2. Which companies are prominent players in the Scandinavian Commercial Property Industry?
Key companies in the market include Other Companies(startups associations etc ), Developers, 5 Property Flow*List Not Exhaustive, 3 Citycon, 1 CBRE, 5 BPT Group, 2 Jeudan A/S, 1 Vasakronan AB, 4 Cushman and wakefield, Real Estate Agencies, 3 Colliers international, 2 Europages, 4 NREP (Logicenters), 2 Nordkap, 3 Spotscale, 4 WEC360, 1 Stronghold.
3. What are the main segments of the Scandinavian Commercial Property Industry?
The market segments include Type, Countries, Key Cities.
4. Can you provide details about the market size?
The market size is estimated to be USD XX Million as of 2022.
5. What are some drivers contributing to market growth?
Overall economic growth driving the market; The growth of business and industries driving the market.
6. What are the notable trends driving market growth?
Increase in Transaction Volume in the Office Market of Scandinavian Countries.
7. Are there any restraints impacting market growth?
Fluctuating economic conditions hindering the growth of the market; Difficulty in landownership and leasing rights affecting the market.
8. Can you provide examples of recent developments in the market?
N/A
9. What pricing options are available for accessing the report?
Pricing options include single-user, multi-user, and enterprise licenses priced at USD 3800, USD 4500, and USD 5800 respectively.
10. Is the market size provided in terms of value or volume?
The market size is provided in terms of value, measured in Million.
11. Are there any specific market keywords associated with the report?
Yes, the market keyword associated with the report is "Scandinavian Commercial Property Industry," which aids in identifying and referencing the specific market segment covered.
12. How do I determine which pricing option suits my needs best?
The pricing options vary based on user requirements and access needs. Individual users may opt for single-user licenses, while businesses requiring broader access may choose multi-user or enterprise licenses for cost-effective access to the report.
13. Are there any additional resources or data provided in the Scandinavian Commercial Property Industry report?
While the report offers comprehensive insights, it's advisable to review the specific contents or supplementary materials provided to ascertain if additional resources or data are available.
14. How can I stay updated on further developments or reports in the Scandinavian Commercial Property Industry?
To stay informed about further developments, trends, and reports in the Scandinavian Commercial Property Industry, consider subscribing to industry newsletters, following relevant companies and organizations, or regularly checking reputable industry news sources and publications.
Methodology
Step 1 - Identification of Relevant Samples Size from Population Database


Step 2 - Approaches for Defining Global Market Size (Value, Volume* & Price*)

Note*: In applicable scenarios
Step 3 - Data Sources
Primary Research
- Web Analytics
- Survey Reports
- Research Institute
- Latest Research Reports
- Opinion Leaders
Secondary Research
- Annual Reports
- White Paper
- Latest Press Release
- Industry Association
- Paid Database
- Investor Presentations

Step 4 - Data Triangulation
Involves using different sources of information in order to increase the validity of a study
These sources are likely to be stakeholders in a program - participants, other researchers, program staff, other community members, and so on.
Then we put all data in single framework & apply various statistical tools to find out the dynamic on the market.
During the analysis stage, feedback from the stakeholder groups would be compared to determine areas of agreement as well as areas of divergence


