

Key Insights
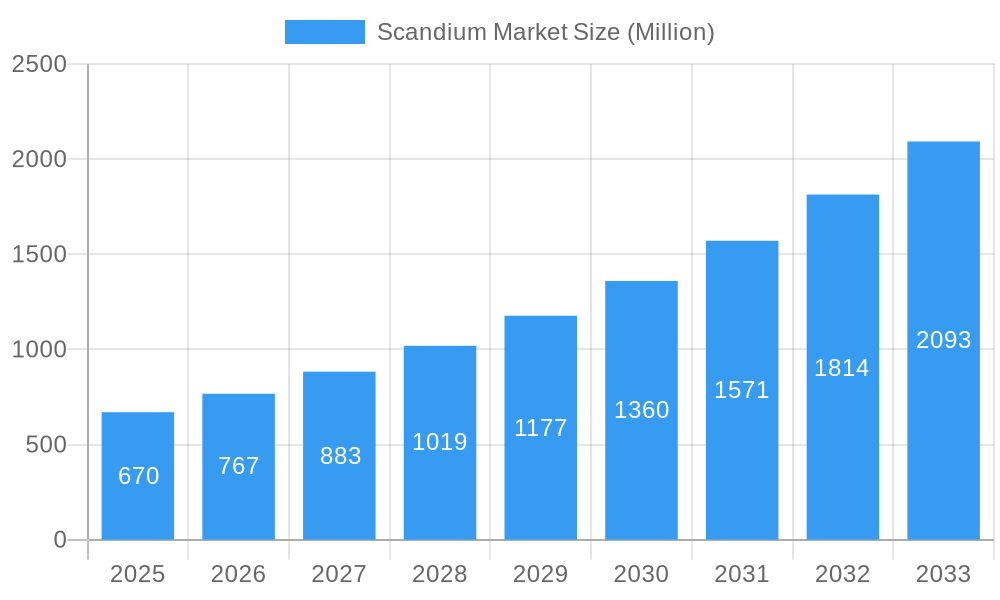
The scandium market, valued at $0.67 billion in 2025, is poised for robust growth, exhibiting a compound annual growth rate (CAGR) of 14.70% from 2025 to 2033. This expansion is driven primarily by the increasing demand for scandium in high-value applications, particularly within the aerospace and defense industries. Lightweight yet high-strength scandium alloys are crucial for advanced aircraft and spacecraft components, contributing significantly to fuel efficiency and performance enhancement. Furthermore, the growing adoption of scandium in fuel cells and high-intensity lighting further fuels market growth. Technological advancements in scandium extraction and processing are also expected to improve efficiency and reduce costs, making it more accessible for broader applications. Competitive landscape analysis reveals a mix of established players like Rio Tinto and Sumitomo Metal Mining alongside emerging companies like Guangxi Maoxin Technology and Sunrise Energy Metals, indicating a dynamic market with potential for both established and new entrants. Challenges remain, however, including the relative scarcity of scandium and the need for sustainable and environmentally friendly extraction methods. Future growth will depend heavily on further technological innovations and strategic partnerships to address these challenges and expand scandium's applications into new sectors.
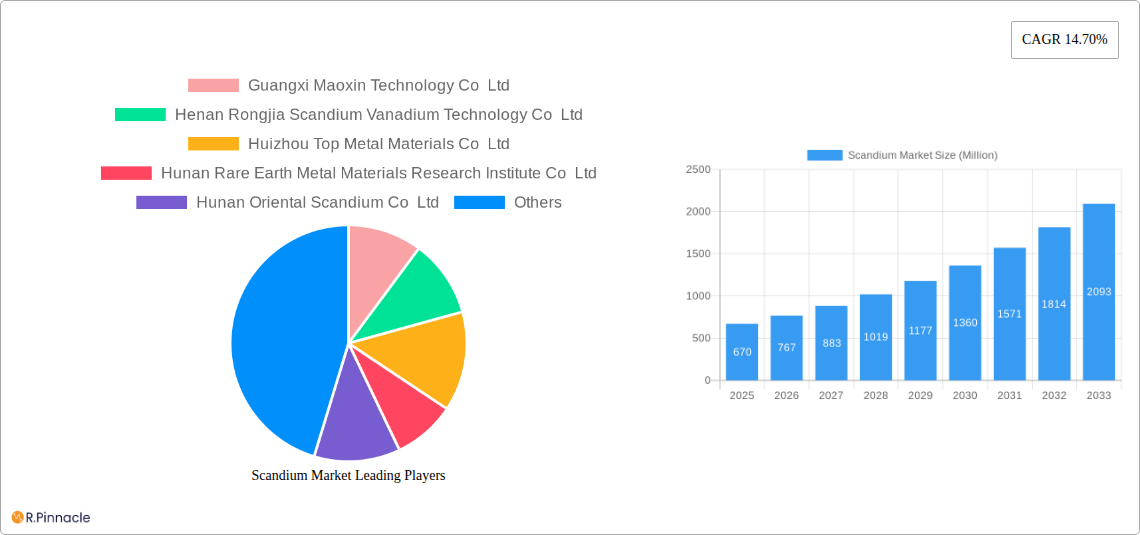
Scandium Market Market Size (In Million)
The projected market size in 2033 can be estimated by applying the CAGR. Considering a 14.70% annual growth, the market would approximately reach $2.7 billion in 2033. This projection, however, is based on a continued high demand and the assumption that technological advancements and market expansions are able to overcome challenges related to raw material availability and processing limitations. Regional market dynamics will significantly influence the overall growth trajectory, with North America and Asia predicted as key growth drivers. Factors such as government regulations and incentives for clean energy technologies, alongside investments in research and development, will further shape the market landscape in the coming years. The key to sustained growth lies in addressing the challenges of supply chain development, streamlining the extraction process, and expanding the range of commercially viable applications of scandium.
Scandium Market Company Market Share
Unlock Growth Potential: A Comprehensive Scandium Market Report (2019-2033)
This in-depth report provides a comprehensive analysis of the global scandium market, offering invaluable insights for industry professionals, investors, and strategic planners. Covering the period from 2019 to 2033, with a focus on 2025, this report meticulously examines market structure, dynamics, dominant regions, and leading players, equipping you with the knowledge to navigate the evolving landscape of this critical rare earth metal.
Scandium Market Market Structure & Innovation Trends
This section analyzes the competitive landscape of the scandium market, examining market concentration, innovation drivers, regulatory frameworks, and M&A activity. We delve into the market share held by key players, including but not limited to Guangxi Maoxin Technology Co Ltd, Henan Rongjia Scandium Vanadium Technology Co Ltd, Huizhou Top Metal Materials Co Ltd, Hunan Rare Earth Metal Materials Research Institute Co Ltd, Hunan Oriental Scandium Co Ltd, JSC Dalur, MCC Group, NioCorp Development Ltd, Rio Tinto, Rusal, Scandium International Mining Corporation, Stanford Advanced Materials, Sumitomo Metal Mining Co Ltd (Taganito HPAL nickel Corp), Sunrise Energy Metals Limited, and Treibacher Industrie AG. The report quantifies market concentration using metrics like the Herfindahl-Hirschman Index (HHI) and assesses the impact of recent mergers and acquisitions (M&A) deals, including deal values (in Millions USD) where available. Innovation drivers, such as advancements in material science and increasing demand from specific end-user segments, are carefully analyzed, along with regulatory frameworks affecting market growth and the impact of product substitutes. End-user demographics are profiled to understand market segmentation and future demand forecasts.
Scandium Market Market Dynamics & Trends
This section examines the key factors shaping the scandium market's trajectory, including market growth drivers, technological disruptions, evolving consumer preferences, and competitive dynamics. We project a Compound Annual Growth Rate (CAGR) of xx% for the forecast period (2025-2033), supported by detailed analysis of market penetration rates in key segments. We explore the impact of emerging technologies on market dynamics and discuss how consumer preferences, especially in the automotive and aerospace sectors, influence market demand. The competitive landscape is analyzed, highlighting strategies employed by key players to gain market share.
Dominant Regions & Segments in Scandium Market
This section pinpoints the leading regions and segments within the scandium market, providing a granular analysis of their dominance. The analysis focuses on key factors driving growth within these regions and segments.
- Key Drivers (Examples):
- Favorable economic policies promoting technological advancements.
- Robust infrastructure supporting resource extraction and processing.
- High concentration of key end-user industries.
- Government initiatives promoting the use of scandium in advanced technologies.
The report delves into the specific reasons behind the dominance of these regions and segments, providing a detailed explanation backed by data and analysis.
Scandium Market Product Innovations
This section summarizes the latest product developments, applications, and competitive advantages in the scandium market. We highlight technological trends driving innovation and assess the market fit of new products and applications.
Report Scope & Segmentation Analysis
This report provides a detailed segmentation analysis of the scandium market, including projections on market size and growth for each segment. The competitive dynamics within each segment are also assessed. This analysis encompasses various parameters for segmentation. [Specific segmentation details will be provided in the full report - e.g., by application (aluminum alloys, lighting, etc.), by region, by product type, etc. Growth projections and market sizes (in Millions USD) will be provided for each segment].
Key Drivers of Scandium Market Growth
This section outlines the key factors driving growth in the scandium market. These factors encompass technological advancements leading to increased applications of scandium in various industries, the expanding global economy boosting demand for advanced materials, and supportive government regulations and policies promoting the use of sustainable materials. Specific examples of these drivers will be provided within the full report.
Challenges in the Scandium Market Sector
This section identifies and analyzes the key challenges facing the scandium market. These include regulatory hurdles related to mining and processing of rare earth elements, disruptions in supply chains impacting the availability of scandium, and intense competition among existing and emerging players in the market. The report quantifies the impact of these challenges wherever possible (e.g., percentage impact on market growth).
Emerging Opportunities in Scandium Market
This section explores emerging trends and opportunities within the scandium market. The focus is on new applications in high-growth sectors (e.g., renewable energy, aerospace), the development of innovative technologies that enhance the efficiency and cost-effectiveness of scandium production, and changes in consumer preferences driving increased demand for scandium-based products.
Leading Players in the Scandium Market Market
- Guangxi Maoxin Technology Co Ltd
- Henan Rongjia Scandium Vanadium Technology Co Ltd
- Huizhou Top Metal Materials Co Ltd
- Hunan Rare Earth Metal Materials Research Institute Co Ltd
- Hunan Oriental Scandium Co Ltd
- JSC Dalur
- MCC Group
- NioCorp Development Ltd
- Rio Tinto
- Rusal
- Scandium International Mining Corporation
- Stanford Advanced Materials
- Sumitomo Metal Mining Co Ltd (Taganito HPAL nickel Corp)
- Sunrise Energy Metals Limited
- Treibacher Industrie AG (List Not Exhaustive)
Key Developments in Scandium Market Industry
- April 2023: Rio Tinto acquired the Platina Scandium Project for USD 14 Million, potentially adding up to 40 tons per annum of scandium oxide production.
- January 2024: NioCorp Developments Ltd partnered with Brunel University London to develop innovative aluminum-scandium alloys for the automotive sector.
Future Outlook for Scandium Market Market
The future of the scandium market is bright, driven by technological advancements and growing demand across diverse sectors. Strategic investments in research and development, expansion of production capacity, and exploration of new applications will shape the market’s future trajectory. The report provides detailed insights into the growth accelerators and strategic opportunities for success in this dynamic market.
Scandium Market Segmentation
-
1. Product Type
- 1.1. Oxide
- 1.2. Fluoride
- 1.3. Chloride
- 1.4. Nitrate
- 1.5. Iodide
- 1.6. Alloy
- 1.7. Carbonate and Other Product Types
-
2. End-user Industry
- 2.1. Aerospace and Defense
- 2.2. Solid Oxide Fuel Cells
- 2.3. Ceramics
- 2.4. Lighting
- 2.5. Electronics
- 2.6. 3D Printing
- 2.7. Sporting Goods
- 2.8. Other End-user Industries
Scandium Market Segmentation By Geography
-
1. North America
- 1.1. United States
- 1.2. Canada
- 1.3. Mexico
-
2. South America
- 2.1. Brazil
- 2.2. Argentina
- 2.3. Rest of South America
-
3. Europe
- 3.1. United Kingdom
- 3.2. Germany
- 3.3. France
- 3.4. Italy
- 3.5. Spain
- 3.6. Russia
- 3.7. Benelux
- 3.8. Nordics
- 3.9. Rest of Europe
-
4. Middle East & Africa
- 4.1. Turkey
- 4.2. Israel
- 4.3. GCC
- 4.4. North Africa
- 4.5. South Africa
- 4.6. Rest of Middle East & Africa
-
5. Asia Pacific
- 5.1. China
- 5.2. India
- 5.3. Japan
- 5.4. South Korea
- 5.5. ASEAN
- 5.6. Oceania
- 5.7. Rest of Asia Pacific
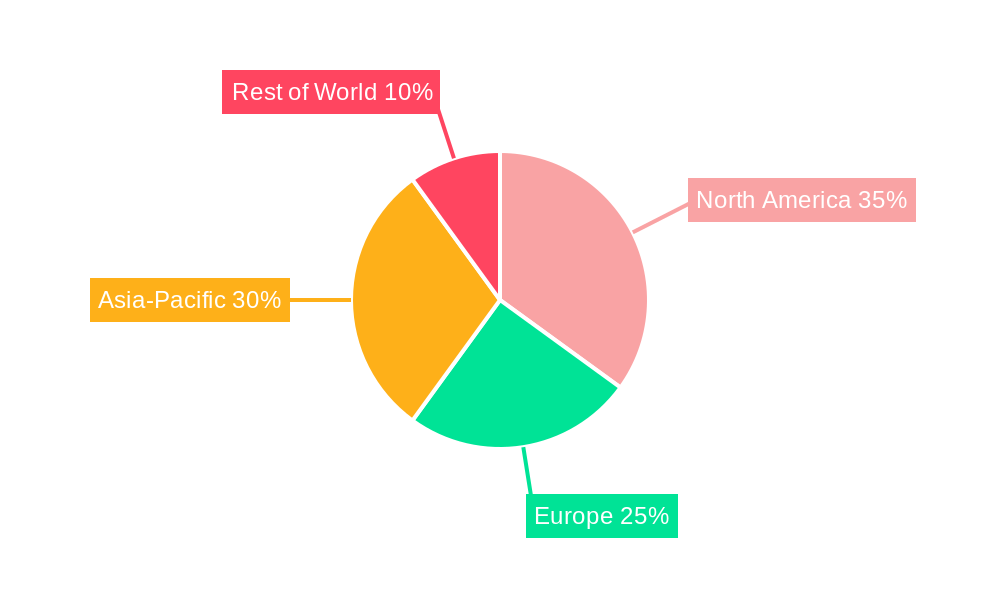
Scandium Market Regional Market Share
Geographic Coverage of Scandium Market
Scandium Market REPORT HIGHLIGHTS
| Aspects | Details |
|---|---|
| Study Period | 2020-2034 |
| Base Year | 2025 |
| Estimated Year | 2026 |
| Forecast Period | 2026-2034 |
| Historical Period | 2020-2025 |
| Growth Rate | CAGR of 14.70% from 2020-2034 |
| Segmentation |
|
Table of Contents
- 1. Introduction
- 1.1. Research Scope
- 1.2. Market Segmentation
- 1.3. Research Objective
- 1.4. Definitions and Assumptions
- 2. Executive Summary
- 2.1. Market Snapshot
- 3. Market Dynamics
- 3.1. Market Drivers
- 3.2. Market Restrains
- 3.3. Market Trends
- 3.4. Market Opportunities
- 4. Market Factor Analysis
- 4.1. Porters Five Forces
- 4.1.1. Bargaining Power of Suppliers
- 4.1.2. Bargaining Power of Buyers
- 4.1.3. Threat of New Entrants
- 4.1.4. Threat of Substitutes
- 4.1.5. Competitive Rivalry
- 4.2. PESTEL analysis
- 4.3. BCG Analysis
- 4.3.1. Stars (High Growth, High Market Share)
- 4.3.2. Cash Cows (Low Growth, High Market Share)
- 4.3.3. Question Mark (High Growth, Low Market Share)
- 4.3.4. Dogs (Low Growth, Low Market Share)
- 4.4. Ansoff Matrix Analysis
- 4.5. Supply Chain Analysis
- 4.6. Regulatory Landscape
- 4.7. Current Market Potential and Opportunity Assessment (TAM–SAM–SOM Framework)
- 4.8. PRI Analyst Note
- 4.1. Porters Five Forces
- 5. Market Analysis, Insights and Forecast 2021-2033
- 5.1. Market Analysis, Insights and Forecast - by Product Type
- 5.1.1. Oxide
- 5.1.2. Fluoride
- 5.1.3. Chloride
- 5.1.4. Nitrate
- 5.1.5. Iodide
- 5.1.6. Alloy
- 5.1.7. Carbonate and Other Product Types
- 5.2. Market Analysis, Insights and Forecast - by End-user Industry
- 5.2.1. Aerospace and Defense
- 5.2.2. Solid Oxide Fuel Cells
- 5.2.3. Ceramics
- 5.2.4. Lighting
- 5.2.5. Electronics
- 5.2.6. 3D Printing
- 5.2.7. Sporting Goods
- 5.2.8. Other End-user Industries
- 5.3. Market Analysis, Insights and Forecast - by Region
- 5.3.1. North America
- 5.3.2. South America
- 5.3.3. Europe
- 5.3.4. Middle East & Africa
- 5.3.5. Asia Pacific
- 5.1. Market Analysis, Insights and Forecast - by Product Type
- 6. Global Scandium Market Analysis, Insights and Forecast, 2021-2033
- 6.1. Market Analysis, Insights and Forecast - by Product Type
- 6.1.1. Oxide
- 6.1.2. Fluoride
- 6.1.3. Chloride
- 6.1.4. Nitrate
- 6.1.5. Iodide
- 6.1.6. Alloy
- 6.1.7. Carbonate and Other Product Types
- 6.2. Market Analysis, Insights and Forecast - by End-user Industry
- 6.2.1. Aerospace and Defense
- 6.2.2. Solid Oxide Fuel Cells
- 6.2.3. Ceramics
- 6.2.4. Lighting
- 6.2.5. Electronics
- 6.2.6. 3D Printing
- 6.2.7. Sporting Goods
- 6.2.8. Other End-user Industries
- 6.1. Market Analysis, Insights and Forecast - by Product Type
- 7. North America Scandium Market Analysis, Insights and Forecast, 2020-2032
- 7.1. Market Analysis, Insights and Forecast - by Product Type
- 7.1.1. Oxide
- 7.1.2. Fluoride
- 7.1.3. Chloride
- 7.1.4. Nitrate
- 7.1.5. Iodide
- 7.1.6. Alloy
- 7.1.7. Carbonate and Other Product Types
- 7.2. Market Analysis, Insights and Forecast - by End-user Industry
- 7.2.1. Aerospace and Defense
- 7.2.2. Solid Oxide Fuel Cells
- 7.2.3. Ceramics
- 7.2.4. Lighting
- 7.2.5. Electronics
- 7.2.6. 3D Printing
- 7.2.7. Sporting Goods
- 7.2.8. Other End-user Industries
- 7.1. Market Analysis, Insights and Forecast - by Product Type
- 8. South America Scandium Market Analysis, Insights and Forecast, 2020-2032
- 8.1. Market Analysis, Insights and Forecast - by Product Type
- 8.1.1. Oxide
- 8.1.2. Fluoride
- 8.1.3. Chloride
- 8.1.4. Nitrate
- 8.1.5. Iodide
- 8.1.6. Alloy
- 8.1.7. Carbonate and Other Product Types
- 8.2. Market Analysis, Insights and Forecast - by End-user Industry
- 8.2.1. Aerospace and Defense
- 8.2.2. Solid Oxide Fuel Cells
- 8.2.3. Ceramics
- 8.2.4. Lighting
- 8.2.5. Electronics
- 8.2.6. 3D Printing
- 8.2.7. Sporting Goods
- 8.2.8. Other End-user Industries
- 8.1. Market Analysis, Insights and Forecast - by Product Type
- 9. Europe Scandium Market Analysis, Insights and Forecast, 2020-2032
- 9.1. Market Analysis, Insights and Forecast - by Product Type
- 9.1.1. Oxide
- 9.1.2. Fluoride
- 9.1.3. Chloride
- 9.1.4. Nitrate
- 9.1.5. Iodide
- 9.1.6. Alloy
- 9.1.7. Carbonate and Other Product Types
- 9.2. Market Analysis, Insights and Forecast - by End-user Industry
- 9.2.1. Aerospace and Defense
- 9.2.2. Solid Oxide Fuel Cells
- 9.2.3. Ceramics
- 9.2.4. Lighting
- 9.2.5. Electronics
- 9.2.6. 3D Printing
- 9.2.7. Sporting Goods
- 9.2.8. Other End-user Industries
- 9.1. Market Analysis, Insights and Forecast - by Product Type
- 10. Middle East & Africa Scandium Market Analysis, Insights and Forecast, 2020-2032
- 10.1. Market Analysis, Insights and Forecast - by Product Type
- 10.1.1. Oxide
- 10.1.2. Fluoride
- 10.1.3. Chloride
- 10.1.4. Nitrate
- 10.1.5. Iodide
- 10.1.6. Alloy
- 10.1.7. Carbonate and Other Product Types
- 10.2. Market Analysis, Insights and Forecast - by End-user Industry
- 10.2.1. Aerospace and Defense
- 10.2.2. Solid Oxide Fuel Cells
- 10.2.3. Ceramics
- 10.2.4. Lighting
- 10.2.5. Electronics
- 10.2.6. 3D Printing
- 10.2.7. Sporting Goods
- 10.2.8. Other End-user Industries
- 10.1. Market Analysis, Insights and Forecast - by Product Type
- 11. Asia Pacific Scandium Market Analysis, Insights and Forecast, 2020-2032
- 11.1. Market Analysis, Insights and Forecast - by Product Type
- 11.1.1. Oxide
- 11.1.2. Fluoride
- 11.1.3. Chloride
- 11.1.4. Nitrate
- 11.1.5. Iodide
- 11.1.6. Alloy
- 11.1.7. Carbonate and Other Product Types
- 11.2. Market Analysis, Insights and Forecast - by End-user Industry
- 11.2.1. Aerospace and Defense
- 11.2.2. Solid Oxide Fuel Cells
- 11.2.3. Ceramics
- 11.2.4. Lighting
- 11.2.5. Electronics
- 11.2.6. 3D Printing
- 11.2.7. Sporting Goods
- 11.2.8. Other End-user Industries
- 11.1. Market Analysis, Insights and Forecast - by Product Type
- 12. Competitive Analysis
- 12.1. Company Profiles
- 12.1.1 Guangxi Maoxin Technology Co Ltd
- 12.1.1.1. Company Overview
- 12.1.1.2. Products
- 12.1.1.3. Company Financials
- 12.1.1.4. SWOT Analysis
- 12.1.2 Henan Rongjia Scandium Vanadium Technology Co Ltd
- 12.1.2.1. Company Overview
- 12.1.2.2. Products
- 12.1.2.3. Company Financials
- 12.1.2.4. SWOT Analysis
- 12.1.3 Huizhou Top Metal Materials Co Ltd
- 12.1.3.1. Company Overview
- 12.1.3.2. Products
- 12.1.3.3. Company Financials
- 12.1.3.4. SWOT Analysis
- 12.1.4 Hunan Rare Earth Metal Materials Research Institute Co Ltd
- 12.1.4.1. Company Overview
- 12.1.4.2. Products
- 12.1.4.3. Company Financials
- 12.1.4.4. SWOT Analysis
- 12.1.5 Hunan Oriental Scandium Co Ltd
- 12.1.5.1. Company Overview
- 12.1.5.2. Products
- 12.1.5.3. Company Financials
- 12.1.5.4. SWOT Analysis
- 12.1.6 JSC Dalur
- 12.1.6.1. Company Overview
- 12.1.6.2. Products
- 12.1.6.3. Company Financials
- 12.1.6.4. SWOT Analysis
- 12.1.7 MCC Group
- 12.1.7.1. Company Overview
- 12.1.7.2. Products
- 12.1.7.3. Company Financials
- 12.1.7.4. SWOT Analysis
- 12.1.8 NioCorp Development Ltd
- 12.1.8.1. Company Overview
- 12.1.8.2. Products
- 12.1.8.3. Company Financials
- 12.1.8.4. SWOT Analysis
- 12.1.9 Rio Tinto
- 12.1.9.1. Company Overview
- 12.1.9.2. Products
- 12.1.9.3. Company Financials
- 12.1.9.4. SWOT Analysis
- 12.1.10 Rusal
- 12.1.10.1. Company Overview
- 12.1.10.2. Products
- 12.1.10.3. Company Financials
- 12.1.10.4. SWOT Analysis
- 12.1.11 Scandium International Mining Corporation
- 12.1.11.1. Company Overview
- 12.1.11.2. Products
- 12.1.11.3. Company Financials
- 12.1.11.4. SWOT Analysis
- 12.1.12 Stanford Advanced Materials
- 12.1.12.1. Company Overview
- 12.1.12.2. Products
- 12.1.12.3. Company Financials
- 12.1.12.4. SWOT Analysis
- 12.1.13 Sumitomo Metal Mining Co Ltd (Taganito HPAL nickel Corp )
- 12.1.13.1. Company Overview
- 12.1.13.2. Products
- 12.1.13.3. Company Financials
- 12.1.13.4. SWOT Analysis
- 12.1.14 Sunrise Energy Metals Limited
- 12.1.14.1. Company Overview
- 12.1.14.2. Products
- 12.1.14.3. Company Financials
- 12.1.14.4. SWOT Analysis
- 12.1.15 Treibacher Industrie AG *List Not Exhaustive
- 12.1.15.1. Company Overview
- 12.1.15.2. Products
- 12.1.15.3. Company Financials
- 12.1.15.4. SWOT Analysis
- 12.1.1 Guangxi Maoxin Technology Co Ltd
- 12.2. Market Entropy
- 12.2.1 Company's Key Areas Served
- 12.2.2 Recent Developments
- 12.3. Company Market Share Analysis 2025
- 12.3.1 Top 5 Companies Market Share Analysis
- 12.3.2 Top 3 Companies Market Share Analysis
- 12.4. List of Potential Customers
- 13. Research Methodology
List of Figures
- Figure 1: Global Scandium Market Revenue Breakdown (Million, %) by Region 2025 & 2033
- Figure 2: Global Scandium Market Volume Breakdown (Billion, %) by Region 2025 & 2033
- Figure 3: North America Scandium Market Revenue (Million), by Product Type 2025 & 2033
- Figure 4: North America Scandium Market Volume (Billion), by Product Type 2025 & 2033
- Figure 5: North America Scandium Market Revenue Share (%), by Product Type 2025 & 2033
- Figure 6: North America Scandium Market Volume Share (%), by Product Type 2025 & 2033
- Figure 7: North America Scandium Market Revenue (Million), by End-user Industry 2025 & 2033
- Figure 8: North America Scandium Market Volume (Billion), by End-user Industry 2025 & 2033
- Figure 9: North America Scandium Market Revenue Share (%), by End-user Industry 2025 & 2033
- Figure 10: North America Scandium Market Volume Share (%), by End-user Industry 2025 & 2033
- Figure 11: North America Scandium Market Revenue (Million), by Country 2025 & 2033
- Figure 12: North America Scandium Market Volume (Billion), by Country 2025 & 2033
- Figure 13: North America Scandium Market Revenue Share (%), by Country 2025 & 2033
- Figure 14: North America Scandium Market Volume Share (%), by Country 2025 & 2033
- Figure 15: South America Scandium Market Revenue (Million), by Product Type 2025 & 2033
- Figure 16: South America Scandium Market Volume (Billion), by Product Type 2025 & 2033
- Figure 17: South America Scandium Market Revenue Share (%), by Product Type 2025 & 2033
- Figure 18: South America Scandium Market Volume Share (%), by Product Type 2025 & 2033
- Figure 19: South America Scandium Market Revenue (Million), by End-user Industry 2025 & 2033
- Figure 20: South America Scandium Market Volume (Billion), by End-user Industry 2025 & 2033
- Figure 21: South America Scandium Market Revenue Share (%), by End-user Industry 2025 & 2033
- Figure 22: South America Scandium Market Volume Share (%), by End-user Industry 2025 & 2033
- Figure 23: South America Scandium Market Revenue (Million), by Country 2025 & 2033
- Figure 24: South America Scandium Market Volume (Billion), by Country 2025 & 2033
- Figure 25: South America Scandium Market Revenue Share (%), by Country 2025 & 2033
- Figure 26: South America Scandium Market Volume Share (%), by Country 2025 & 2033
- Figure 27: Europe Scandium Market Revenue (Million), by Product Type 2025 & 2033
- Figure 28: Europe Scandium Market Volume (Billion), by Product Type 2025 & 2033
- Figure 29: Europe Scandium Market Revenue Share (%), by Product Type 2025 & 2033
- Figure 30: Europe Scandium Market Volume Share (%), by Product Type 2025 & 2033
- Figure 31: Europe Scandium Market Revenue (Million), by End-user Industry 2025 & 2033
- Figure 32: Europe Scandium Market Volume (Billion), by End-user Industry 2025 & 2033
- Figure 33: Europe Scandium Market Revenue Share (%), by End-user Industry 2025 & 2033
- Figure 34: Europe Scandium Market Volume Share (%), by End-user Industry 2025 & 2033
- Figure 35: Europe Scandium Market Revenue (Million), by Country 2025 & 2033
- Figure 36: Europe Scandium Market Volume (Billion), by Country 2025 & 2033
- Figure 37: Europe Scandium Market Revenue Share (%), by Country 2025 & 2033
- Figure 38: Europe Scandium Market Volume Share (%), by Country 2025 & 2033
- Figure 39: Middle East & Africa Scandium Market Revenue (Million), by Product Type 2025 & 2033
- Figure 40: Middle East & Africa Scandium Market Volume (Billion), by Product Type 2025 & 2033
- Figure 41: Middle East & Africa Scandium Market Revenue Share (%), by Product Type 2025 & 2033
- Figure 42: Middle East & Africa Scandium Market Volume Share (%), by Product Type 2025 & 2033
- Figure 43: Middle East & Africa Scandium Market Revenue (Million), by End-user Industry 2025 & 2033
- Figure 44: Middle East & Africa Scandium Market Volume (Billion), by End-user Industry 2025 & 2033
- Figure 45: Middle East & Africa Scandium Market Revenue Share (%), by End-user Industry 2025 & 2033
- Figure 46: Middle East & Africa Scandium Market Volume Share (%), by End-user Industry 2025 & 2033
- Figure 47: Middle East & Africa Scandium Market Revenue (Million), by Country 2025 & 2033
- Figure 48: Middle East & Africa Scandium Market Volume (Billion), by Country 2025 & 2033
- Figure 49: Middle East & Africa Scandium Market Revenue Share (%), by Country 2025 & 2033
- Figure 50: Middle East & Africa Scandium Market Volume Share (%), by Country 2025 & 2033
- Figure 51: Asia Pacific Scandium Market Revenue (Million), by Product Type 2025 & 2033
- Figure 52: Asia Pacific Scandium Market Volume (Billion), by Product Type 2025 & 2033
- Figure 53: Asia Pacific Scandium Market Revenue Share (%), by Product Type 2025 & 2033
- Figure 54: Asia Pacific Scandium Market Volume Share (%), by Product Type 2025 & 2033
- Figure 55: Asia Pacific Scandium Market Revenue (Million), by End-user Industry 2025 & 2033
- Figure 56: Asia Pacific Scandium Market Volume (Billion), by End-user Industry 2025 & 2033
- Figure 57: Asia Pacific Scandium Market Revenue Share (%), by End-user Industry 2025 & 2033
- Figure 58: Asia Pacific Scandium Market Volume Share (%), by End-user Industry 2025 & 2033
- Figure 59: Asia Pacific Scandium Market Revenue (Million), by Country 2025 & 2033
- Figure 60: Asia Pacific Scandium Market Volume (Billion), by Country 2025 & 2033
- Figure 61: Asia Pacific Scandium Market Revenue Share (%), by Country 2025 & 2033
- Figure 62: Asia Pacific Scandium Market Volume Share (%), by Country 2025 & 2033
List of Tables
- Table 1: Global Scandium Market Revenue Million Forecast, by Product Type 2020 & 2033
- Table 2: Global Scandium Market Volume Billion Forecast, by Product Type 2020 & 2033
- Table 3: Global Scandium Market Revenue Million Forecast, by End-user Industry 2020 & 2033
- Table 4: Global Scandium Market Volume Billion Forecast, by End-user Industry 2020 & 2033
- Table 5: Global Scandium Market Revenue Million Forecast, by Region 2020 & 2033
- Table 6: Global Scandium Market Volume Billion Forecast, by Region 2020 & 2033
- Table 7: Global Scandium Market Revenue Million Forecast, by Product Type 2020 & 2033
- Table 8: Global Scandium Market Volume Billion Forecast, by Product Type 2020 & 2033
- Table 9: Global Scandium Market Revenue Million Forecast, by End-user Industry 2020 & 2033
- Table 10: Global Scandium Market Volume Billion Forecast, by End-user Industry 2020 & 2033
- Table 11: Global Scandium Market Revenue Million Forecast, by Country 2020 & 2033
- Table 12: Global Scandium Market Volume Billion Forecast, by Country 2020 & 2033
- Table 13: United States Scandium Market Revenue (Million) Forecast, by Application 2020 & 2033
- Table 14: United States Scandium Market Volume (Billion) Forecast, by Application 2020 & 2033
- Table 15: Canada Scandium Market Revenue (Million) Forecast, by Application 2020 & 2033
- Table 16: Canada Scandium Market Volume (Billion) Forecast, by Application 2020 & 2033
- Table 17: Mexico Scandium Market Revenue (Million) Forecast, by Application 2020 & 2033
- Table 18: Mexico Scandium Market Volume (Billion) Forecast, by Application 2020 & 2033
- Table 19: Global Scandium Market Revenue Million Forecast, by Product Type 2020 & 2033
- Table 20: Global Scandium Market Volume Billion Forecast, by Product Type 2020 & 2033
- Table 21: Global Scandium Market Revenue Million Forecast, by End-user Industry 2020 & 2033
- Table 22: Global Scandium Market Volume Billion Forecast, by End-user Industry 2020 & 2033
- Table 23: Global Scandium Market Revenue Million Forecast, by Country 2020 & 2033
- Table 24: Global Scandium Market Volume Billion Forecast, by Country 2020 & 2033
- Table 25: Brazil Scandium Market Revenue (Million) Forecast, by Application 2020 & 2033
- Table 26: Brazil Scandium Market Volume (Billion) Forecast, by Application 2020 & 2033
- Table 27: Argentina Scandium Market Revenue (Million) Forecast, by Application 2020 & 2033
- Table 28: Argentina Scandium Market Volume (Billion) Forecast, by Application 2020 & 2033
- Table 29: Rest of South America Scandium Market Revenue (Million) Forecast, by Application 2020 & 2033
- Table 30: Rest of South America Scandium Market Volume (Billion) Forecast, by Application 2020 & 2033
- Table 31: Global Scandium Market Revenue Million Forecast, by Product Type 2020 & 2033
- Table 32: Global Scandium Market Volume Billion Forecast, by Product Type 2020 & 2033
- Table 33: Global Scandium Market Revenue Million Forecast, by End-user Industry 2020 & 2033
- Table 34: Global Scandium Market Volume Billion Forecast, by End-user Industry 2020 & 2033
- Table 35: Global Scandium Market Revenue Million Forecast, by Country 2020 & 2033
- Table 36: Global Scandium Market Volume Billion Forecast, by Country 2020 & 2033
- Table 37: United Kingdom Scandium Market Revenue (Million) Forecast, by Application 2020 & 2033
- Table 38: United Kingdom Scandium Market Volume (Billion) Forecast, by Application 2020 & 2033
- Table 39: Germany Scandium Market Revenue (Million) Forecast, by Application 2020 & 2033
- Table 40: Germany Scandium Market Volume (Billion) Forecast, by Application 2020 & 2033
- Table 41: France Scandium Market Revenue (Million) Forecast, by Application 2020 & 2033
- Table 42: France Scandium Market Volume (Billion) Forecast, by Application 2020 & 2033
- Table 43: Italy Scandium Market Revenue (Million) Forecast, by Application 2020 & 2033
- Table 44: Italy Scandium Market Volume (Billion) Forecast, by Application 2020 & 2033
- Table 45: Spain Scandium Market Revenue (Million) Forecast, by Application 2020 & 2033
- Table 46: Spain Scandium Market Volume (Billion) Forecast, by Application 2020 & 2033
- Table 47: Russia Scandium Market Revenue (Million) Forecast, by Application 2020 & 2033
- Table 48: Russia Scandium Market Volume (Billion) Forecast, by Application 2020 & 2033
- Table 49: Benelux Scandium Market Revenue (Million) Forecast, by Application 2020 & 2033
- Table 50: Benelux Scandium Market Volume (Billion) Forecast, by Application 2020 & 2033
- Table 51: Nordics Scandium Market Revenue (Million) Forecast, by Application 2020 & 2033
- Table 52: Nordics Scandium Market Volume (Billion) Forecast, by Application 2020 & 2033
- Table 53: Rest of Europe Scandium Market Revenue (Million) Forecast, by Application 2020 & 2033
- Table 54: Rest of Europe Scandium Market Volume (Billion) Forecast, by Application 2020 & 2033
- Table 55: Global Scandium Market Revenue Million Forecast, by Product Type 2020 & 2033
- Table 56: Global Scandium Market Volume Billion Forecast, by Product Type 2020 & 2033
- Table 57: Global Scandium Market Revenue Million Forecast, by End-user Industry 2020 & 2033
- Table 58: Global Scandium Market Volume Billion Forecast, by End-user Industry 2020 & 2033
- Table 59: Global Scandium Market Revenue Million Forecast, by Country 2020 & 2033
- Table 60: Global Scandium Market Volume Billion Forecast, by Country 2020 & 2033
- Table 61: Turkey Scandium Market Revenue (Million) Forecast, by Application 2020 & 2033
- Table 62: Turkey Scandium Market Volume (Billion) Forecast, by Application 2020 & 2033
- Table 63: Israel Scandium Market Revenue (Million) Forecast, by Application 2020 & 2033
- Table 64: Israel Scandium Market Volume (Billion) Forecast, by Application 2020 & 2033
- Table 65: GCC Scandium Market Revenue (Million) Forecast, by Application 2020 & 2033
- Table 66: GCC Scandium Market Volume (Billion) Forecast, by Application 2020 & 2033
- Table 67: North Africa Scandium Market Revenue (Million) Forecast, by Application 2020 & 2033
- Table 68: North Africa Scandium Market Volume (Billion) Forecast, by Application 2020 & 2033
- Table 69: South Africa Scandium Market Revenue (Million) Forecast, by Application 2020 & 2033
- Table 70: South Africa Scandium Market Volume (Billion) Forecast, by Application 2020 & 2033
- Table 71: Rest of Middle East & Africa Scandium Market Revenue (Million) Forecast, by Application 2020 & 2033
- Table 72: Rest of Middle East & Africa Scandium Market Volume (Billion) Forecast, by Application 2020 & 2033
- Table 73: Global Scandium Market Revenue Million Forecast, by Product Type 2020 & 2033
- Table 74: Global Scandium Market Volume Billion Forecast, by Product Type 2020 & 2033
- Table 75: Global Scandium Market Revenue Million Forecast, by End-user Industry 2020 & 2033
- Table 76: Global Scandium Market Volume Billion Forecast, by End-user Industry 2020 & 2033
- Table 77: Global Scandium Market Revenue Million Forecast, by Country 2020 & 2033
- Table 78: Global Scandium Market Volume Billion Forecast, by Country 2020 & 2033
- Table 79: China Scandium Market Revenue (Million) Forecast, by Application 2020 & 2033
- Table 80: China Scandium Market Volume (Billion) Forecast, by Application 2020 & 2033
- Table 81: India Scandium Market Revenue (Million) Forecast, by Application 2020 & 2033
- Table 82: India Scandium Market Volume (Billion) Forecast, by Application 2020 & 2033
- Table 83: Japan Scandium Market Revenue (Million) Forecast, by Application 2020 & 2033
- Table 84: Japan Scandium Market Volume (Billion) Forecast, by Application 2020 & 2033
- Table 85: South Korea Scandium Market Revenue (Million) Forecast, by Application 2020 & 2033
- Table 86: South Korea Scandium Market Volume (Billion) Forecast, by Application 2020 & 2033
- Table 87: ASEAN Scandium Market Revenue (Million) Forecast, by Application 2020 & 2033
- Table 88: ASEAN Scandium Market Volume (Billion) Forecast, by Application 2020 & 2033
- Table 89: Oceania Scandium Market Revenue (Million) Forecast, by Application 2020 & 2033
- Table 90: Oceania Scandium Market Volume (Billion) Forecast, by Application 2020 & 2033
- Table 91: Rest of Asia Pacific Scandium Market Revenue (Million) Forecast, by Application 2020 & 2033
- Table 92: Rest of Asia Pacific Scandium Market Volume (Billion) Forecast, by Application 2020 & 2033
Frequently Asked Questions
1. What is the projected Compound Annual Growth Rate (CAGR) of the Scandium Market?
The projected CAGR is approximately 14.70%.
2. Which companies are prominent players in the Scandium Market?
Key companies in the market include Guangxi Maoxin Technology Co Ltd, Henan Rongjia Scandium Vanadium Technology Co Ltd, Huizhou Top Metal Materials Co Ltd, Hunan Rare Earth Metal Materials Research Institute Co Ltd, Hunan Oriental Scandium Co Ltd, JSC Dalur, MCC Group, NioCorp Development Ltd, Rio Tinto, Rusal, Scandium International Mining Corporation, Stanford Advanced Materials, Sumitomo Metal Mining Co Ltd (Taganito HPAL nickel Corp ), Sunrise Energy Metals Limited, Treibacher Industrie AG *List Not Exhaustive.
3. What are the main segments of the Scandium Market?
The market segments include Product Type, End-user Industry.
4. Can you provide details about the market size?
The market size is estimated to be USD 0.67 Million as of 2022.
5. What are some drivers contributing to market growth?
Increasing Usage in Solid Oxide Fuel Cells (SOFCS); Increasing Demand for Aluminum-Scandium Alloys in the Aerospace and Defense Industry.
6. What are the notable trends driving market growth?
The Solid Oxide Fuel Cells (SOFCs) Segment is Expected to Dominate the Market.
7. Are there any restraints impacting market growth?
Increasing Usage in Solid Oxide Fuel Cells (SOFCS); Increasing Demand for Aluminum-Scandium Alloys in the Aerospace and Defense Industry.
8. Can you provide examples of recent developments in the market?
January 2024: NioCorp Developments Ltd agreed with London-based Brunel University London, a leading research university focused on the global application of cast aluminum alloys, to develop innovative aluminum-scandium alloys and applications for use in the automotive sector.
9. What pricing options are available for accessing the report?
Pricing options include single-user, multi-user, and enterprise licenses priced at USD 4750, USD 5250, and USD 8750 respectively.
10. Is the market size provided in terms of value or volume?
The market size is provided in terms of value, measured in Million and volume, measured in Billion.
11. Are there any specific market keywords associated with the report?
Yes, the market keyword associated with the report is "Scandium Market," which aids in identifying and referencing the specific market segment covered.
12. How do I determine which pricing option suits my needs best?
The pricing options vary based on user requirements and access needs. Individual users may opt for single-user licenses, while businesses requiring broader access may choose multi-user or enterprise licenses for cost-effective access to the report.
13. Are there any additional resources or data provided in the Scandium Market report?
While the report offers comprehensive insights, it's advisable to review the specific contents or supplementary materials provided to ascertain if additional resources or data are available.
14. How can I stay updated on further developments or reports in the Scandium Market?
To stay informed about further developments, trends, and reports in the Scandium Market, consider subscribing to industry newsletters, following relevant companies and organizations, or regularly checking reputable industry news sources and publications.
Methodology
Step 1 - Identification of Relevant Samples Size from Population Database


Step 2 - Approaches for Defining Global Market Size (Value, Volume* & Price*)

Note*: In applicable scenarios
Step 3 - Data Sources
Primary Research
- Web Analytics
- Survey Reports
- Research Institute
- Latest Research Reports
- Opinion Leaders
Secondary Research
- Annual Reports
- White Paper
- Latest Press Release
- Industry Association
- Paid Database
- Investor Presentations

Step 4 - Data Triangulation
Involves using different sources of information in order to increase the validity of a study
These sources are likely to be stakeholders in a program - participants, other researchers, program staff, other community members, and so on.
Then we put all data in single framework & apply various statistical tools to find out the dynamic on the market.
During the analysis stage, feedback from the stakeholder groups would be compared to determine areas of agreement as well as areas of divergence