

Key Insights
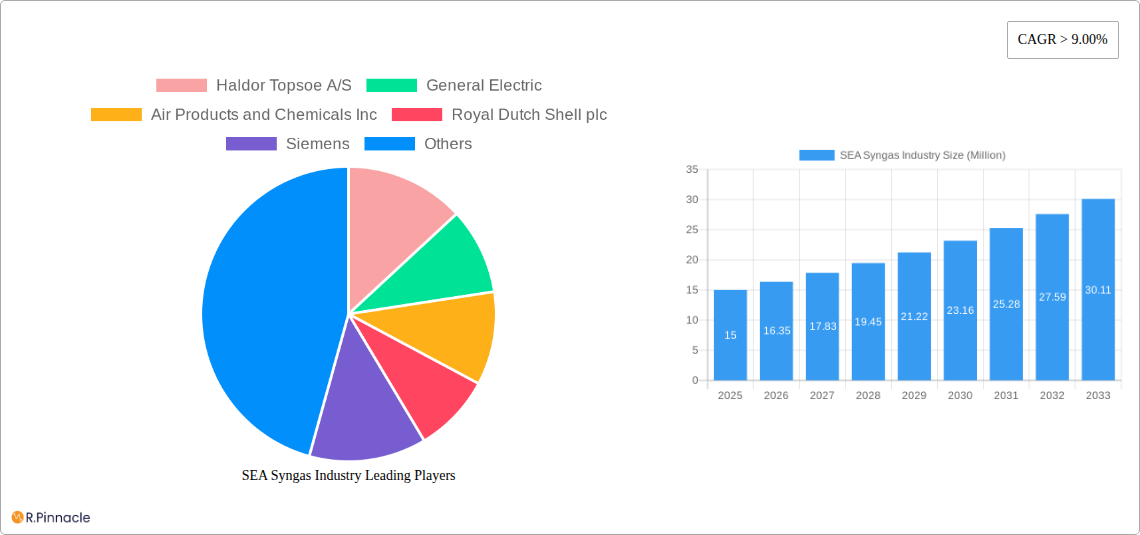
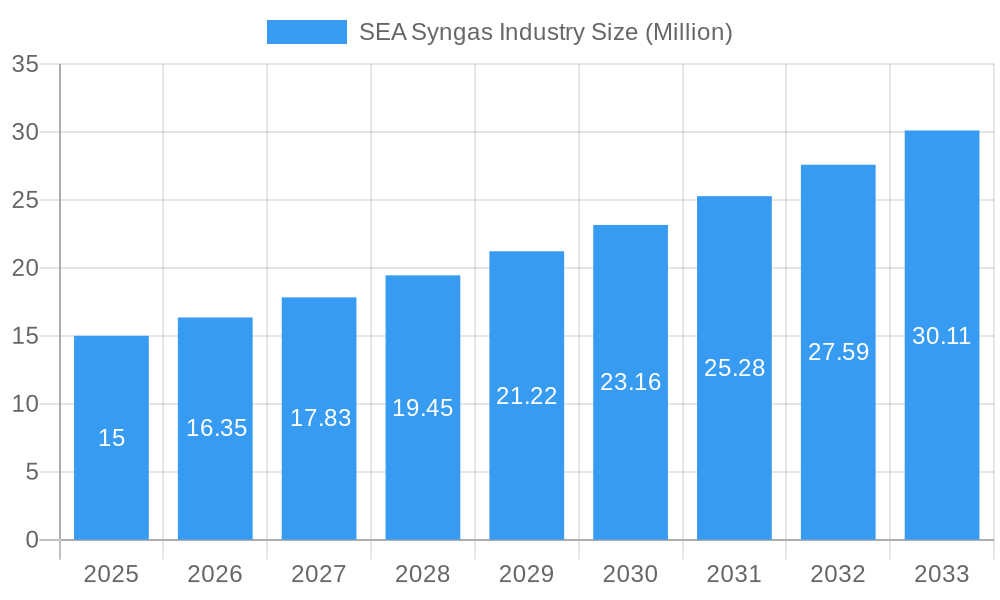
The Southeast Asia (SEA) syngas industry is poised for significant growth, driven by increasing energy demands and the region's commitment to diversifying its energy sources. With a global market size of $230.05 million in 2025 and a Compound Annual Growth Rate (CAGR) exceeding 9%, the SEA market is expected to witness substantial expansion over the forecast period (2025-2033). Key drivers include the growing power generation sector, burgeoning chemical industries, and a push towards cleaner energy solutions. The increasing adoption of coal gasification and biomass gasification technologies will further fuel market growth. While challenges such as fluctuating raw material prices and stringent environmental regulations exist, the overall outlook remains positive. The dominance of specific technologies like steam reforming and specific feedstocks like natural gas will depend on regional infrastructure and policy. Furthermore, the diverse applications of syngas, ranging from power generation to chemical feedstock, create multiple avenues for market expansion within SEA. The presence of established international players alongside local companies indicates a healthy competitive landscape that is likely to drive innovation and efficiency improvements within the industry. Specific regional analysis reveals substantial potential in countries like Indonesia, Singapore, and Thailand, driven by their industrial growth and governmental support for renewable energy initiatives. Further research into the specific nuances of each country's regulatory environment and energy mix will be crucial for determining more precise growth projections.
SEA Syngas Industry Market Size (In Million)
The competitive landscape is characterized by a mix of global giants like Haldor Topsoe, Air Products, and Shell, alongside regional players. These companies are strategically investing in advanced technologies and expanding their production capacities to meet the growing demand. However, the SEA syngas market faces challenges including infrastructure limitations in some countries, inconsistencies in policy implementation across the region, and the need for skilled manpower. Despite these hurdles, the long-term growth prospects are strong, supported by government initiatives promoting industrialization and energy security, as well as the inherent versatility and utility of syngas across various sectors. The continued development of sustainable and efficient syngas production technologies will be a critical factor in shaping the future trajectory of this dynamic market.
SEA Syngas Industry Company Market Share
SEA Syngas Industry Market Report: 2019-2033
This comprehensive report provides a detailed analysis of the Southeast Asia (SEA) syngas industry, offering invaluable insights for industry professionals, investors, and policymakers. Covering the period 2019-2033, with a focus on 2025, this report presents a meticulous forecast of market trends, growth drivers, and challenges. The report is meticulously structured to provide actionable insights, incorporating key market segments, leading players, and emerging opportunities. The total market size is predicted to reach xx Million by 2033.
SEA Syngas Industry Market Structure & Innovation Trends
The SEA syngas market is characterized by a dynamic and evolving competitive landscape. This section offers an in-depth analysis of market concentration, identifying key players and their market influence. We meticulously examine the drivers of innovation, including advancements in gasification technologies and the growing emphasis on sustainable energy solutions. Furthermore, a thorough review of the prevailing regulatory frameworks provides crucial insights into the operational and strategic considerations for businesses. The impact of recent Mergers & Acquisitions (M&A) is assessed, with a focus on estimated deal values and their implications for market consolidation. Our analysis includes the market share of prominent companies such as Haldor Topsoe A/S, General Electric, Air Products and Chemicals Inc, Royal Dutch Shell plc, Siemens, KBR Inc, BASF SE, DuPont, Linde plc, SynGas Technology LLC, METHANEX CORPORATION, MITSUBISHI HEAVY INDUSTRIES LTD, Air Liquide, BP plc, and TechnipFMC plc, among others. The report quantifies the impact of recent M&A activities, with estimated deal values totaling xx Million over the last five years. Key innovation drivers are highlighted, encompassing supportive government incentives aimed at fostering renewable energy and significant technological breakthroughs in gasification processes that enhance efficiency and reduce costs. The intricate web of regulatory frameworks shaping market dynamics is thoroughly dissected, alongside an analysis of substitute products and detailed insights into end-user demographics.
- Market Concentration: The market exhibits high concentration, with the top 5 players collectively holding approximately xx% of the market share in 2025, underscoring the significant influence of established entities.
- M&A Activity: A robust M&A landscape is evident, with xx major deals recorded since 2019, representing an aggregate transaction value of approximately xx Million. This indicates a strategic consolidation trend within the industry.
- Innovation Drivers: A confluence of factors propels innovation, prominently featuring supportive government policies championing renewable energy sources and continuous technological advancements that enhance gasification efficiency and broaden feedstock utilization.
- Regulatory Frameworks: Stringent emission standards and comprehensive environmental regulations play a pivotal role in shaping plant operations and influencing feedstock choices, driving a move towards cleaner and more sustainable practices.
SEA Syngas Industry Market Dynamics & Trends
This section explores the market's dynamic growth trajectory, analyzing key drivers, disruptive technologies, evolving consumer preferences, and competitive dynamics. The report projects a Compound Annual Growth Rate (CAGR) of xx% from 2025 to 2033, driven by factors such as increasing demand for chemicals and power generation, growing adoption of syngas as a feedstock for various applications, and the ongoing development and adoption of advanced gasification technologies. The analysis encompasses market penetration rates across various segments and detailed insights into the competitive landscape. Specific examples of technological disruptions are highlighted, alongside projections for the future of the market.
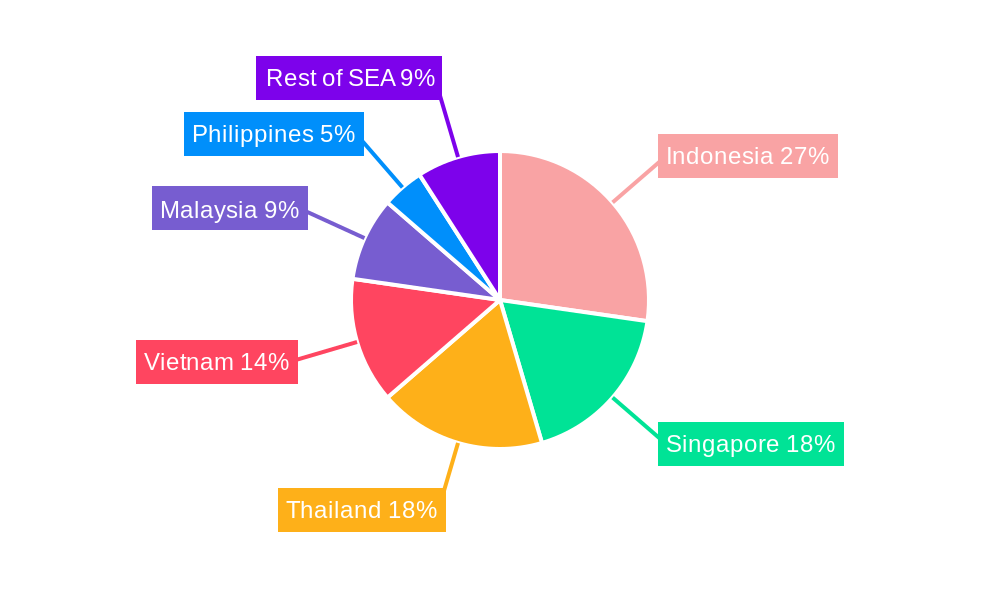
Dominant Regions & Segments in SEA Syngas Industry
This section identifies the leading regions and segments within the SEA syngas market. Detailed analysis covers Dimethyl Ether (Liquid Fuels, Gaseous Fuels), Feedstock (Coal, Natural Gas, Petroleum, Pet-coke, Biomass), Technology (Steam Reforming, Partial Oxidation, Auto-thermal Reforming, Combined/Two-step Reforming, Biomass Gasification), Gasifier Type (Fixed Bed, Entrained Flow, Fluidized Bed), and Application (Power Generation, Chemicals). Growth in specific areas is driven by factors like favorable government policies, economic growth, and readily available resources.
Key Drivers:
- Indonesia: Strong government support for renewable energy and rapid industrialization.
- Malaysia: Abundant natural gas reserves and a robust chemical industry.
- Vietnam: Increasing power demand and supportive regulatory environment.
- Thailand: Growing investments in petrochemical facilities.
Dominant Segments:
- Natural Gas Feedstock: Holds the largest market share due to abundance and cost-effectiveness.
- Steam Reforming Technology: Most widely adopted due to its maturity and efficiency.
- Power Generation Application: Significant driver of growth due to increasing energy demand.
SEA Syngas Industry Product Innovations
This section summarizes recent product developments, highlighting their applications and competitive advantages. We analyze the impact of technological trends on market fit, focusing on advancements in gasification efficiency, syngas purification, and downstream processing. New technologies focusing on enhanced energy efficiency and reduced carbon emissions are discussed.
Report Scope & Segmentation Analysis
This comprehensive report meticulously examines the SEA syngas market, delving into its intricate segmentation. We provide detailed analyses across critical segments including feedstock type (e.g., natural gas, coal, biomass, waste), gasification technology (e.g., entrained flow, fluidized bed, fixed bed), gasifier type, application (e.g., power generation, chemical production, fuel production), and product type (with a specific focus on Dimethyl Ether – encompassing both liquid and gaseous fuels). For each segment, the report offers detailed growth projections, current market size estimations, and a granular understanding of the competitive dynamics at play. This granular approach delivers a holistic and forward-looking perspective on the market structure and its future growth potential. Significant growth is anticipated across all segments, particularly those benefiting from robust government support initiatives and access to abundant local natural resources, positioning them for accelerated development.
Key Drivers of SEA Syngas Industry Growth
The burgeoning SEA syngas industry is propelled by a confluence of robust growth drivers. A primary catalyst is the ever-increasing regional energy demand, coupled with proactive government initiatives actively promoting the adoption of renewable and alternative energy sources. Favorable economic conditions across several SEA nations further bolster investment and expansion. Crucially, continuous technological advancements are significantly enhancing gasification efficiency, leading to reduced production costs and improved environmental performance. Specifically, substantial and ongoing investments within the power generation sector and the chemical industry are creating substantial demand for syngas as a vital intermediate product. This sustained demand, supported by technological innovation and policy, forms the bedrock of the industry's expansion.
Challenges in the SEA Syngas Industry Sector
The SEA syngas industry faces challenges, including regulatory hurdles related to environmental protection, volatile feedstock prices, and competition from alternative energy sources. Supply chain complexities and infrastructure limitations in certain regions pose further obstacles. These factors impact production costs and market competitiveness.
Emerging Opportunities in SEA Syngas Industry
The SEA syngas sector is ripe with emerging opportunities, driven by innovation and the growing global imperative for sustainability. A significant avenue lies in the expanding application of syngas for the production of advanced sustainable fuels and environmentally friendly chemicals, aligning with decarbonization goals. Advancements in carbon capture and storage (CCS) technology present a compelling opportunity to mitigate the environmental footprint of syngas production, making it a more attractive option for various industrial processes. Furthermore, the development of novel and highly efficient gasification technologies capable of utilizing a diverse range of biomass and waste feedstocks unlocks new feedstock avenues and reduces reliance on fossil fuels. The strategic penetration of new markets in previously underserved regions also presents substantial untapped potential for syngas applications and project development.
Leading Players in the SEA Syngas Industry Market
- Haldor Topsoe A/S
- General Electric
- Air Products and Chemicals Inc
- Royal Dutch Shell plc
- Siemens
- KBR Inc
- BASF SE
- DuPont
- Linde plc
- SynGas Technology LLC
- METHANEX CORPORATION
- MITSUBISHI HEAVY INDUSTRIES LTD
- Air Liquide
- BP plc
- TechnipFMC plc
- List Not Exhaustive
Key Developments in SEA Syngas Industry
- 2022 Q3: Commencement of construction for a substantial new syngas plant in Indonesia, representing a significant investment of xx Million, underscoring the region's commitment to expanding syngas infrastructure.
- 2021 Q4: The Malaysian government unveiled a forward-thinking policy announcing new incentives specifically designed to encourage and support syngas-based power generation, signaling a strategic move towards cleaner energy solutions.
- 2020 Q2: A leading research institute announced a groundbreaking technological advancement in biomass gasification, promising enhanced efficiency and broader feedstock applicability, a key step towards sustainable syngas production.
- 2019 Q1: A strategic partnership was established between two key industry players, fostering collaboration and synergy for joint syngas project development, indicating a trend towards industry consolidation and shared expertise.
- Ongoing: Sustained and significant investments are being channeled into research and development (R&D) initiatives, with a primary focus on enhancing syngas production efficiency, optimizing process economics, and critically, minimizing the overall environmental impact of syngas generation.
Future Outlook for SEA Syngas Industry Market
The SEA syngas market is poised for robust growth, driven by increasing energy demand, supportive government policies, and technological advancements. Strategic partnerships and investments in R&D will further fuel expansion. The market's future potential is substantial, particularly in regions with abundant resources and supportive regulatory frameworks.
SEA Syngas Industry Segmentation
-
1. Feedstock
- 1.1. Coal
- 1.2. Natural Gas
- 1.3. Petroleum
- 1.4. Pet-coke
- 1.5. Biomass
-
2. Technology
- 2.1. Steam Reforming
- 2.2. Partial Oxidation
- 2.3. Auto-thermal Reforming
- 2.4. Combined or Two-step Reforming
- 2.5. Biomass Gasification
-
3. Gasifier Type
- 3.1. Fixed Bed
- 3.2. Entrained Flow
- 3.3. Fluidized Bed
-
4. Application
- 4.1. Power Generation
-
4.2. Chemicals
- 4.2.1. Methanol
- 4.2.2. Ammonia
- 4.2.3. Oxo Chemicals
- 4.2.4. n-Butanol
- 4.2.5. Hydrogen
- 4.2.6. Dimethyl Ether
- 4.3. Liquid Fuels
- 4.4. Gaseous Fuels
-
5. Geography
- 5.1. Indonesia
- 5.2. Thailand
- 5.3. Malaysia
- 5.4. Singapore
- 5.5. Philippines
- 5.6. Vietnam
- 5.7. Rest of South-East Asia (SEA)
SEA Syngas Industry Segmentation By Geography
- 1. Indonesia
- 2. Thailand
- 3. Malaysia
- 4. Singapore
- 5. Philippines
- 6. Vietnam
- 7. Rest of South East Asia
SEA Syngas Industry Regional Market Share
Geographic Coverage of SEA Syngas Industry
SEA Syngas Industry REPORT HIGHLIGHTS
| Aspects | Details |
|---|---|
| Study Period | 2020-2034 |
| Base Year | 2025 |
| Estimated Year | 2026 |
| Forecast Period | 2026-2034 |
| Historical Period | 2020-2025 |
| Growth Rate | CAGR of > 9.00% from 2020-2034 |
| Segmentation |
|
Table of Contents
- 1. Introduction
- 1.1. Research Scope
- 1.2. Market Segmentation
- 1.3. Research Objective
- 1.4. Definitions and Assumptions
- 2. Executive Summary
- 2.1. Market Snapshot
- 3. Market Dynamics
- 3.1. Market Drivers
- 3.2. Market Restrains
- 3.3. Market Trends
- 3.4. Market Opportunities
- 4. Market Factor Analysis
- 4.1. Porters Five Forces
- 4.1.1. Bargaining Power of Suppliers
- 4.1.2. Bargaining Power of Buyers
- 4.1.3. Threat of New Entrants
- 4.1.4. Threat of Substitutes
- 4.1.5. Competitive Rivalry
- 4.2. PESTEL analysis
- 4.3. BCG Analysis
- 4.3.1. Stars (High Growth, High Market Share)
- 4.3.2. Cash Cows (Low Growth, High Market Share)
- 4.3.3. Question Mark (High Growth, Low Market Share)
- 4.3.4. Dogs (Low Growth, Low Market Share)
- 4.4. Ansoff Matrix Analysis
- 4.5. Supply Chain Analysis
- 4.6. Regulatory Landscape
- 4.7. Current Market Potential and Opportunity Assessment (TAM–SAM–SOM Framework)
- 4.8. PRI Analyst Note
- 4.1. Porters Five Forces
- 5. Market Analysis, Insights and Forecast 2021-2033
- 5.1. Market Analysis, Insights and Forecast - by Feedstock
- 5.1.1. Coal
- 5.1.2. Natural Gas
- 5.1.3. Petroleum
- 5.1.4. Pet-coke
- 5.1.5. Biomass
- 5.2. Market Analysis, Insights and Forecast - by Technology
- 5.2.1. Steam Reforming
- 5.2.2. Partial Oxidation
- 5.2.3. Auto-thermal Reforming
- 5.2.4. Combined or Two-step Reforming
- 5.2.5. Biomass Gasification
- 5.3. Market Analysis, Insights and Forecast - by Gasifier Type
- 5.3.1. Fixed Bed
- 5.3.2. Entrained Flow
- 5.3.3. Fluidized Bed
- 5.4. Market Analysis, Insights and Forecast - by Application
- 5.4.1. Power Generation
- 5.4.2. Chemicals
- 5.4.2.1. Methanol
- 5.4.2.2. Ammonia
- 5.4.2.3. Oxo Chemicals
- 5.4.2.4. n-Butanol
- 5.4.2.5. Hydrogen
- 5.4.2.6. Dimethyl Ether
- 5.4.3. Liquid Fuels
- 5.4.4. Gaseous Fuels
- 5.5. Market Analysis, Insights and Forecast - by Geography
- 5.5.1. Indonesia
- 5.5.2. Thailand
- 5.5.3. Malaysia
- 5.5.4. Singapore
- 5.5.5. Philippines
- 5.5.6. Vietnam
- 5.5.7. Rest of South-East Asia (SEA)
- 5.6. Market Analysis, Insights and Forecast - by Region
- 5.6.1. Indonesia
- 5.6.2. Thailand
- 5.6.3. Malaysia
- 5.6.4. Singapore
- 5.6.5. Philippines
- 5.6.6. Vietnam
- 5.6.7. Rest of South East Asia
- 5.1. Market Analysis, Insights and Forecast - by Feedstock
- 6. Global SEA Syngas Industry Analysis, Insights and Forecast, 2021-2033
- 6.1. Market Analysis, Insights and Forecast - by Feedstock
- 6.1.1. Coal
- 6.1.2. Natural Gas
- 6.1.3. Petroleum
- 6.1.4. Pet-coke
- 6.1.5. Biomass
- 6.2. Market Analysis, Insights and Forecast - by Technology
- 6.2.1. Steam Reforming
- 6.2.2. Partial Oxidation
- 6.2.3. Auto-thermal Reforming
- 6.2.4. Combined or Two-step Reforming
- 6.2.5. Biomass Gasification
- 6.3. Market Analysis, Insights and Forecast - by Gasifier Type
- 6.3.1. Fixed Bed
- 6.3.2. Entrained Flow
- 6.3.3. Fluidized Bed
- 6.4. Market Analysis, Insights and Forecast - by Application
- 6.4.1. Power Generation
- 6.4.2. Chemicals
- 6.4.2.1. Methanol
- 6.4.2.2. Ammonia
- 6.4.2.3. Oxo Chemicals
- 6.4.2.4. n-Butanol
- 6.4.2.5. Hydrogen
- 6.4.2.6. Dimethyl Ether
- 6.4.3. Liquid Fuels
- 6.4.4. Gaseous Fuels
- 6.5. Market Analysis, Insights and Forecast - by Geography
- 6.5.1. Indonesia
- 6.5.2. Thailand
- 6.5.3. Malaysia
- 6.5.4. Singapore
- 6.5.5. Philippines
- 6.5.6. Vietnam
- 6.5.7. Rest of South-East Asia (SEA)
- 6.1. Market Analysis, Insights and Forecast - by Feedstock
- 7. Indonesia SEA Syngas Industry Analysis, Insights and Forecast, 2020-2032
- 7.1. Market Analysis, Insights and Forecast - by Feedstock
- 7.1.1. Coal
- 7.1.2. Natural Gas
- 7.1.3. Petroleum
- 7.1.4. Pet-coke
- 7.1.5. Biomass
- 7.2. Market Analysis, Insights and Forecast - by Technology
- 7.2.1. Steam Reforming
- 7.2.2. Partial Oxidation
- 7.2.3. Auto-thermal Reforming
- 7.2.4. Combined or Two-step Reforming
- 7.2.5. Biomass Gasification
- 7.3. Market Analysis, Insights and Forecast - by Gasifier Type
- 7.3.1. Fixed Bed
- 7.3.2. Entrained Flow
- 7.3.3. Fluidized Bed
- 7.4. Market Analysis, Insights and Forecast - by Application
- 7.4.1. Power Generation
- 7.4.2. Chemicals
- 7.4.2.1. Methanol
- 7.4.2.2. Ammonia
- 7.4.2.3. Oxo Chemicals
- 7.4.2.4. n-Butanol
- 7.4.2.5. Hydrogen
- 7.4.2.6. Dimethyl Ether
- 7.4.3. Liquid Fuels
- 7.4.4. Gaseous Fuels
- 7.5. Market Analysis, Insights and Forecast - by Geography
- 7.5.1. Indonesia
- 7.5.2. Thailand
- 7.5.3. Malaysia
- 7.5.4. Singapore
- 7.5.5. Philippines
- 7.5.6. Vietnam
- 7.5.7. Rest of South-East Asia (SEA)
- 7.1. Market Analysis, Insights and Forecast - by Feedstock
- 8. Thailand SEA Syngas Industry Analysis, Insights and Forecast, 2020-2032
- 8.1. Market Analysis, Insights and Forecast - by Feedstock
- 8.1.1. Coal
- 8.1.2. Natural Gas
- 8.1.3. Petroleum
- 8.1.4. Pet-coke
- 8.1.5. Biomass
- 8.2. Market Analysis, Insights and Forecast - by Technology
- 8.2.1. Steam Reforming
- 8.2.2. Partial Oxidation
- 8.2.3. Auto-thermal Reforming
- 8.2.4. Combined or Two-step Reforming
- 8.2.5. Biomass Gasification
- 8.3. Market Analysis, Insights and Forecast - by Gasifier Type
- 8.3.1. Fixed Bed
- 8.3.2. Entrained Flow
- 8.3.3. Fluidized Bed
- 8.4. Market Analysis, Insights and Forecast - by Application
- 8.4.1. Power Generation
- 8.4.2. Chemicals
- 8.4.2.1. Methanol
- 8.4.2.2. Ammonia
- 8.4.2.3. Oxo Chemicals
- 8.4.2.4. n-Butanol
- 8.4.2.5. Hydrogen
- 8.4.2.6. Dimethyl Ether
- 8.4.3. Liquid Fuels
- 8.4.4. Gaseous Fuels
- 8.5. Market Analysis, Insights and Forecast - by Geography
- 8.5.1. Indonesia
- 8.5.2. Thailand
- 8.5.3. Malaysia
- 8.5.4. Singapore
- 8.5.5. Philippines
- 8.5.6. Vietnam
- 8.5.7. Rest of South-East Asia (SEA)
- 8.1. Market Analysis, Insights and Forecast - by Feedstock
- 9. Malaysia SEA Syngas Industry Analysis, Insights and Forecast, 2020-2032
- 9.1. Market Analysis, Insights and Forecast - by Feedstock
- 9.1.1. Coal
- 9.1.2. Natural Gas
- 9.1.3. Petroleum
- 9.1.4. Pet-coke
- 9.1.5. Biomass
- 9.2. Market Analysis, Insights and Forecast - by Technology
- 9.2.1. Steam Reforming
- 9.2.2. Partial Oxidation
- 9.2.3. Auto-thermal Reforming
- 9.2.4. Combined or Two-step Reforming
- 9.2.5. Biomass Gasification
- 9.3. Market Analysis, Insights and Forecast - by Gasifier Type
- 9.3.1. Fixed Bed
- 9.3.2. Entrained Flow
- 9.3.3. Fluidized Bed
- 9.4. Market Analysis, Insights and Forecast - by Application
- 9.4.1. Power Generation
- 9.4.2. Chemicals
- 9.4.2.1. Methanol
- 9.4.2.2. Ammonia
- 9.4.2.3. Oxo Chemicals
- 9.4.2.4. n-Butanol
- 9.4.2.5. Hydrogen
- 9.4.2.6. Dimethyl Ether
- 9.4.3. Liquid Fuels
- 9.4.4. Gaseous Fuels
- 9.5. Market Analysis, Insights and Forecast - by Geography
- 9.5.1. Indonesia
- 9.5.2. Thailand
- 9.5.3. Malaysia
- 9.5.4. Singapore
- 9.5.5. Philippines
- 9.5.6. Vietnam
- 9.5.7. Rest of South-East Asia (SEA)
- 9.1. Market Analysis, Insights and Forecast - by Feedstock
- 10. Singapore SEA Syngas Industry Analysis, Insights and Forecast, 2020-2032
- 10.1. Market Analysis, Insights and Forecast - by Feedstock
- 10.1.1. Coal
- 10.1.2. Natural Gas
- 10.1.3. Petroleum
- 10.1.4. Pet-coke
- 10.1.5. Biomass
- 10.2. Market Analysis, Insights and Forecast - by Technology
- 10.2.1. Steam Reforming
- 10.2.2. Partial Oxidation
- 10.2.3. Auto-thermal Reforming
- 10.2.4. Combined or Two-step Reforming
- 10.2.5. Biomass Gasification
- 10.3. Market Analysis, Insights and Forecast - by Gasifier Type
- 10.3.1. Fixed Bed
- 10.3.2. Entrained Flow
- 10.3.3. Fluidized Bed
- 10.4. Market Analysis, Insights and Forecast - by Application
- 10.4.1. Power Generation
- 10.4.2. Chemicals
- 10.4.2.1. Methanol
- 10.4.2.2. Ammonia
- 10.4.2.3. Oxo Chemicals
- 10.4.2.4. n-Butanol
- 10.4.2.5. Hydrogen
- 10.4.2.6. Dimethyl Ether
- 10.4.3. Liquid Fuels
- 10.4.4. Gaseous Fuels
- 10.5. Market Analysis, Insights and Forecast - by Geography
- 10.5.1. Indonesia
- 10.5.2. Thailand
- 10.5.3. Malaysia
- 10.5.4. Singapore
- 10.5.5. Philippines
- 10.5.6. Vietnam
- 10.5.7. Rest of South-East Asia (SEA)
- 10.1. Market Analysis, Insights and Forecast - by Feedstock
- 11. Philippines SEA Syngas Industry Analysis, Insights and Forecast, 2020-2032
- 11.1. Market Analysis, Insights and Forecast - by Feedstock
- 11.1.1. Coal
- 11.1.2. Natural Gas
- 11.1.3. Petroleum
- 11.1.4. Pet-coke
- 11.1.5. Biomass
- 11.2. Market Analysis, Insights and Forecast - by Technology
- 11.2.1. Steam Reforming
- 11.2.2. Partial Oxidation
- 11.2.3. Auto-thermal Reforming
- 11.2.4. Combined or Two-step Reforming
- 11.2.5. Biomass Gasification
- 11.3. Market Analysis, Insights and Forecast - by Gasifier Type
- 11.3.1. Fixed Bed
- 11.3.2. Entrained Flow
- 11.3.3. Fluidized Bed
- 11.4. Market Analysis, Insights and Forecast - by Application
- 11.4.1. Power Generation
- 11.4.2. Chemicals
- 11.4.2.1. Methanol
- 11.4.2.2. Ammonia
- 11.4.2.3. Oxo Chemicals
- 11.4.2.4. n-Butanol
- 11.4.2.5. Hydrogen
- 11.4.2.6. Dimethyl Ether
- 11.4.3. Liquid Fuels
- 11.4.4. Gaseous Fuels
- 11.5. Market Analysis, Insights and Forecast - by Geography
- 11.5.1. Indonesia
- 11.5.2. Thailand
- 11.5.3. Malaysia
- 11.5.4. Singapore
- 11.5.5. Philippines
- 11.5.6. Vietnam
- 11.5.7. Rest of South-East Asia (SEA)
- 11.1. Market Analysis, Insights and Forecast - by Feedstock
- 12. Vietnam SEA Syngas Industry Analysis, Insights and Forecast, 2020-2032
- 12.1. Market Analysis, Insights and Forecast - by Feedstock
- 12.1.1. Coal
- 12.1.2. Natural Gas
- 12.1.3. Petroleum
- 12.1.4. Pet-coke
- 12.1.5. Biomass
- 12.2. Market Analysis, Insights and Forecast - by Technology
- 12.2.1. Steam Reforming
- 12.2.2. Partial Oxidation
- 12.2.3. Auto-thermal Reforming
- 12.2.4. Combined or Two-step Reforming
- 12.2.5. Biomass Gasification
- 12.3. Market Analysis, Insights and Forecast - by Gasifier Type
- 12.3.1. Fixed Bed
- 12.3.2. Entrained Flow
- 12.3.3. Fluidized Bed
- 12.4. Market Analysis, Insights and Forecast - by Application
- 12.4.1. Power Generation
- 12.4.2. Chemicals
- 12.4.2.1. Methanol
- 12.4.2.2. Ammonia
- 12.4.2.3. Oxo Chemicals
- 12.4.2.4. n-Butanol
- 12.4.2.5. Hydrogen
- 12.4.2.6. Dimethyl Ether
- 12.4.3. Liquid Fuels
- 12.4.4. Gaseous Fuels
- 12.5. Market Analysis, Insights and Forecast - by Geography
- 12.5.1. Indonesia
- 12.5.2. Thailand
- 12.5.3. Malaysia
- 12.5.4. Singapore
- 12.5.5. Philippines
- 12.5.6. Vietnam
- 12.5.7. Rest of South-East Asia (SEA)
- 12.1. Market Analysis, Insights and Forecast - by Feedstock
- 13. Rest of South East Asia SEA Syngas Industry Analysis, Insights and Forecast, 2020-2032
- 13.1. Market Analysis, Insights and Forecast - by Feedstock
- 13.1.1. Coal
- 13.1.2. Natural Gas
- 13.1.3. Petroleum
- 13.1.4. Pet-coke
- 13.1.5. Biomass
- 13.2. Market Analysis, Insights and Forecast - by Technology
- 13.2.1. Steam Reforming
- 13.2.2. Partial Oxidation
- 13.2.3. Auto-thermal Reforming
- 13.2.4. Combined or Two-step Reforming
- 13.2.5. Biomass Gasification
- 13.3. Market Analysis, Insights and Forecast - by Gasifier Type
- 13.3.1. Fixed Bed
- 13.3.2. Entrained Flow
- 13.3.3. Fluidized Bed
- 13.4. Market Analysis, Insights and Forecast - by Application
- 13.4.1. Power Generation
- 13.4.2. Chemicals
- 13.4.2.1. Methanol
- 13.4.2.2. Ammonia
- 13.4.2.3. Oxo Chemicals
- 13.4.2.4. n-Butanol
- 13.4.2.5. Hydrogen
- 13.4.2.6. Dimethyl Ether
- 13.4.3. Liquid Fuels
- 13.4.4. Gaseous Fuels
- 13.5. Market Analysis, Insights and Forecast - by Geography
- 13.5.1. Indonesia
- 13.5.2. Thailand
- 13.5.3. Malaysia
- 13.5.4. Singapore
- 13.5.5. Philippines
- 13.5.6. Vietnam
- 13.5.7. Rest of South-East Asia (SEA)
- 13.1. Market Analysis, Insights and Forecast - by Feedstock
- 14. Competitive Analysis
- 14.1. Company Profiles
- 14.1.1 Haldor Topsoe A/S
- 14.1.1.1. Company Overview
- 14.1.1.2. Products
- 14.1.1.3. Company Financials
- 14.1.1.4. SWOT Analysis
- 14.1.2 General Electric
- 14.1.2.1. Company Overview
- 14.1.2.2. Products
- 14.1.2.3. Company Financials
- 14.1.2.4. SWOT Analysis
- 14.1.3 Air Products and Chemicals Inc
- 14.1.3.1. Company Overview
- 14.1.3.2. Products
- 14.1.3.3. Company Financials
- 14.1.3.4. SWOT Analysis
- 14.1.4 Royal Dutch Shell plc
- 14.1.4.1. Company Overview
- 14.1.4.2. Products
- 14.1.4.3. Company Financials
- 14.1.4.4. SWOT Analysis
- 14.1.5 Siemens
- 14.1.5.1. Company Overview
- 14.1.5.2. Products
- 14.1.5.3. Company Financials
- 14.1.5.4. SWOT Analysis
- 14.1.6 KBR Inc
- 14.1.6.1. Company Overview
- 14.1.6.2. Products
- 14.1.6.3. Company Financials
- 14.1.6.4. SWOT Analysis
- 14.1.7 BASF SE
- 14.1.7.1. Company Overview
- 14.1.7.2. Products
- 14.1.7.3. Company Financials
- 14.1.7.4. SWOT Analysis
- 14.1.8 DuPont
- 14.1.8.1. Company Overview
- 14.1.8.2. Products
- 14.1.8.3. Company Financials
- 14.1.8.4. SWOT Analysis
- 14.1.9 Linde plc
- 14.1.9.1. Company Overview
- 14.1.9.2. Products
- 14.1.9.3. Company Financials
- 14.1.9.4. SWOT Analysis
- 14.1.10 SynGas Technology LLC
- 14.1.10.1. Company Overview
- 14.1.10.2. Products
- 14.1.10.3. Company Financials
- 14.1.10.4. SWOT Analysis
- 14.1.11 METHANEX CORPORATION
- 14.1.11.1. Company Overview
- 14.1.11.2. Products
- 14.1.11.3. Company Financials
- 14.1.11.4. SWOT Analysis
- 14.1.12 MITSUBISHI HEAVY INDUSTRIES LTD
- 14.1.12.1. Company Overview
- 14.1.12.2. Products
- 14.1.12.3. Company Financials
- 14.1.12.4. SWOT Analysis
- 14.1.13 Air Liquide
- 14.1.13.1. Company Overview
- 14.1.13.2. Products
- 14.1.13.3. Company Financials
- 14.1.13.4. SWOT Analysis
- 14.1.14 BP p l c
- 14.1.14.1. Company Overview
- 14.1.14.2. Products
- 14.1.14.3. Company Financials
- 14.1.14.4. SWOT Analysis
- 14.1.15 TechnipFMC plc*List Not Exhaustive
- 14.1.15.1. Company Overview
- 14.1.15.2. Products
- 14.1.15.3. Company Financials
- 14.1.15.4. SWOT Analysis
- 14.1.1 Haldor Topsoe A/S
- 14.2. Market Entropy
- 14.2.1 Company's Key Areas Served
- 14.2.2 Recent Developments
- 14.3. Company Market Share Analysis 2025
- 14.3.1 Top 5 Companies Market Share Analysis
- 14.3.2 Top 3 Companies Market Share Analysis
- 14.4. List of Potential Customers
- 15. Research Methodology
List of Figures
- Figure 1: Global SEA Syngas Industry Revenue Breakdown (Million, %) by Region 2025 & 2033
- Figure 2: Global SEA Syngas Industry Volume Breakdown (K Tons, %) by Region 2025 & 2033
- Figure 3: Indonesia SEA Syngas Industry Revenue (Million), by Feedstock 2025 & 2033
- Figure 4: Indonesia SEA Syngas Industry Volume (K Tons), by Feedstock 2025 & 2033
- Figure 5: Indonesia SEA Syngas Industry Revenue Share (%), by Feedstock 2025 & 2033
- Figure 6: Indonesia SEA Syngas Industry Volume Share (%), by Feedstock 2025 & 2033
- Figure 7: Indonesia SEA Syngas Industry Revenue (Million), by Technology 2025 & 2033
- Figure 8: Indonesia SEA Syngas Industry Volume (K Tons), by Technology 2025 & 2033
- Figure 9: Indonesia SEA Syngas Industry Revenue Share (%), by Technology 2025 & 2033
- Figure 10: Indonesia SEA Syngas Industry Volume Share (%), by Technology 2025 & 2033
- Figure 11: Indonesia SEA Syngas Industry Revenue (Million), by Gasifier Type 2025 & 2033
- Figure 12: Indonesia SEA Syngas Industry Volume (K Tons), by Gasifier Type 2025 & 2033
- Figure 13: Indonesia SEA Syngas Industry Revenue Share (%), by Gasifier Type 2025 & 2033
- Figure 14: Indonesia SEA Syngas Industry Volume Share (%), by Gasifier Type 2025 & 2033
- Figure 15: Indonesia SEA Syngas Industry Revenue (Million), by Application 2025 & 2033
- Figure 16: Indonesia SEA Syngas Industry Volume (K Tons), by Application 2025 & 2033
- Figure 17: Indonesia SEA Syngas Industry Revenue Share (%), by Application 2025 & 2033
- Figure 18: Indonesia SEA Syngas Industry Volume Share (%), by Application 2025 & 2033
- Figure 19: Indonesia SEA Syngas Industry Revenue (Million), by Geography 2025 & 2033
- Figure 20: Indonesia SEA Syngas Industry Volume (K Tons), by Geography 2025 & 2033
- Figure 21: Indonesia SEA Syngas Industry Revenue Share (%), by Geography 2025 & 2033
- Figure 22: Indonesia SEA Syngas Industry Volume Share (%), by Geography 2025 & 2033
- Figure 23: Indonesia SEA Syngas Industry Revenue (Million), by Country 2025 & 2033
- Figure 24: Indonesia SEA Syngas Industry Volume (K Tons), by Country 2025 & 2033
- Figure 25: Indonesia SEA Syngas Industry Revenue Share (%), by Country 2025 & 2033
- Figure 26: Indonesia SEA Syngas Industry Volume Share (%), by Country 2025 & 2033
- Figure 27: Thailand SEA Syngas Industry Revenue (Million), by Feedstock 2025 & 2033
- Figure 28: Thailand SEA Syngas Industry Volume (K Tons), by Feedstock 2025 & 2033
- Figure 29: Thailand SEA Syngas Industry Revenue Share (%), by Feedstock 2025 & 2033
- Figure 30: Thailand SEA Syngas Industry Volume Share (%), by Feedstock 2025 & 2033
- Figure 31: Thailand SEA Syngas Industry Revenue (Million), by Technology 2025 & 2033
- Figure 32: Thailand SEA Syngas Industry Volume (K Tons), by Technology 2025 & 2033
- Figure 33: Thailand SEA Syngas Industry Revenue Share (%), by Technology 2025 & 2033
- Figure 34: Thailand SEA Syngas Industry Volume Share (%), by Technology 2025 & 2033
- Figure 35: Thailand SEA Syngas Industry Revenue (Million), by Gasifier Type 2025 & 2033
- Figure 36: Thailand SEA Syngas Industry Volume (K Tons), by Gasifier Type 2025 & 2033
- Figure 37: Thailand SEA Syngas Industry Revenue Share (%), by Gasifier Type 2025 & 2033
- Figure 38: Thailand SEA Syngas Industry Volume Share (%), by Gasifier Type 2025 & 2033
- Figure 39: Thailand SEA Syngas Industry Revenue (Million), by Application 2025 & 2033
- Figure 40: Thailand SEA Syngas Industry Volume (K Tons), by Application 2025 & 2033
- Figure 41: Thailand SEA Syngas Industry Revenue Share (%), by Application 2025 & 2033
- Figure 42: Thailand SEA Syngas Industry Volume Share (%), by Application 2025 & 2033
- Figure 43: Thailand SEA Syngas Industry Revenue (Million), by Geography 2025 & 2033
- Figure 44: Thailand SEA Syngas Industry Volume (K Tons), by Geography 2025 & 2033
- Figure 45: Thailand SEA Syngas Industry Revenue Share (%), by Geography 2025 & 2033
- Figure 46: Thailand SEA Syngas Industry Volume Share (%), by Geography 2025 & 2033
- Figure 47: Thailand SEA Syngas Industry Revenue (Million), by Country 2025 & 2033
- Figure 48: Thailand SEA Syngas Industry Volume (K Tons), by Country 2025 & 2033
- Figure 49: Thailand SEA Syngas Industry Revenue Share (%), by Country 2025 & 2033
- Figure 50: Thailand SEA Syngas Industry Volume Share (%), by Country 2025 & 2033
- Figure 51: Malaysia SEA Syngas Industry Revenue (Million), by Feedstock 2025 & 2033
- Figure 52: Malaysia SEA Syngas Industry Volume (K Tons), by Feedstock 2025 & 2033
- Figure 53: Malaysia SEA Syngas Industry Revenue Share (%), by Feedstock 2025 & 2033
- Figure 54: Malaysia SEA Syngas Industry Volume Share (%), by Feedstock 2025 & 2033
- Figure 55: Malaysia SEA Syngas Industry Revenue (Million), by Technology 2025 & 2033
- Figure 56: Malaysia SEA Syngas Industry Volume (K Tons), by Technology 2025 & 2033
- Figure 57: Malaysia SEA Syngas Industry Revenue Share (%), by Technology 2025 & 2033
- Figure 58: Malaysia SEA Syngas Industry Volume Share (%), by Technology 2025 & 2033
- Figure 59: Malaysia SEA Syngas Industry Revenue (Million), by Gasifier Type 2025 & 2033
- Figure 60: Malaysia SEA Syngas Industry Volume (K Tons), by Gasifier Type 2025 & 2033
- Figure 61: Malaysia SEA Syngas Industry Revenue Share (%), by Gasifier Type 2025 & 2033
- Figure 62: Malaysia SEA Syngas Industry Volume Share (%), by Gasifier Type 2025 & 2033
- Figure 63: Malaysia SEA Syngas Industry Revenue (Million), by Application 2025 & 2033
- Figure 64: Malaysia SEA Syngas Industry Volume (K Tons), by Application 2025 & 2033
- Figure 65: Malaysia SEA Syngas Industry Revenue Share (%), by Application 2025 & 2033
- Figure 66: Malaysia SEA Syngas Industry Volume Share (%), by Application 2025 & 2033
- Figure 67: Malaysia SEA Syngas Industry Revenue (Million), by Geography 2025 & 2033
- Figure 68: Malaysia SEA Syngas Industry Volume (K Tons), by Geography 2025 & 2033
- Figure 69: Malaysia SEA Syngas Industry Revenue Share (%), by Geography 2025 & 2033
- Figure 70: Malaysia SEA Syngas Industry Volume Share (%), by Geography 2025 & 2033
- Figure 71: Malaysia SEA Syngas Industry Revenue (Million), by Country 2025 & 2033
- Figure 72: Malaysia SEA Syngas Industry Volume (K Tons), by Country 2025 & 2033
- Figure 73: Malaysia SEA Syngas Industry Revenue Share (%), by Country 2025 & 2033
- Figure 74: Malaysia SEA Syngas Industry Volume Share (%), by Country 2025 & 2033
- Figure 75: Singapore SEA Syngas Industry Revenue (Million), by Feedstock 2025 & 2033
- Figure 76: Singapore SEA Syngas Industry Volume (K Tons), by Feedstock 2025 & 2033
- Figure 77: Singapore SEA Syngas Industry Revenue Share (%), by Feedstock 2025 & 2033
- Figure 78: Singapore SEA Syngas Industry Volume Share (%), by Feedstock 2025 & 2033
- Figure 79: Singapore SEA Syngas Industry Revenue (Million), by Technology 2025 & 2033
- Figure 80: Singapore SEA Syngas Industry Volume (K Tons), by Technology 2025 & 2033
- Figure 81: Singapore SEA Syngas Industry Revenue Share (%), by Technology 2025 & 2033
- Figure 82: Singapore SEA Syngas Industry Volume Share (%), by Technology 2025 & 2033
- Figure 83: Singapore SEA Syngas Industry Revenue (Million), by Gasifier Type 2025 & 2033
- Figure 84: Singapore SEA Syngas Industry Volume (K Tons), by Gasifier Type 2025 & 2033
- Figure 85: Singapore SEA Syngas Industry Revenue Share (%), by Gasifier Type 2025 & 2033
- Figure 86: Singapore SEA Syngas Industry Volume Share (%), by Gasifier Type 2025 & 2033
- Figure 87: Singapore SEA Syngas Industry Revenue (Million), by Application 2025 & 2033
- Figure 88: Singapore SEA Syngas Industry Volume (K Tons), by Application 2025 & 2033
- Figure 89: Singapore SEA Syngas Industry Revenue Share (%), by Application 2025 & 2033
- Figure 90: Singapore SEA Syngas Industry Volume Share (%), by Application 2025 & 2033
- Figure 91: Singapore SEA Syngas Industry Revenue (Million), by Geography 2025 & 2033
- Figure 92: Singapore SEA Syngas Industry Volume (K Tons), by Geography 2025 & 2033
- Figure 93: Singapore SEA Syngas Industry Revenue Share (%), by Geography 2025 & 2033
- Figure 94: Singapore SEA Syngas Industry Volume Share (%), by Geography 2025 & 2033
- Figure 95: Singapore SEA Syngas Industry Revenue (Million), by Country 2025 & 2033
- Figure 96: Singapore SEA Syngas Industry Volume (K Tons), by Country 2025 & 2033
- Figure 97: Singapore SEA Syngas Industry Revenue Share (%), by Country 2025 & 2033
- Figure 98: Singapore SEA Syngas Industry Volume Share (%), by Country 2025 & 2033
- Figure 99: Philippines SEA Syngas Industry Revenue (Million), by Feedstock 2025 & 2033
- Figure 100: Philippines SEA Syngas Industry Volume (K Tons), by Feedstock 2025 & 2033
- Figure 101: Philippines SEA Syngas Industry Revenue Share (%), by Feedstock 2025 & 2033
- Figure 102: Philippines SEA Syngas Industry Volume Share (%), by Feedstock 2025 & 2033
- Figure 103: Philippines SEA Syngas Industry Revenue (Million), by Technology 2025 & 2033
- Figure 104: Philippines SEA Syngas Industry Volume (K Tons), by Technology 2025 & 2033
- Figure 105: Philippines SEA Syngas Industry Revenue Share (%), by Technology 2025 & 2033
- Figure 106: Philippines SEA Syngas Industry Volume Share (%), by Technology 2025 & 2033
- Figure 107: Philippines SEA Syngas Industry Revenue (Million), by Gasifier Type 2025 & 2033
- Figure 108: Philippines SEA Syngas Industry Volume (K Tons), by Gasifier Type 2025 & 2033
- Figure 109: Philippines SEA Syngas Industry Revenue Share (%), by Gasifier Type 2025 & 2033
- Figure 110: Philippines SEA Syngas Industry Volume Share (%), by Gasifier Type 2025 & 2033
- Figure 111: Philippines SEA Syngas Industry Revenue (Million), by Application 2025 & 2033
- Figure 112: Philippines SEA Syngas Industry Volume (K Tons), by Application 2025 & 2033
- Figure 113: Philippines SEA Syngas Industry Revenue Share (%), by Application 2025 & 2033
- Figure 114: Philippines SEA Syngas Industry Volume Share (%), by Application 2025 & 2033
- Figure 115: Philippines SEA Syngas Industry Revenue (Million), by Geography 2025 & 2033
- Figure 116: Philippines SEA Syngas Industry Volume (K Tons), by Geography 2025 & 2033
- Figure 117: Philippines SEA Syngas Industry Revenue Share (%), by Geography 2025 & 2033
- Figure 118: Philippines SEA Syngas Industry Volume Share (%), by Geography 2025 & 2033
- Figure 119: Philippines SEA Syngas Industry Revenue (Million), by Country 2025 & 2033
- Figure 120: Philippines SEA Syngas Industry Volume (K Tons), by Country 2025 & 2033
- Figure 121: Philippines SEA Syngas Industry Revenue Share (%), by Country 2025 & 2033
- Figure 122: Philippines SEA Syngas Industry Volume Share (%), by Country 2025 & 2033
- Figure 123: Vietnam SEA Syngas Industry Revenue (Million), by Feedstock 2025 & 2033
- Figure 124: Vietnam SEA Syngas Industry Volume (K Tons), by Feedstock 2025 & 2033
- Figure 125: Vietnam SEA Syngas Industry Revenue Share (%), by Feedstock 2025 & 2033
- Figure 126: Vietnam SEA Syngas Industry Volume Share (%), by Feedstock 2025 & 2033
- Figure 127: Vietnam SEA Syngas Industry Revenue (Million), by Technology 2025 & 2033
- Figure 128: Vietnam SEA Syngas Industry Volume (K Tons), by Technology 2025 & 2033
- Figure 129: Vietnam SEA Syngas Industry Revenue Share (%), by Technology 2025 & 2033
- Figure 130: Vietnam SEA Syngas Industry Volume Share (%), by Technology 2025 & 2033
- Figure 131: Vietnam SEA Syngas Industry Revenue (Million), by Gasifier Type 2025 & 2033
- Figure 132: Vietnam SEA Syngas Industry Volume (K Tons), by Gasifier Type 2025 & 2033
- Figure 133: Vietnam SEA Syngas Industry Revenue Share (%), by Gasifier Type 2025 & 2033
- Figure 134: Vietnam SEA Syngas Industry Volume Share (%), by Gasifier Type 2025 & 2033
- Figure 135: Vietnam SEA Syngas Industry Revenue (Million), by Application 2025 & 2033
- Figure 136: Vietnam SEA Syngas Industry Volume (K Tons), by Application 2025 & 2033
- Figure 137: Vietnam SEA Syngas Industry Revenue Share (%), by Application 2025 & 2033
- Figure 138: Vietnam SEA Syngas Industry Volume Share (%), by Application 2025 & 2033
- Figure 139: Vietnam SEA Syngas Industry Revenue (Million), by Geography 2025 & 2033
- Figure 140: Vietnam SEA Syngas Industry Volume (K Tons), by Geography 2025 & 2033
- Figure 141: Vietnam SEA Syngas Industry Revenue Share (%), by Geography 2025 & 2033
- Figure 142: Vietnam SEA Syngas Industry Volume Share (%), by Geography 2025 & 2033
- Figure 143: Vietnam SEA Syngas Industry Revenue (Million), by Country 2025 & 2033
- Figure 144: Vietnam SEA Syngas Industry Volume (K Tons), by Country 2025 & 2033
- Figure 145: Vietnam SEA Syngas Industry Revenue Share (%), by Country 2025 & 2033
- Figure 146: Vietnam SEA Syngas Industry Volume Share (%), by Country 2025 & 2033
- Figure 147: Rest of South East Asia SEA Syngas Industry Revenue (Million), by Feedstock 2025 & 2033
- Figure 148: Rest of South East Asia SEA Syngas Industry Volume (K Tons), by Feedstock 2025 & 2033
- Figure 149: Rest of South East Asia SEA Syngas Industry Revenue Share (%), by Feedstock 2025 & 2033
- Figure 150: Rest of South East Asia SEA Syngas Industry Volume Share (%), by Feedstock 2025 & 2033
- Figure 151: Rest of South East Asia SEA Syngas Industry Revenue (Million), by Technology 2025 & 2033
- Figure 152: Rest of South East Asia SEA Syngas Industry Volume (K Tons), by Technology 2025 & 2033
- Figure 153: Rest of South East Asia SEA Syngas Industry Revenue Share (%), by Technology 2025 & 2033
- Figure 154: Rest of South East Asia SEA Syngas Industry Volume Share (%), by Technology 2025 & 2033
- Figure 155: Rest of South East Asia SEA Syngas Industry Revenue (Million), by Gasifier Type 2025 & 2033
- Figure 156: Rest of South East Asia SEA Syngas Industry Volume (K Tons), by Gasifier Type 2025 & 2033
- Figure 157: Rest of South East Asia SEA Syngas Industry Revenue Share (%), by Gasifier Type 2025 & 2033
- Figure 158: Rest of South East Asia SEA Syngas Industry Volume Share (%), by Gasifier Type 2025 & 2033
- Figure 159: Rest of South East Asia SEA Syngas Industry Revenue (Million), by Application 2025 & 2033
- Figure 160: Rest of South East Asia SEA Syngas Industry Volume (K Tons), by Application 2025 & 2033
- Figure 161: Rest of South East Asia SEA Syngas Industry Revenue Share (%), by Application 2025 & 2033
- Figure 162: Rest of South East Asia SEA Syngas Industry Volume Share (%), by Application 2025 & 2033
- Figure 163: Rest of South East Asia SEA Syngas Industry Revenue (Million), by Geography 2025 & 2033
- Figure 164: Rest of South East Asia SEA Syngas Industry Volume (K Tons), by Geography 2025 & 2033
- Figure 165: Rest of South East Asia SEA Syngas Industry Revenue Share (%), by Geography 2025 & 2033
- Figure 166: Rest of South East Asia SEA Syngas Industry Volume Share (%), by Geography 2025 & 2033
- Figure 167: Rest of South East Asia SEA Syngas Industry Revenue (Million), by Country 2025 & 2033
- Figure 168: Rest of South East Asia SEA Syngas Industry Volume (K Tons), by Country 2025 & 2033
- Figure 169: Rest of South East Asia SEA Syngas Industry Revenue Share (%), by Country 2025 & 2033
- Figure 170: Rest of South East Asia SEA Syngas Industry Volume Share (%), by Country 2025 & 2033
List of Tables
- Table 1: Global SEA Syngas Industry Revenue Million Forecast, by Feedstock 2020 & 2033
- Table 2: Global SEA Syngas Industry Volume K Tons Forecast, by Feedstock 2020 & 2033
- Table 3: Global SEA Syngas Industry Revenue Million Forecast, by Technology 2020 & 2033
- Table 4: Global SEA Syngas Industry Volume K Tons Forecast, by Technology 2020 & 2033
- Table 5: Global SEA Syngas Industry Revenue Million Forecast, by Gasifier Type 2020 & 2033
- Table 6: Global SEA Syngas Industry Volume K Tons Forecast, by Gasifier Type 2020 & 2033
- Table 7: Global SEA Syngas Industry Revenue Million Forecast, by Application 2020 & 2033
- Table 8: Global SEA Syngas Industry Volume K Tons Forecast, by Application 2020 & 2033
- Table 9: Global SEA Syngas Industry Revenue Million Forecast, by Geography 2020 & 2033
- Table 10: Global SEA Syngas Industry Volume K Tons Forecast, by Geography 2020 & 2033
- Table 11: Global SEA Syngas Industry Revenue Million Forecast, by Region 2020 & 2033
- Table 12: Global SEA Syngas Industry Volume K Tons Forecast, by Region 2020 & 2033
- Table 13: Global SEA Syngas Industry Revenue Million Forecast, by Feedstock 2020 & 2033
- Table 14: Global SEA Syngas Industry Volume K Tons Forecast, by Feedstock 2020 & 2033
- Table 15: Global SEA Syngas Industry Revenue Million Forecast, by Technology 2020 & 2033
- Table 16: Global SEA Syngas Industry Volume K Tons Forecast, by Technology 2020 & 2033
- Table 17: Global SEA Syngas Industry Revenue Million Forecast, by Gasifier Type 2020 & 2033
- Table 18: Global SEA Syngas Industry Volume K Tons Forecast, by Gasifier Type 2020 & 2033
- Table 19: Global SEA Syngas Industry Revenue Million Forecast, by Application 2020 & 2033
- Table 20: Global SEA Syngas Industry Volume K Tons Forecast, by Application 2020 & 2033
- Table 21: Global SEA Syngas Industry Revenue Million Forecast, by Geography 2020 & 2033
- Table 22: Global SEA Syngas Industry Volume K Tons Forecast, by Geography 2020 & 2033
- Table 23: Global SEA Syngas Industry Revenue Million Forecast, by Country 2020 & 2033
- Table 24: Global SEA Syngas Industry Volume K Tons Forecast, by Country 2020 & 2033
- Table 25: Global SEA Syngas Industry Revenue Million Forecast, by Feedstock 2020 & 2033
- Table 26: Global SEA Syngas Industry Volume K Tons Forecast, by Feedstock 2020 & 2033
- Table 27: Global SEA Syngas Industry Revenue Million Forecast, by Technology 2020 & 2033
- Table 28: Global SEA Syngas Industry Volume K Tons Forecast, by Technology 2020 & 2033
- Table 29: Global SEA Syngas Industry Revenue Million Forecast, by Gasifier Type 2020 & 2033
- Table 30: Global SEA Syngas Industry Volume K Tons Forecast, by Gasifier Type 2020 & 2033
- Table 31: Global SEA Syngas Industry Revenue Million Forecast, by Application 2020 & 2033
- Table 32: Global SEA Syngas Industry Volume K Tons Forecast, by Application 2020 & 2033
- Table 33: Global SEA Syngas Industry Revenue Million Forecast, by Geography 2020 & 2033
- Table 34: Global SEA Syngas Industry Volume K Tons Forecast, by Geography 2020 & 2033
- Table 35: Global SEA Syngas Industry Revenue Million Forecast, by Country 2020 & 2033
- Table 36: Global SEA Syngas Industry Volume K Tons Forecast, by Country 2020 & 2033
- Table 37: Global SEA Syngas Industry Revenue Million Forecast, by Feedstock 2020 & 2033
- Table 38: Global SEA Syngas Industry Volume K Tons Forecast, by Feedstock 2020 & 2033
- Table 39: Global SEA Syngas Industry Revenue Million Forecast, by Technology 2020 & 2033
- Table 40: Global SEA Syngas Industry Volume K Tons Forecast, by Technology 2020 & 2033
- Table 41: Global SEA Syngas Industry Revenue Million Forecast, by Gasifier Type 2020 & 2033
- Table 42: Global SEA Syngas Industry Volume K Tons Forecast, by Gasifier Type 2020 & 2033
- Table 43: Global SEA Syngas Industry Revenue Million Forecast, by Application 2020 & 2033
- Table 44: Global SEA Syngas Industry Volume K Tons Forecast, by Application 2020 & 2033
- Table 45: Global SEA Syngas Industry Revenue Million Forecast, by Geography 2020 & 2033
- Table 46: Global SEA Syngas Industry Volume K Tons Forecast, by Geography 2020 & 2033
- Table 47: Global SEA Syngas Industry Revenue Million Forecast, by Country 2020 & 2033
- Table 48: Global SEA Syngas Industry Volume K Tons Forecast, by Country 2020 & 2033
- Table 49: Global SEA Syngas Industry Revenue Million Forecast, by Feedstock 2020 & 2033
- Table 50: Global SEA Syngas Industry Volume K Tons Forecast, by Feedstock 2020 & 2033
- Table 51: Global SEA Syngas Industry Revenue Million Forecast, by Technology 2020 & 2033
- Table 52: Global SEA Syngas Industry Volume K Tons Forecast, by Technology 2020 & 2033
- Table 53: Global SEA Syngas Industry Revenue Million Forecast, by Gasifier Type 2020 & 2033
- Table 54: Global SEA Syngas Industry Volume K Tons Forecast, by Gasifier Type 2020 & 2033
- Table 55: Global SEA Syngas Industry Revenue Million Forecast, by Application 2020 & 2033
- Table 56: Global SEA Syngas Industry Volume K Tons Forecast, by Application 2020 & 2033
- Table 57: Global SEA Syngas Industry Revenue Million Forecast, by Geography 2020 & 2033
- Table 58: Global SEA Syngas Industry Volume K Tons Forecast, by Geography 2020 & 2033
- Table 59: Global SEA Syngas Industry Revenue Million Forecast, by Country 2020 & 2033
- Table 60: Global SEA Syngas Industry Volume K Tons Forecast, by Country 2020 & 2033
- Table 61: Global SEA Syngas Industry Revenue Million Forecast, by Feedstock 2020 & 2033
- Table 62: Global SEA Syngas Industry Volume K Tons Forecast, by Feedstock 2020 & 2033
- Table 63: Global SEA Syngas Industry Revenue Million Forecast, by Technology 2020 & 2033
- Table 64: Global SEA Syngas Industry Volume K Tons Forecast, by Technology 2020 & 2033
- Table 65: Global SEA Syngas Industry Revenue Million Forecast, by Gasifier Type 2020 & 2033
- Table 66: Global SEA Syngas Industry Volume K Tons Forecast, by Gasifier Type 2020 & 2033
- Table 67: Global SEA Syngas Industry Revenue Million Forecast, by Application 2020 & 2033
- Table 68: Global SEA Syngas Industry Volume K Tons Forecast, by Application 2020 & 2033
- Table 69: Global SEA Syngas Industry Revenue Million Forecast, by Geography 2020 & 2033
- Table 70: Global SEA Syngas Industry Volume K Tons Forecast, by Geography 2020 & 2033
- Table 71: Global SEA Syngas Industry Revenue Million Forecast, by Country 2020 & 2033
- Table 72: Global SEA Syngas Industry Volume K Tons Forecast, by Country 2020 & 2033
- Table 73: Global SEA Syngas Industry Revenue Million Forecast, by Feedstock 2020 & 2033
- Table 74: Global SEA Syngas Industry Volume K Tons Forecast, by Feedstock 2020 & 2033
- Table 75: Global SEA Syngas Industry Revenue Million Forecast, by Technology 2020 & 2033
- Table 76: Global SEA Syngas Industry Volume K Tons Forecast, by Technology 2020 & 2033
- Table 77: Global SEA Syngas Industry Revenue Million Forecast, by Gasifier Type 2020 & 2033
- Table 78: Global SEA Syngas Industry Volume K Tons Forecast, by Gasifier Type 2020 & 2033
- Table 79: Global SEA Syngas Industry Revenue Million Forecast, by Application 2020 & 2033
- Table 80: Global SEA Syngas Industry Volume K Tons Forecast, by Application 2020 & 2033
- Table 81: Global SEA Syngas Industry Revenue Million Forecast, by Geography 2020 & 2033
- Table 82: Global SEA Syngas Industry Volume K Tons Forecast, by Geography 2020 & 2033
- Table 83: Global SEA Syngas Industry Revenue Million Forecast, by Country 2020 & 2033
- Table 84: Global SEA Syngas Industry Volume K Tons Forecast, by Country 2020 & 2033
- Table 85: Global SEA Syngas Industry Revenue Million Forecast, by Feedstock 2020 & 2033
- Table 86: Global SEA Syngas Industry Volume K Tons Forecast, by Feedstock 2020 & 2033
- Table 87: Global SEA Syngas Industry Revenue Million Forecast, by Technology 2020 & 2033
- Table 88: Global SEA Syngas Industry Volume K Tons Forecast, by Technology 2020 & 2033
- Table 89: Global SEA Syngas Industry Revenue Million Forecast, by Gasifier Type 2020 & 2033
- Table 90: Global SEA Syngas Industry Volume K Tons Forecast, by Gasifier Type 2020 & 2033
- Table 91: Global SEA Syngas Industry Revenue Million Forecast, by Application 2020 & 2033
- Table 92: Global SEA Syngas Industry Volume K Tons Forecast, by Application 2020 & 2033
- Table 93: Global SEA Syngas Industry Revenue Million Forecast, by Geography 2020 & 2033
- Table 94: Global SEA Syngas Industry Volume K Tons Forecast, by Geography 2020 & 2033
- Table 95: Global SEA Syngas Industry Revenue Million Forecast, by Country 2020 & 2033
- Table 96: Global SEA Syngas Industry Volume K Tons Forecast, by Country 2020 & 2033
Frequently Asked Questions
1. What is the projected Compound Annual Growth Rate (CAGR) of the SEA Syngas Industry?
The projected CAGR is approximately > 9.00%.
2. Which companies are prominent players in the SEA Syngas Industry?
Key companies in the market include Haldor Topsoe A/S, General Electric, Air Products and Chemicals Inc, Royal Dutch Shell plc, Siemens, KBR Inc, BASF SE, DuPont, Linde plc, SynGas Technology LLC, METHANEX CORPORATION, MITSUBISHI HEAVY INDUSTRIES LTD, Air Liquide, BP p l c, TechnipFMC plc*List Not Exhaustive.
3. What are the main segments of the SEA Syngas Industry?
The market segments include Feedstock, Technology, Gasifier Type, Application, Geography.
4. Can you provide details about the market size?
The market size is estimated to be USD 230.05 Million as of 2022.
5. What are some drivers contributing to market growth?
; Growing Demand for Electricity; Growing Chemical Industry.
6. What are the notable trends driving market growth?
Increasing Usage in Power Generation Industry.
7. Are there any restraints impacting market growth?
; High Capital Investment and Funding.
8. Can you provide examples of recent developments in the market?
Construction of new syngas production plants
9. What pricing options are available for accessing the report?
Pricing options include single-user, multi-user, and enterprise licenses priced at USD 4750, USD 5250, and USD 8750 respectively.
10. Is the market size provided in terms of value or volume?
The market size is provided in terms of value, measured in Million and volume, measured in K Tons.
11. Are there any specific market keywords associated with the report?
Yes, the market keyword associated with the report is "SEA Syngas Industry," which aids in identifying and referencing the specific market segment covered.
12. How do I determine which pricing option suits my needs best?
The pricing options vary based on user requirements and access needs. Individual users may opt for single-user licenses, while businesses requiring broader access may choose multi-user or enterprise licenses for cost-effective access to the report.
13. Are there any additional resources or data provided in the SEA Syngas Industry report?
While the report offers comprehensive insights, it's advisable to review the specific contents or supplementary materials provided to ascertain if additional resources or data are available.
14. How can I stay updated on further developments or reports in the SEA Syngas Industry?
To stay informed about further developments, trends, and reports in the SEA Syngas Industry, consider subscribing to industry newsletters, following relevant companies and organizations, or regularly checking reputable industry news sources and publications.
Methodology
Step 1 - Identification of Relevant Samples Size from Population Database


Step 2 - Approaches for Defining Global Market Size (Value, Volume* & Price*)

Note*: In applicable scenarios
Step 3 - Data Sources
Primary Research
- Web Analytics
- Survey Reports
- Research Institute
- Latest Research Reports
- Opinion Leaders
Secondary Research
- Annual Reports
- White Paper
- Latest Press Release
- Industry Association
- Paid Database
- Investor Presentations

Step 4 - Data Triangulation
Involves using different sources of information in order to increase the validity of a study
These sources are likely to be stakeholders in a program - participants, other researchers, program staff, other community members, and so on.
Then we put all data in single framework & apply various statistical tools to find out the dynamic on the market.
During the analysis stage, feedback from the stakeholder groups would be compared to determine areas of agreement as well as areas of divergence