

Key Insights
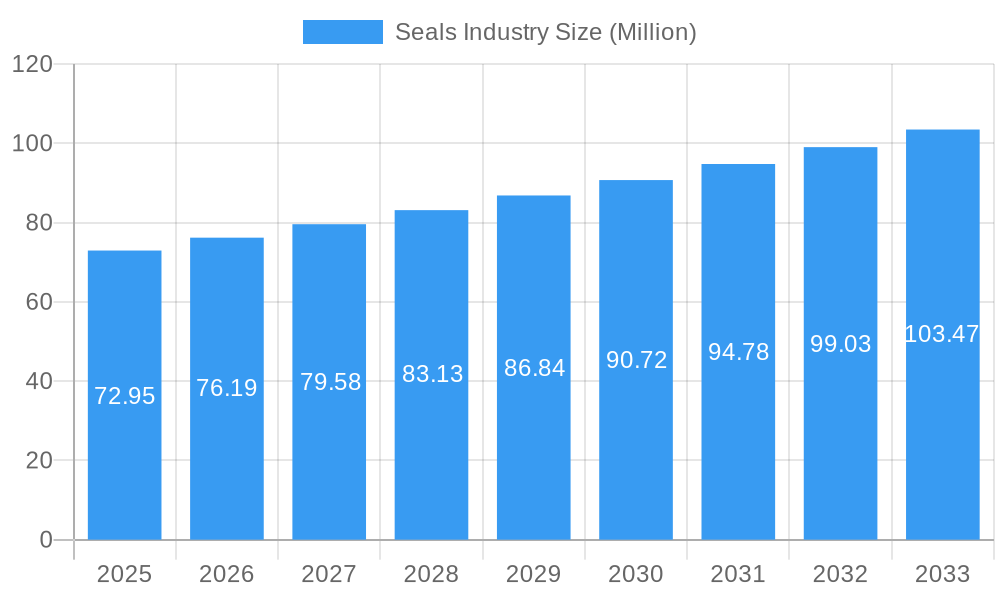
The global seals industry, valued at $72.95 million in 2025, is projected to experience robust growth, exhibiting a Compound Annual Growth Rate (CAGR) exceeding 4.00% from 2025 to 2033. This expansion is fueled by several key drivers. The burgeoning automotive sector, particularly the increasing demand for electric vehicles and advanced driver-assistance systems (ADAS), significantly contributes to market growth. Furthermore, the oil and gas industry's ongoing exploration and production activities, coupled with the need for improved sealing solutions to prevent leaks and enhance safety, bolster demand. Growth is also driven by increasing industrial automation across various sectors, demanding high-performance sealing solutions for improved efficiency and longevity of machinery. Technological advancements in seal materials, such as the development of high-performance polymers and composites, offer improved durability, chemical resistance, and operating temperature ranges, further stimulating market growth. The increasing adoption of sustainable practices and the demand for environmentally friendly seal materials, like non-asbestos gaskets, are also shaping the industry's trajectory. However, the market faces challenges such as fluctuating raw material prices and potential supply chain disruptions, which could impact production costs and overall market growth.
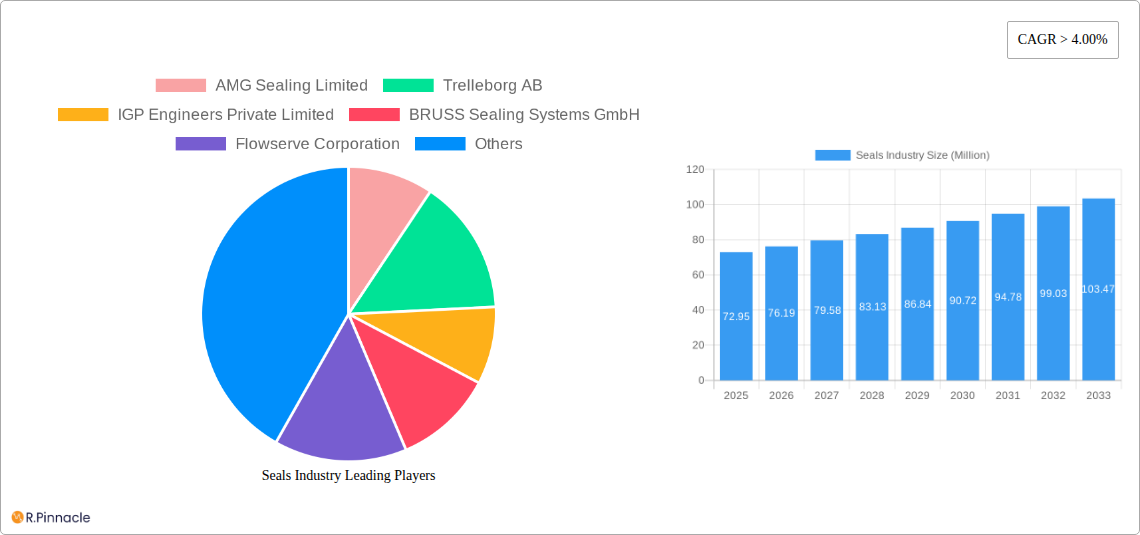
Seals Industry Market Size (In Million)
Segmentation analysis reveals a diverse market landscape. Product-wise, shaft seals, molded seals, and metallic gaskets dominate, driven by their wide applicability across various sectors. Material-wise, rubber, PTFE, and graphite are leading materials due to their versatility and performance characteristics. Geographically, Asia Pacific, driven by strong manufacturing bases in China and India, represents a significant market share, followed by North America and Europe. Competitive analysis indicates a fragmented market landscape with several established players (e.g., Trelleborg AB, Freudenberg Sealing Technologies, SKF) alongside regional and specialized companies. These companies are focused on technological innovation, strategic partnerships, and expansion into new markets to maintain a competitive edge. Future growth will depend on effectively addressing industry challenges while capitalizing on emerging technological opportunities and increasing global industrialization.
Seals Industry Company Market Share
Seals Industry Market Report: 2019-2033
This comprehensive report provides an in-depth analysis of the global Seals Industry, offering invaluable insights for industry professionals, investors, and strategic decision-makers. The report covers the period 2019-2033, with a focus on the forecast period 2025-2033 and a base year of 2025. The market is segmented by product (gaskets and seals), material, and application, providing a granular understanding of market dynamics and growth potential. The total market size is projected to reach xx Million by 2033.
Seals Industry Market Structure & Innovation Trends
This section analyzes the competitive landscape of the Seals Industry, encompassing market concentration, innovation drivers, regulatory frameworks, and M&A activities. The market is characterized by a combination of large multinational corporations and specialized smaller players.
Market Concentration: The Seals Industry exhibits a moderately concentrated structure, with a few dominant players holding significant market share. For example, Trelleborg AB and Freudenberg Sealing Technologies command a substantial portion of the global market. Smaller players, such as IGP Engineers Private Limited, focus on niche segments and regional markets. The combined market share of the top 5 players is estimated to be around 40% in 2025.
Innovation Drivers: Technological advancements in materials science, manufacturing processes, and design are key drivers of innovation. The development of high-performance materials like PTFE and advanced sealing technologies is transforming the industry. The demand for sustainable and environmentally friendly sealants is also driving innovation.
Regulatory Frameworks: Stringent environmental regulations, particularly concerning the use of hazardous materials, are shaping the industry landscape. Compliance with these regulations requires continuous innovation and investment in environmentally conscious materials and processes.
Product Substitutes: The market faces competition from alternative sealing technologies, such as adhesive sealants and advanced welding techniques. However, the inherent advantages of mechanical seals, such as durability and reliability, ensure their continued dominance in specific applications.
End-User Demographics: The automotive, aerospace, and oil & gas sectors are major end-users of seals. The growth in these industries drives market demand.
M&A Activities: The Seals Industry has witnessed significant M&A activity in recent years, driven by a desire for consolidation, technological access, and geographic expansion. Estimated M&A deal values over the past five years total approximately xx Million.
Seals Industry Market Dynamics & Trends
This section delves into the key market dynamics and trends shaping the Seals Industry's growth trajectory. The market is projected to experience a Compound Annual Growth Rate (CAGR) of xx% during the forecast period (2025-2033).
This growth is fueled by several factors, including the increasing demand from key end-use industries (automotive, oil & gas, aerospace), technological advancements leading to improved seal performance and longevity, and the rising adoption of advanced materials. Competitive dynamics are influenced by factors such as pricing pressures, technological innovation, and strategic partnerships. Consumer preferences are shifting towards higher-performance, environmentally friendly, and cost-effective sealing solutions. Market penetration of advanced seal materials like PTFE and specialized gasket types is expected to increase significantly over the next decade, driven by stringent performance requirements in various sectors. The industry is facing challenges related to fluctuating raw material prices and the need for continuous improvement in manufacturing efficiency to maintain profitability.
Dominant Regions & Segments in Seals Industry
This section identifies the leading regions, countries, and segments within the Seals Industry.
Leading Regions: The North American and European markets currently dominate the Seals Industry. However, Asia-Pacific is projected to experience significant growth, driven by rapid industrialization and infrastructural development in countries like China and India.
Leading Segments: The automotive and oil & gas sectors are the dominant application segments, driven by the large-scale usage of seals in vehicles and industrial equipment. Within product types, gaskets (particularly metallic and rubber gaskets) and shaft seals represent the largest market segments. Rubber and PTFE are dominant material segments due to their versatility and performance characteristics.
Key Drivers:
- Automotive: Growth in vehicle production and stricter emission regulations.
- Oil & Gas: Expansion of oil & gas exploration and production activities.
- Aerospace: Increased demand for high-performance seals in aircraft and spacecraft.
- Economic policies: Government investments in infrastructure and industrial development.
- Infrastructure: Expansion of transportation networks, energy infrastructure, and industrial facilities.
The dominance of these regions and segments is primarily attributed to the high level of industrial activity, established manufacturing base, and the presence of major end-users.
Seals Industry Product Innovations
Recent product innovations have focused on developing high-performance seals with improved durability, reliability, and environmental friendliness. This includes advancements in material science leading to seals with enhanced temperature and pressure resistance, as well as the introduction of innovative designs and manufacturing processes that improve seal performance and reduce manufacturing costs. This trend aligns with the growing demand for sustainable and environmentally friendly sealing solutions.
Report Scope & Segmentation Analysis
This report provides a comprehensive analysis of the Seals Industry, segmented by product type (gaskets and seals), material type (fiber, graphite, PTFE, rubber, other materials), and application (aerospace, automotive, electronics, oil & gas, power generation, and other applications). Growth projections, market sizes, and competitive dynamics are detailed for each segment. For instance, the Rubber Gasket segment is projected to maintain a steady CAGR, while the PTFE segment is expected to experience higher growth due to its superior properties.
Key Drivers of Seals Industry Growth
The Seals Industry's growth is driven by several key factors: the increasing demand for high-performance seals in various sectors (automotive, aerospace, oil & gas), advancements in materials science leading to improved seal performance, and the growing need for environmentally friendly sealing solutions. Stringent environmental regulations and the rising adoption of advanced manufacturing techniques also contribute to industry growth.
Challenges in the Seals Industry Sector
The Seals Industry faces challenges such as fluctuating raw material prices, intense competition, and stringent environmental regulations. These factors impact profitability and necessitate continuous innovation and investment in efficient manufacturing processes and sustainable materials. Supply chain disruptions can also significantly affect production and delivery timelines.
Emerging Opportunities in Seals Industry
Emerging opportunities include the development of advanced seal materials with enhanced performance characteristics, the expansion into new and high-growth markets (such as renewable energy and medical devices), and the increasing adoption of sustainable and eco-friendly sealants.
Leading Players in the Seals Industry Market
- AMG Sealing Limited
- Trelleborg AB
- IGP Engineers Private Limited
- BRUSS Sealing Systems GmbH
- Flowserve Corporation
- Dechengwang
- Tenneco Inc
- Phelps
- SKF
- Dana Limited
- Smiths Group plc
- Cooper Standard
- Freudenberg Sealing Technologies
- Dätwyler Holding Inc
- ElringKlinger AG
- John Crane
- Garlock an Enpro Industries Inc
- Saunders
- KLINGER Holding GmbH
(List Not Exhaustive)
Key Developments in Seals Industry Industry
- 2022-Q4: Freudenberg Sealing Technologies launched a new line of sustainable sealants.
- 2023-Q1: Trelleborg AB acquired a smaller competitor, expanding its market share.
- 2023-Q3: Several key players announced price increases due to rising raw material costs.
Future Outlook for Seals Industry Market
The future outlook for the Seals Industry is positive, driven by continued growth in key end-use sectors and the ongoing development of innovative sealing technologies. Strategic opportunities lie in expanding into high-growth markets, focusing on sustainable product development, and leveraging advanced manufacturing techniques to enhance efficiency and reduce costs. The industry's future growth will be largely influenced by technological advancements, economic conditions, and regulatory developments.
Seals Industry Segmentation
-
1. Product
-
1.1. Gaskets
- 1.1.1. Metallic Gasket
- 1.1.2. Rubber Gasket
- 1.1.3. Cork Gasket
- 1.1.4. Non-asbestos Gasket
- 1.1.5. Spiral Wound Gasket
- 1.1.6. Other Gaskets (Semi-Metallic Gasket)
-
1.2. Seals
- 1.2.1. Shaft Seals
- 1.2.2. Molded Seals
- 1.2.3. Motor Vehicle Body Seals
- 1.2.4. Other Seals (Fork Seal and Piston Seal)
-
1.1. Gaskets
-
2. Material
- 2.1. Fiber
- 2.2. Graphite
- 2.3. PTFE
- 2.4. Rubber
- 2.5. Other Materials (Metal, Cork, Polymers and Felt)
-
3. Application
- 3.1. Aerospace
- 3.2. Automotive
- 3.3. Electronics
- 3.4. Oil and Gas
- 3.5. Power Generation
- 3.6. Other Applications (Industrial)
Seals Industry Segmentation By Geography
-
1. Asia Pacific
- 1.1. China
- 1.2. India
- 1.3. Japan
- 1.4. South Korea
- 1.5. Rest of Asia Pacific
-
2. North America
- 2.1. United States
- 2.2. Canada
- 2.3. Mexico
-
3. Europe
- 3.1. Germany
- 3.2. United Kingdom
- 3.3. France
- 3.4. Italy
- 3.5. Rest of Europe
-
4. South America
- 4.1. Brazil
- 4.2. Argentina
- 4.3. Rest of South America
-
5. Middle East and Africa
- 5.1. Saudi Arabia
- 5.2. South Africa
- 5.3. Rest of Middle East and Africa
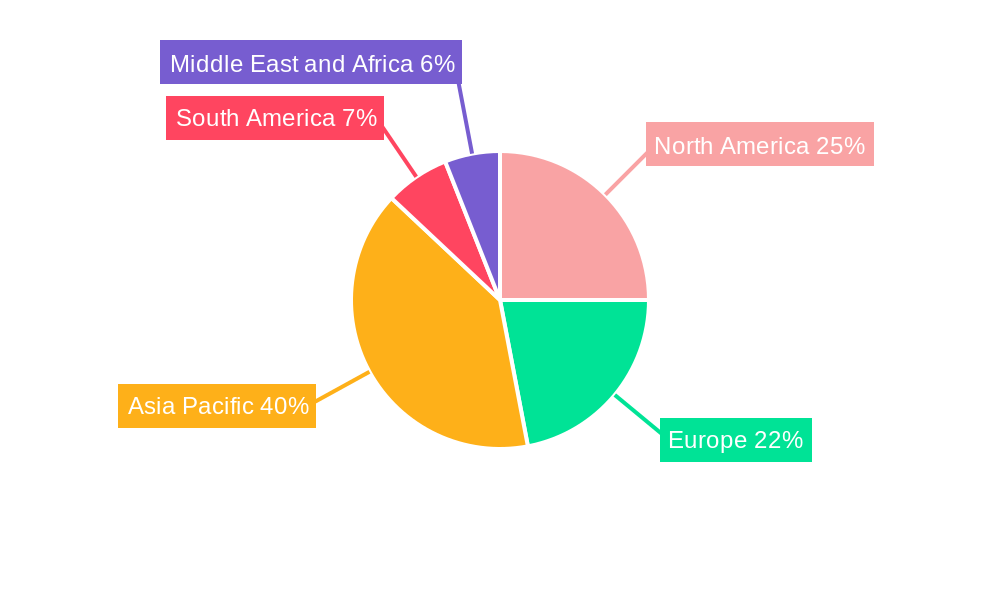
Seals Industry Regional Market Share
Geographic Coverage of Seals Industry
Seals Industry REPORT HIGHLIGHTS
| Aspects | Details |
|---|---|
| Study Period | 2020-2034 |
| Base Year | 2025 |
| Estimated Year | 2026 |
| Forecast Period | 2026-2034 |
| Historical Period | 2020-2025 |
| Growth Rate | CAGR of > 4.00% from 2020-2034 |
| Segmentation |
|
Table of Contents
- 1. Introduction
- 1.1. Research Scope
- 1.2. Market Segmentation
- 1.3. Research Objective
- 1.4. Definitions and Assumptions
- 2. Executive Summary
- 2.1. Market Snapshot
- 3. Market Dynamics
- 3.1. Market Drivers
- 3.2. Market Restrains
- 3.3. Market Trends
- 3.4. Market Opportunities
- 4. Market Factor Analysis
- 4.1. Porters Five Forces
- 4.1.1. Bargaining Power of Suppliers
- 4.1.2. Bargaining Power of Buyers
- 4.1.3. Threat of New Entrants
- 4.1.4. Threat of Substitutes
- 4.1.5. Competitive Rivalry
- 4.2. PESTEL analysis
- 4.3. BCG Analysis
- 4.3.1. Stars (High Growth, High Market Share)
- 4.3.2. Cash Cows (Low Growth, High Market Share)
- 4.3.3. Question Mark (High Growth, Low Market Share)
- 4.3.4. Dogs (Low Growth, Low Market Share)
- 4.4. Ansoff Matrix Analysis
- 4.5. Supply Chain Analysis
- 4.6. Regulatory Landscape
- 4.7. Current Market Potential and Opportunity Assessment (TAM–SAM–SOM Framework)
- 4.8. PRI Analyst Note
- 4.1. Porters Five Forces
- 5. Market Analysis, Insights and Forecast 2021-2033
- 5.1. Market Analysis, Insights and Forecast - by Product
- 5.1.1. Gaskets
- 5.1.1.1. Metallic Gasket
- 5.1.1.2. Rubber Gasket
- 5.1.1.3. Cork Gasket
- 5.1.1.4. Non-asbestos Gasket
- 5.1.1.5. Spiral Wound Gasket
- 5.1.1.6. Other Gaskets (Semi-Metallic Gasket)
- 5.1.2. Seals
- 5.1.2.1. Shaft Seals
- 5.1.2.2. Molded Seals
- 5.1.2.3. Motor Vehicle Body Seals
- 5.1.2.4. Other Seals (Fork Seal and Piston Seal)
- 5.1.1. Gaskets
- 5.2. Market Analysis, Insights and Forecast - by Material
- 5.2.1. Fiber
- 5.2.2. Graphite
- 5.2.3. PTFE
- 5.2.4. Rubber
- 5.2.5. Other Materials (Metal, Cork, Polymers and Felt)
- 5.3. Market Analysis, Insights and Forecast - by Application
- 5.3.1. Aerospace
- 5.3.2. Automotive
- 5.3.3. Electronics
- 5.3.4. Oil and Gas
- 5.3.5. Power Generation
- 5.3.6. Other Applications (Industrial)
- 5.4. Market Analysis, Insights and Forecast - by Region
- 5.4.1. Asia Pacific
- 5.4.2. North America
- 5.4.3. Europe
- 5.4.4. South America
- 5.4.5. Middle East and Africa
- 5.1. Market Analysis, Insights and Forecast - by Product
- 6. Global Seals Industry Analysis, Insights and Forecast, 2021-2033
- 6.1. Market Analysis, Insights and Forecast - by Product
- 6.1.1. Gaskets
- 6.1.1.1. Metallic Gasket
- 6.1.1.2. Rubber Gasket
- 6.1.1.3. Cork Gasket
- 6.1.1.4. Non-asbestos Gasket
- 6.1.1.5. Spiral Wound Gasket
- 6.1.1.6. Other Gaskets (Semi-Metallic Gasket)
- 6.1.2. Seals
- 6.1.2.1. Shaft Seals
- 6.1.2.2. Molded Seals
- 6.1.2.3. Motor Vehicle Body Seals
- 6.1.2.4. Other Seals (Fork Seal and Piston Seal)
- 6.1.1. Gaskets
- 6.2. Market Analysis, Insights and Forecast - by Material
- 6.2.1. Fiber
- 6.2.2. Graphite
- 6.2.3. PTFE
- 6.2.4. Rubber
- 6.2.5. Other Materials (Metal, Cork, Polymers and Felt)
- 6.3. Market Analysis, Insights and Forecast - by Application
- 6.3.1. Aerospace
- 6.3.2. Automotive
- 6.3.3. Electronics
- 6.3.4. Oil and Gas
- 6.3.5. Power Generation
- 6.3.6. Other Applications (Industrial)
- 6.1. Market Analysis, Insights and Forecast - by Product
- 7. Asia Pacific Seals Industry Analysis, Insights and Forecast, 2020-2032
- 7.1. Market Analysis, Insights and Forecast - by Product
- 7.1.1. Gaskets
- 7.1.1.1. Metallic Gasket
- 7.1.1.2. Rubber Gasket
- 7.1.1.3. Cork Gasket
- 7.1.1.4. Non-asbestos Gasket
- 7.1.1.5. Spiral Wound Gasket
- 7.1.1.6. Other Gaskets (Semi-Metallic Gasket)
- 7.1.2. Seals
- 7.1.2.1. Shaft Seals
- 7.1.2.2. Molded Seals
- 7.1.2.3. Motor Vehicle Body Seals
- 7.1.2.4. Other Seals (Fork Seal and Piston Seal)
- 7.1.1. Gaskets
- 7.2. Market Analysis, Insights and Forecast - by Material
- 7.2.1. Fiber
- 7.2.2. Graphite
- 7.2.3. PTFE
- 7.2.4. Rubber
- 7.2.5. Other Materials (Metal, Cork, Polymers and Felt)
- 7.3. Market Analysis, Insights and Forecast - by Application
- 7.3.1. Aerospace
- 7.3.2. Automotive
- 7.3.3. Electronics
- 7.3.4. Oil and Gas
- 7.3.5. Power Generation
- 7.3.6. Other Applications (Industrial)
- 7.1. Market Analysis, Insights and Forecast - by Product
- 8. North America Seals Industry Analysis, Insights and Forecast, 2020-2032
- 8.1. Market Analysis, Insights and Forecast - by Product
- 8.1.1. Gaskets
- 8.1.1.1. Metallic Gasket
- 8.1.1.2. Rubber Gasket
- 8.1.1.3. Cork Gasket
- 8.1.1.4. Non-asbestos Gasket
- 8.1.1.5. Spiral Wound Gasket
- 8.1.1.6. Other Gaskets (Semi-Metallic Gasket)
- 8.1.2. Seals
- 8.1.2.1. Shaft Seals
- 8.1.2.2. Molded Seals
- 8.1.2.3. Motor Vehicle Body Seals
- 8.1.2.4. Other Seals (Fork Seal and Piston Seal)
- 8.1.1. Gaskets
- 8.2. Market Analysis, Insights and Forecast - by Material
- 8.2.1. Fiber
- 8.2.2. Graphite
- 8.2.3. PTFE
- 8.2.4. Rubber
- 8.2.5. Other Materials (Metal, Cork, Polymers and Felt)
- 8.3. Market Analysis, Insights and Forecast - by Application
- 8.3.1. Aerospace
- 8.3.2. Automotive
- 8.3.3. Electronics
- 8.3.4. Oil and Gas
- 8.3.5. Power Generation
- 8.3.6. Other Applications (Industrial)
- 8.1. Market Analysis, Insights and Forecast - by Product
- 9. Europe Seals Industry Analysis, Insights and Forecast, 2020-2032
- 9.1. Market Analysis, Insights and Forecast - by Product
- 9.1.1. Gaskets
- 9.1.1.1. Metallic Gasket
- 9.1.1.2. Rubber Gasket
- 9.1.1.3. Cork Gasket
- 9.1.1.4. Non-asbestos Gasket
- 9.1.1.5. Spiral Wound Gasket
- 9.1.1.6. Other Gaskets (Semi-Metallic Gasket)
- 9.1.2. Seals
- 9.1.2.1. Shaft Seals
- 9.1.2.2. Molded Seals
- 9.1.2.3. Motor Vehicle Body Seals
- 9.1.2.4. Other Seals (Fork Seal and Piston Seal)
- 9.1.1. Gaskets
- 9.2. Market Analysis, Insights and Forecast - by Material
- 9.2.1. Fiber
- 9.2.2. Graphite
- 9.2.3. PTFE
- 9.2.4. Rubber
- 9.2.5. Other Materials (Metal, Cork, Polymers and Felt)
- 9.3. Market Analysis, Insights and Forecast - by Application
- 9.3.1. Aerospace
- 9.3.2. Automotive
- 9.3.3. Electronics
- 9.3.4. Oil and Gas
- 9.3.5. Power Generation
- 9.3.6. Other Applications (Industrial)
- 9.1. Market Analysis, Insights and Forecast - by Product
- 10. South America Seals Industry Analysis, Insights and Forecast, 2020-2032
- 10.1. Market Analysis, Insights and Forecast - by Product
- 10.1.1. Gaskets
- 10.1.1.1. Metallic Gasket
- 10.1.1.2. Rubber Gasket
- 10.1.1.3. Cork Gasket
- 10.1.1.4. Non-asbestos Gasket
- 10.1.1.5. Spiral Wound Gasket
- 10.1.1.6. Other Gaskets (Semi-Metallic Gasket)
- 10.1.2. Seals
- 10.1.2.1. Shaft Seals
- 10.1.2.2. Molded Seals
- 10.1.2.3. Motor Vehicle Body Seals
- 10.1.2.4. Other Seals (Fork Seal and Piston Seal)
- 10.1.1. Gaskets
- 10.2. Market Analysis, Insights and Forecast - by Material
- 10.2.1. Fiber
- 10.2.2. Graphite
- 10.2.3. PTFE
- 10.2.4. Rubber
- 10.2.5. Other Materials (Metal, Cork, Polymers and Felt)
- 10.3. Market Analysis, Insights and Forecast - by Application
- 10.3.1. Aerospace
- 10.3.2. Automotive
- 10.3.3. Electronics
- 10.3.4. Oil and Gas
- 10.3.5. Power Generation
- 10.3.6. Other Applications (Industrial)
- 10.1. Market Analysis, Insights and Forecast - by Product
- 11. Middle East and Africa Seals Industry Analysis, Insights and Forecast, 2020-2032
- 11.1. Market Analysis, Insights and Forecast - by Product
- 11.1.1. Gaskets
- 11.1.1.1. Metallic Gasket
- 11.1.1.2. Rubber Gasket
- 11.1.1.3. Cork Gasket
- 11.1.1.4. Non-asbestos Gasket
- 11.1.1.5. Spiral Wound Gasket
- 11.1.1.6. Other Gaskets (Semi-Metallic Gasket)
- 11.1.2. Seals
- 11.1.2.1. Shaft Seals
- 11.1.2.2. Molded Seals
- 11.1.2.3. Motor Vehicle Body Seals
- 11.1.2.4. Other Seals (Fork Seal and Piston Seal)
- 11.1.1. Gaskets
- 11.2. Market Analysis, Insights and Forecast - by Material
- 11.2.1. Fiber
- 11.2.2. Graphite
- 11.2.3. PTFE
- 11.2.4. Rubber
- 11.2.5. Other Materials (Metal, Cork, Polymers and Felt)
- 11.3. Market Analysis, Insights and Forecast - by Application
- 11.3.1. Aerospace
- 11.3.2. Automotive
- 11.3.3. Electronics
- 11.3.4. Oil and Gas
- 11.3.5. Power Generation
- 11.3.6. Other Applications (Industrial)
- 11.1. Market Analysis, Insights and Forecast - by Product
- 12. Competitive Analysis
- 12.1. Company Profiles
- 12.1.1 AMG Sealing Limited
- 12.1.1.1. Company Overview
- 12.1.1.2. Products
- 12.1.1.3. Company Financials
- 12.1.1.4. SWOT Analysis
- 12.1.2 Trelleborg AB
- 12.1.2.1. Company Overview
- 12.1.2.2. Products
- 12.1.2.3. Company Financials
- 12.1.2.4. SWOT Analysis
- 12.1.3 IGP Engineers Private Limited
- 12.1.3.1. Company Overview
- 12.1.3.2. Products
- 12.1.3.3. Company Financials
- 12.1.3.4. SWOT Analysis
- 12.1.4 BRUSS Sealing Systems GmbH
- 12.1.4.1. Company Overview
- 12.1.4.2. Products
- 12.1.4.3. Company Financials
- 12.1.4.4. SWOT Analysis
- 12.1.5 Flowserve Corporation
- 12.1.5.1. Company Overview
- 12.1.5.2. Products
- 12.1.5.3. Company Financials
- 12.1.5.4. SWOT Analysis
- 12.1.6 Dechengwang
- 12.1.6.1. Company Overview
- 12.1.6.2. Products
- 12.1.6.3. Company Financials
- 12.1.6.4. SWOT Analysis
- 12.1.7 Tenneco Inc *List Not Exhaustive
- 12.1.7.1. Company Overview
- 12.1.7.2. Products
- 12.1.7.3. Company Financials
- 12.1.7.4. SWOT Analysis
- 12.1.8 Phelps
- 12.1.8.1. Company Overview
- 12.1.8.2. Products
- 12.1.8.3. Company Financials
- 12.1.8.4. SWOT Analysis
- 12.1.9 SKF
- 12.1.9.1. Company Overview
- 12.1.9.2. Products
- 12.1.9.3. Company Financials
- 12.1.9.4. SWOT Analysis
- 12.1.10 Dana Limited
- 12.1.10.1. Company Overview
- 12.1.10.2. Products
- 12.1.10.3. Company Financials
- 12.1.10.4. SWOT Analysis
- 12.1.11 Smiths Group plc
- 12.1.11.1. Company Overview
- 12.1.11.2. Products
- 12.1.11.3. Company Financials
- 12.1.11.4. SWOT Analysis
- 12.1.12 Cooper Standard
- 12.1.12.1. Company Overview
- 12.1.12.2. Products
- 12.1.12.3. Company Financials
- 12.1.12.4. SWOT Analysis
- 12.1.13 Freudenberg Sealing Technologies
- 12.1.13.1. Company Overview
- 12.1.13.2. Products
- 12.1.13.3. Company Financials
- 12.1.13.4. SWOT Analysis
- 12.1.14 Dätwyler Holding Inc
- 12.1.14.1. Company Overview
- 12.1.14.2. Products
- 12.1.14.3. Company Financials
- 12.1.14.4. SWOT Analysis
- 12.1.15 ElringKlinger AG
- 12.1.15.1. Company Overview
- 12.1.15.2. Products
- 12.1.15.3. Company Financials
- 12.1.15.4. SWOT Analysis
- 12.1.16 John Crane
- 12.1.16.1. Company Overview
- 12.1.16.2. Products
- 12.1.16.3. Company Financials
- 12.1.16.4. SWOT Analysis
- 12.1.17 Garlock an Enpro Industries Inc
- 12.1.17.1. Company Overview
- 12.1.17.2. Products
- 12.1.17.3. Company Financials
- 12.1.17.4. SWOT Analysis
- 12.1.18 Saunders
- 12.1.18.1. Company Overview
- 12.1.18.2. Products
- 12.1.18.3. Company Financials
- 12.1.18.4. SWOT Analysis
- 12.1.19 KLINGER Holding GmbH
- 12.1.19.1. Company Overview
- 12.1.19.2. Products
- 12.1.19.3. Company Financials
- 12.1.19.4. SWOT Analysis
- 12.1.1 AMG Sealing Limited
- 12.2. Market Entropy
- 12.2.1 Company's Key Areas Served
- 12.2.2 Recent Developments
- 12.3. Company Market Share Analysis 2025
- 12.3.1 Top 5 Companies Market Share Analysis
- 12.3.2 Top 3 Companies Market Share Analysis
- 12.4. List of Potential Customers
- 13. Research Methodology
List of Figures
- Figure 1: Global Seals Industry Revenue Breakdown (Million, %) by Region 2025 & 2033
- Figure 2: Asia Pacific Seals Industry Revenue (Million), by Product 2025 & 2033
- Figure 3: Asia Pacific Seals Industry Revenue Share (%), by Product 2025 & 2033
- Figure 4: Asia Pacific Seals Industry Revenue (Million), by Material 2025 & 2033
- Figure 5: Asia Pacific Seals Industry Revenue Share (%), by Material 2025 & 2033
- Figure 6: Asia Pacific Seals Industry Revenue (Million), by Application 2025 & 2033
- Figure 7: Asia Pacific Seals Industry Revenue Share (%), by Application 2025 & 2033
- Figure 8: Asia Pacific Seals Industry Revenue (Million), by Country 2025 & 2033
- Figure 9: Asia Pacific Seals Industry Revenue Share (%), by Country 2025 & 2033
- Figure 10: North America Seals Industry Revenue (Million), by Product 2025 & 2033
- Figure 11: North America Seals Industry Revenue Share (%), by Product 2025 & 2033
- Figure 12: North America Seals Industry Revenue (Million), by Material 2025 & 2033
- Figure 13: North America Seals Industry Revenue Share (%), by Material 2025 & 2033
- Figure 14: North America Seals Industry Revenue (Million), by Application 2025 & 2033
- Figure 15: North America Seals Industry Revenue Share (%), by Application 2025 & 2033
- Figure 16: North America Seals Industry Revenue (Million), by Country 2025 & 2033
- Figure 17: North America Seals Industry Revenue Share (%), by Country 2025 & 2033
- Figure 18: Europe Seals Industry Revenue (Million), by Product 2025 & 2033
- Figure 19: Europe Seals Industry Revenue Share (%), by Product 2025 & 2033
- Figure 20: Europe Seals Industry Revenue (Million), by Material 2025 & 2033
- Figure 21: Europe Seals Industry Revenue Share (%), by Material 2025 & 2033
- Figure 22: Europe Seals Industry Revenue (Million), by Application 2025 & 2033
- Figure 23: Europe Seals Industry Revenue Share (%), by Application 2025 & 2033
- Figure 24: Europe Seals Industry Revenue (Million), by Country 2025 & 2033
- Figure 25: Europe Seals Industry Revenue Share (%), by Country 2025 & 2033
- Figure 26: South America Seals Industry Revenue (Million), by Product 2025 & 2033
- Figure 27: South America Seals Industry Revenue Share (%), by Product 2025 & 2033
- Figure 28: South America Seals Industry Revenue (Million), by Material 2025 & 2033
- Figure 29: South America Seals Industry Revenue Share (%), by Material 2025 & 2033
- Figure 30: South America Seals Industry Revenue (Million), by Application 2025 & 2033
- Figure 31: South America Seals Industry Revenue Share (%), by Application 2025 & 2033
- Figure 32: South America Seals Industry Revenue (Million), by Country 2025 & 2033
- Figure 33: South America Seals Industry Revenue Share (%), by Country 2025 & 2033
- Figure 34: Middle East and Africa Seals Industry Revenue (Million), by Product 2025 & 2033
- Figure 35: Middle East and Africa Seals Industry Revenue Share (%), by Product 2025 & 2033
- Figure 36: Middle East and Africa Seals Industry Revenue (Million), by Material 2025 & 2033
- Figure 37: Middle East and Africa Seals Industry Revenue Share (%), by Material 2025 & 2033
- Figure 38: Middle East and Africa Seals Industry Revenue (Million), by Application 2025 & 2033
- Figure 39: Middle East and Africa Seals Industry Revenue Share (%), by Application 2025 & 2033
- Figure 40: Middle East and Africa Seals Industry Revenue (Million), by Country 2025 & 2033
- Figure 41: Middle East and Africa Seals Industry Revenue Share (%), by Country 2025 & 2033
List of Tables
- Table 1: Global Seals Industry Revenue Million Forecast, by Product 2020 & 2033
- Table 2: Global Seals Industry Revenue Million Forecast, by Material 2020 & 2033
- Table 3: Global Seals Industry Revenue Million Forecast, by Application 2020 & 2033
- Table 4: Global Seals Industry Revenue Million Forecast, by Region 2020 & 2033
- Table 5: Global Seals Industry Revenue Million Forecast, by Product 2020 & 2033
- Table 6: Global Seals Industry Revenue Million Forecast, by Material 2020 & 2033
- Table 7: Global Seals Industry Revenue Million Forecast, by Application 2020 & 2033
- Table 8: Global Seals Industry Revenue Million Forecast, by Country 2020 & 2033
- Table 9: China Seals Industry Revenue (Million) Forecast, by Application 2020 & 2033
- Table 10: India Seals Industry Revenue (Million) Forecast, by Application 2020 & 2033
- Table 11: Japan Seals Industry Revenue (Million) Forecast, by Application 2020 & 2033
- Table 12: South Korea Seals Industry Revenue (Million) Forecast, by Application 2020 & 2033
- Table 13: Rest of Asia Pacific Seals Industry Revenue (Million) Forecast, by Application 2020 & 2033
- Table 14: Global Seals Industry Revenue Million Forecast, by Product 2020 & 2033
- Table 15: Global Seals Industry Revenue Million Forecast, by Material 2020 & 2033
- Table 16: Global Seals Industry Revenue Million Forecast, by Application 2020 & 2033
- Table 17: Global Seals Industry Revenue Million Forecast, by Country 2020 & 2033
- Table 18: United States Seals Industry Revenue (Million) Forecast, by Application 2020 & 2033
- Table 19: Canada Seals Industry Revenue (Million) Forecast, by Application 2020 & 2033
- Table 20: Mexico Seals Industry Revenue (Million) Forecast, by Application 2020 & 2033
- Table 21: Global Seals Industry Revenue Million Forecast, by Product 2020 & 2033
- Table 22: Global Seals Industry Revenue Million Forecast, by Material 2020 & 2033
- Table 23: Global Seals Industry Revenue Million Forecast, by Application 2020 & 2033
- Table 24: Global Seals Industry Revenue Million Forecast, by Country 2020 & 2033
- Table 25: Germany Seals Industry Revenue (Million) Forecast, by Application 2020 & 2033
- Table 26: United Kingdom Seals Industry Revenue (Million) Forecast, by Application 2020 & 2033
- Table 27: France Seals Industry Revenue (Million) Forecast, by Application 2020 & 2033
- Table 28: Italy Seals Industry Revenue (Million) Forecast, by Application 2020 & 2033
- Table 29: Rest of Europe Seals Industry Revenue (Million) Forecast, by Application 2020 & 2033
- Table 30: Global Seals Industry Revenue Million Forecast, by Product 2020 & 2033
- Table 31: Global Seals Industry Revenue Million Forecast, by Material 2020 & 2033
- Table 32: Global Seals Industry Revenue Million Forecast, by Application 2020 & 2033
- Table 33: Global Seals Industry Revenue Million Forecast, by Country 2020 & 2033
- Table 34: Brazil Seals Industry Revenue (Million) Forecast, by Application 2020 & 2033
- Table 35: Argentina Seals Industry Revenue (Million) Forecast, by Application 2020 & 2033
- Table 36: Rest of South America Seals Industry Revenue (Million) Forecast, by Application 2020 & 2033
- Table 37: Global Seals Industry Revenue Million Forecast, by Product 2020 & 2033
- Table 38: Global Seals Industry Revenue Million Forecast, by Material 2020 & 2033
- Table 39: Global Seals Industry Revenue Million Forecast, by Application 2020 & 2033
- Table 40: Global Seals Industry Revenue Million Forecast, by Country 2020 & 2033
- Table 41: Saudi Arabia Seals Industry Revenue (Million) Forecast, by Application 2020 & 2033
- Table 42: South Africa Seals Industry Revenue (Million) Forecast, by Application 2020 & 2033
- Table 43: Rest of Middle East and Africa Seals Industry Revenue (Million) Forecast, by Application 2020 & 2033
Frequently Asked Questions
1. What is the projected Compound Annual Growth Rate (CAGR) of the Seals Industry?
The projected CAGR is approximately > 4.00%.
2. Which companies are prominent players in the Seals Industry?
Key companies in the market include AMG Sealing Limited, Trelleborg AB, IGP Engineers Private Limited, BRUSS Sealing Systems GmbH, Flowserve Corporation, Dechengwang, Tenneco Inc *List Not Exhaustive, Phelps, SKF, Dana Limited, Smiths Group plc, Cooper Standard, Freudenberg Sealing Technologies, Dätwyler Holding Inc, ElringKlinger AG, John Crane, Garlock an Enpro Industries Inc, Saunders, KLINGER Holding GmbH.
3. What are the main segments of the Seals Industry?
The market segments include Product, Material, Application.
4. Can you provide details about the market size?
The market size is estimated to be USD 72.95 Million as of 2022.
5. What are some drivers contributing to market growth?
Increase in the Use of Gaskets and Seals in the Oil and Gas Industry; Growing Demand from the Chemical and Petrochemical Sectors; Increasing Demand from the Automotive Industry.
6. What are the notable trends driving market growth?
The Oil and Gas Application is Expected to Dominate the Market.
7. Are there any restraints impacting market growth?
Regular Maintenance and Lubrication; Price Volatility of Raw Materials.
8. Can you provide examples of recent developments in the market?
N/A
9. What pricing options are available for accessing the report?
Pricing options include single-user, multi-user, and enterprise licenses priced at USD 4750, USD 5250, and USD 8750 respectively.
10. Is the market size provided in terms of value or volume?
The market size is provided in terms of value, measured in Million.
11. Are there any specific market keywords associated with the report?
Yes, the market keyword associated with the report is "Seals Industry," which aids in identifying and referencing the specific market segment covered.
12. How do I determine which pricing option suits my needs best?
The pricing options vary based on user requirements and access needs. Individual users may opt for single-user licenses, while businesses requiring broader access may choose multi-user or enterprise licenses for cost-effective access to the report.
13. Are there any additional resources or data provided in the Seals Industry report?
While the report offers comprehensive insights, it's advisable to review the specific contents or supplementary materials provided to ascertain if additional resources or data are available.
14. How can I stay updated on further developments or reports in the Seals Industry?
To stay informed about further developments, trends, and reports in the Seals Industry, consider subscribing to industry newsletters, following relevant companies and organizations, or regularly checking reputable industry news sources and publications.
Methodology
Step 1 - Identification of Relevant Samples Size from Population Database


Step 2 - Approaches for Defining Global Market Size (Value, Volume* & Price*)

Note*: In applicable scenarios
Step 3 - Data Sources
Primary Research
- Web Analytics
- Survey Reports
- Research Institute
- Latest Research Reports
- Opinion Leaders
Secondary Research
- Annual Reports
- White Paper
- Latest Press Release
- Industry Association
- Paid Database
- Investor Presentations

Step 4 - Data Triangulation
Involves using different sources of information in order to increase the validity of a study
These sources are likely to be stakeholders in a program - participants, other researchers, program staff, other community members, and so on.
Then we put all data in single framework & apply various statistical tools to find out the dynamic on the market.
During the analysis stage, feedback from the stakeholder groups would be compared to determine areas of agreement as well as areas of divergence