

Key Insights
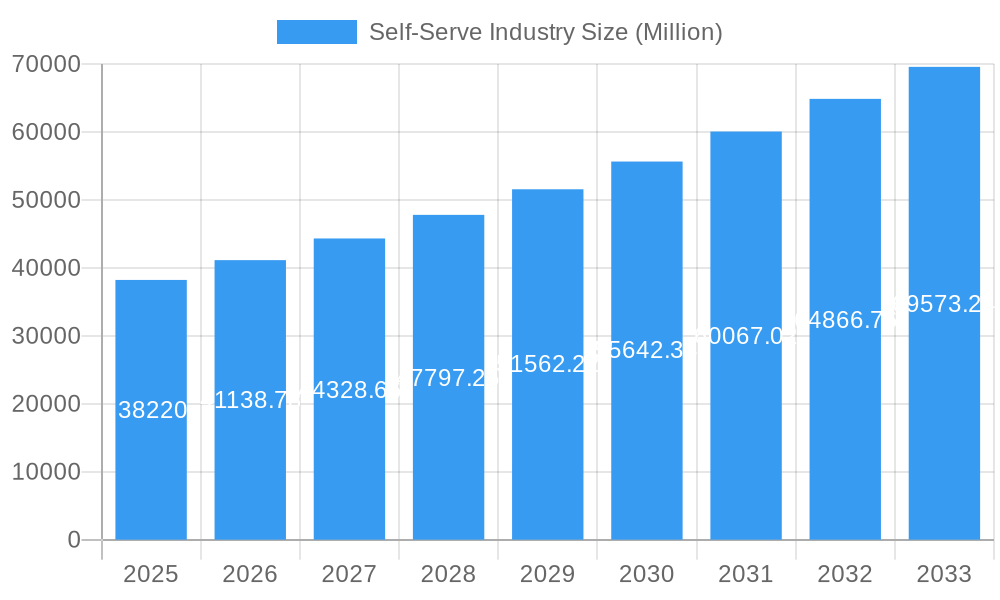
The self-service industry, encompassing kiosks, ATMs, vending machines, and more, is experiencing robust growth, projected to reach a market size of $38.22 billion in 2025 and maintain a Compound Annual Growth Rate (CAGR) of 7.79% from 2025 to 2033. This expansion is fueled by several key drivers. The increasing adoption of digital technologies across various sectors, including BFSI (Banking, Financial Services, and Insurance), retail, hospitality, and healthcare, is significantly boosting demand for self-service solutions. Consumers are increasingly seeking convenient and efficient services, leading to wider acceptance of automated options. Furthermore, labor cost optimization and the need for 24/7 service availability are incentivizing businesses to integrate self-service technologies into their operations. The market is segmented by type (kiosk, ATM, vending machine) and end-user (BFSI, retail, hospitality, healthcare, travel & transportation, others). While the BFSI sector currently dominates, significant growth is anticipated in retail and fast-food chains due to the rising popularity of contactless transactions and mobile ordering. Technological advancements, including AI-powered functionalities and enhanced user interfaces, further contribute to market expansion.
Self-Serve Industry Market Size (In Billion)
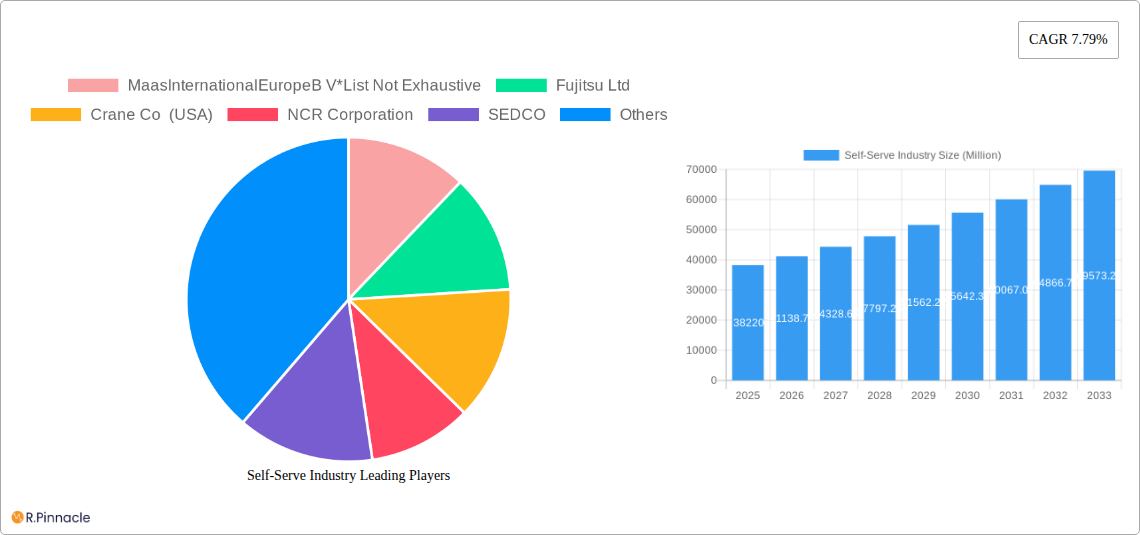
However, certain restraints exist. Initial investment costs for implementing self-service technologies can be substantial, potentially deterring smaller businesses. Security concerns regarding data breaches and system malfunctions remain a challenge. Furthermore, ensuring seamless user experience and addressing technical issues promptly are crucial for maintaining customer satisfaction and encouraging widespread adoption. Despite these limitations, the overall market outlook remains positive, with substantial growth potential driven by ongoing technological innovation and the evolving needs of consumers and businesses. Major players like NCR Corporation, Diebold Nixdorf, and Fujitsu Ltd. are strategically positioned to capitalize on this growth, driving competition and innovation within the self-service sector. Expansion into emerging markets, especially in Asia-Pacific, will be a key factor in determining future market trajectory.
Self-Serve Industry Company Market Share
Self-Serve Industry Market Report: 2019-2033
This comprehensive report provides a detailed analysis of the self-serve industry, projecting a market size of $XX Million by 2033. The study covers the period from 2019 to 2033, with 2025 as the base year and a forecast period of 2025-2033. This in-depth analysis is invaluable for industry professionals, investors, and anyone seeking to understand the dynamics and future of this rapidly evolving sector. We examine key segments, leading players, and emerging trends shaping the future of self-service technologies.
Self-Serve Industry Market Structure & Innovation Trends
This section analyzes the competitive landscape of the self-serve industry, exploring market concentration, innovation drivers, and regulatory influences. We delve into the impact of mergers and acquisitions (M&A) activities, examining deal values and their effects on market share. The analysis considers end-user demographics and the presence of product substitutes.
Market Concentration: The self-serve industry exhibits a moderately concentrated structure, with a few major players commanding significant market share. However, the emergence of smaller, specialized firms is increasing competition. The top 5 players hold an estimated xx% of the market share.
Innovation Drivers: Key drivers include advancements in AI, IoT, and mobile payment technologies. These innovations are leading to increased automation, enhanced user experience, and improved operational efficiency.
Regulatory Frameworks: Varying regulations across different regions influence market access and product compliance. A detailed assessment of these regional differences is included in the report.
M&A Activity: The historical period (2019-2024) witnessed several notable M&A activities, with deal values totaling approximately $XX Million. These transactions significantly shaped the competitive landscape and fostered innovation. Future projections suggest continued consolidation.
Product Substitutes: The industry faces increasing competition from alternative service models, requiring continuous innovation to maintain market share.
Self-Serve Industry Market Dynamics & Trends
This section details the key factors driving market growth, technological disruptions, evolving consumer preferences, and competitive dynamics within the self-serve industry. We analyze historical trends and provide projections for the forecast period.
The self-serve industry has witnessed a CAGR of xx% during the historical period (2019-2024) and is projected to maintain a CAGR of xx% during the forecast period (2025-2033). This growth is fueled by several factors, including: rising consumer demand for convenience and speed, increasing automation across diverse sectors, and the integration of advanced technologies like AI and machine learning. The market penetration of self-serve solutions is also rising across various end-user segments, driven by factors such as labor cost optimization and enhanced customer experience. However, challenges remain in addressing security concerns and ensuring seamless integration with existing systems. The competitive landscape is dynamic, with both established players and new entrants vying for market share.
Dominant Regions & Segments in Self-Serve Industry
This section identifies the leading regions and segments within the self-serve industry. The analysis considers both Type (Kiosk, ATM, Vending Machine) and End-user (BFSI, Retail & Fast Food Chain, Hospitality, Healthcare, Travel & Transportation, Other End-users).
Leading Region: North America currently dominates the self-serve industry, driven by factors such as high technological adoption rates and strong consumer demand. However, the Asia-Pacific region is witnessing rapid growth, predicted to become a significant market in the coming years.
Dominant Segments:
By Type: ATMs hold the largest market share, followed by kiosks and vending machines. The growth of each segment is closely linked to technological advancements and sector-specific trends.
By End-user: The BFSI sector is a significant driver of demand for ATMs and kiosks, while the retail and fast-food sector are key consumers of self-checkout kiosks and vending machines. The hospitality sector is experiencing rapid growth in self-service technologies, especially for check-in/check-out processes.
Key Drivers: Several factors contribute to regional and segment dominance. These include economic policies supporting technology adoption, favorable regulatory frameworks, robust infrastructure, and consumer preferences. Specific examples are provided in the full report.
Self-Serve Industry Product Innovations
Recent years have witnessed significant product innovations in the self-serve industry, driven primarily by advancements in software and hardware technologies. The integration of AI and machine learning capabilities is improving user experience and operational efficiency. This includes features like facial recognition, biometric authentication, and customized product recommendations. Many new products are designed with improved security features to mitigate fraud and vandalism. The development of modular and customizable solutions caters to the specific needs of diverse end-users across multiple sectors. These innovations are enhancing market penetration and creating new opportunities for growth.
Report Scope & Segmentation Analysis
This report comprehensively segments the self-serve industry based on Type (Kiosk, ATM, Vending Machine) and End-user (BFSI, Retail & Fast Food Chain, Hospitality, Healthcare, Travel & Transportation, Other End-users). Each segment's growth trajectory, market size, and competitive dynamics are analyzed in detail. Growth projections are provided for each segment, considering the impact of technological advancements and market trends.
Key Drivers of Self-Serve Industry Growth
Several factors are driving the growth of the self-serve industry. These include technological advancements enabling automation and efficiency, changing consumer preferences favouring convenience and speed, and supportive economic policies. Government initiatives promoting digital transformation and the increasing adoption of cashless payment methods further accelerate this growth.
Challenges in the Self-Serve Industry Sector
The self-serve industry faces challenges such as cybersecurity risks, the need for robust maintenance and support infrastructure, and the high initial investment cost of deploying self-service solutions. Supply chain disruptions and competition from alternative solutions also pose significant obstacles. These challenges can impact market growth and profitability.
Emerging Opportunities in Self-Serve Industry
Emerging opportunities exist in the integration of self-serve technologies with other innovative solutions like IoT and blockchain. The expansion into new markets, particularly developing economies with growing technological adoption, presents significant potential. The focus on personalization and customer experience, and the development of sustainable and environmentally friendly self-service solutions are also creating new opportunities.
Leading Players in the Self-Serve Industry Market
- MaasInternationalEurope B.V.
- Fujitsu Ltd
- Crane Co (USA)
- NCR Corporation
- SEDCO
- Frank Mayer & Associates Inc
- Advanced Kiosks
- Azkoyen Group
- Advantech Co Limited
- ProtouchUK
- Zebra Technologies
- HESS Cash systems GmbH & Co
- Diebold Nixdorf
- Embross
- IER Group
(List Not Exhaustive)
Key Developments in Self-Serve Industry
January 2024: NCR Corporation launched its Next Generation Self-Checkout Solution, NCR Voyix commerce platform, enhancing the retail checkout experience.
June 2023: Gem OpenCube technologies pvt ltd launched the world's first automated Water, Tea, and Coffee vending machine.
Future Outlook for Self-Serve Industry Market
The self-serve industry is poised for continued growth, driven by technological innovation and evolving consumer preferences. The expanding adoption of self-service solutions across various sectors presents significant opportunities for market players. Strategic investments in research and development, coupled with effective marketing and distribution strategies, will be crucial for success in this competitive landscape. The market is expected to reach $XX Million by 2033, indicating substantial future potential.
Self-Serve Industry Segmentation
-
1. Type
- 1.1. Kiosk
- 1.2. ATM
- 1.3. Vending Machine
-
2. End-user
- 2.1. BFSI
- 2.2. Retail & Fast Food Chain
- 2.3. Hospitality
- 2.4. Healthcare
- 2.5. Travel & Transportation
- 2.6. Other End-users
Self-Serve Industry Segmentation By Geography
- 1. North America
- 2. Europe
- 3. Asia Pacific
- 4. South America
- 5. Middle East and Africa
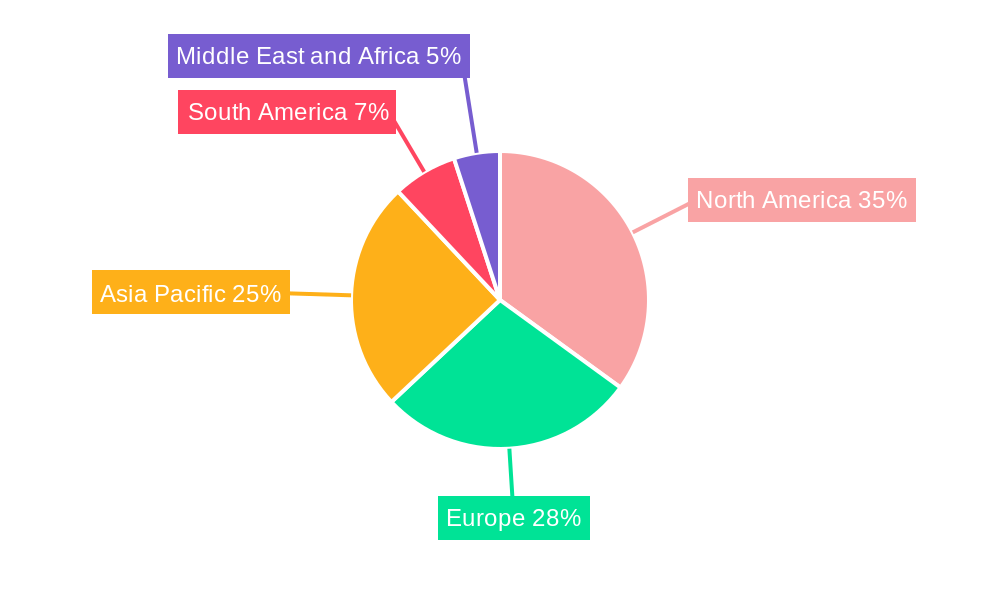
Self-Serve Industry Regional Market Share
Geographic Coverage of Self-Serve Industry
Self-Serve Industry REPORT HIGHLIGHTS
| Aspects | Details |
|---|---|
| Study Period | 2020-2034 |
| Base Year | 2025 |
| Estimated Year | 2026 |
| Forecast Period | 2026-2034 |
| Historical Period | 2020-2025 |
| Growth Rate | CAGR of 7.79% from 2020-2034 |
| Segmentation |
|
Table of Contents
- 1. Introduction
- 1.1. Research Scope
- 1.2. Market Segmentation
- 1.3. Research Objective
- 1.4. Definitions and Assumptions
- 2. Executive Summary
- 2.1. Market Snapshot
- 3. Market Dynamics
- 3.1. Market Drivers
- 3.2. Market Restrains
- 3.3. Market Trends
- 3.4. Market Opportunities
- 4. Market Factor Analysis
- 4.1. Porters Five Forces
- 4.1.1. Bargaining Power of Suppliers
- 4.1.2. Bargaining Power of Buyers
- 4.1.3. Threat of New Entrants
- 4.1.4. Threat of Substitutes
- 4.1.5. Competitive Rivalry
- 4.2. PESTEL analysis
- 4.3. BCG Analysis
- 4.3.1. Stars (High Growth, High Market Share)
- 4.3.2. Cash Cows (Low Growth, High Market Share)
- 4.3.3. Question Mark (High Growth, Low Market Share)
- 4.3.4. Dogs (Low Growth, Low Market Share)
- 4.4. Ansoff Matrix Analysis
- 4.5. Supply Chain Analysis
- 4.6. Regulatory Landscape
- 4.7. Current Market Potential and Opportunity Assessment (TAM–SAM–SOM Framework)
- 4.8. PRI Analyst Note
- 4.1. Porters Five Forces
- 5. Market Analysis, Insights and Forecast 2021-2033
- 5.1. Market Analysis, Insights and Forecast - by Type
- 5.1.1. Kiosk
- 5.1.2. ATM
- 5.1.3. Vending Machine
- 5.2. Market Analysis, Insights and Forecast - by End-user
- 5.2.1. BFSI
- 5.2.2. Retail & Fast Food Chain
- 5.2.3. Hospitality
- 5.2.4. Healthcare
- 5.2.5. Travel & Transportation
- 5.2.6. Other End-users
- 5.3. Market Analysis, Insights and Forecast - by Region
- 5.3.1. North America
- 5.3.2. Europe
- 5.3.3. Asia Pacific
- 5.3.4. South America
- 5.3.5. Middle East and Africa
- 5.1. Market Analysis, Insights and Forecast - by Type
- 6. Global Self-Serve Industry Analysis, Insights and Forecast, 2021-2033
- 6.1. Market Analysis, Insights and Forecast - by Type
- 6.1.1. Kiosk
- 6.1.2. ATM
- 6.1.3. Vending Machine
- 6.2. Market Analysis, Insights and Forecast - by End-user
- 6.2.1. BFSI
- 6.2.2. Retail & Fast Food Chain
- 6.2.3. Hospitality
- 6.2.4. Healthcare
- 6.2.5. Travel & Transportation
- 6.2.6. Other End-users
- 6.1. Market Analysis, Insights and Forecast - by Type
- 7. North America Self-Serve Industry Analysis, Insights and Forecast, 2020-2032
- 7.1. Market Analysis, Insights and Forecast - by Type
- 7.1.1. Kiosk
- 7.1.2. ATM
- 7.1.3. Vending Machine
- 7.2. Market Analysis, Insights and Forecast - by End-user
- 7.2.1. BFSI
- 7.2.2. Retail & Fast Food Chain
- 7.2.3. Hospitality
- 7.2.4. Healthcare
- 7.2.5. Travel & Transportation
- 7.2.6. Other End-users
- 7.1. Market Analysis, Insights and Forecast - by Type
- 8. Europe Self-Serve Industry Analysis, Insights and Forecast, 2020-2032
- 8.1. Market Analysis, Insights and Forecast - by Type
- 8.1.1. Kiosk
- 8.1.2. ATM
- 8.1.3. Vending Machine
- 8.2. Market Analysis, Insights and Forecast - by End-user
- 8.2.1. BFSI
- 8.2.2. Retail & Fast Food Chain
- 8.2.3. Hospitality
- 8.2.4. Healthcare
- 8.2.5. Travel & Transportation
- 8.2.6. Other End-users
- 8.1. Market Analysis, Insights and Forecast - by Type
- 9. Asia Pacific Self-Serve Industry Analysis, Insights and Forecast, 2020-2032
- 9.1. Market Analysis, Insights and Forecast - by Type
- 9.1.1. Kiosk
- 9.1.2. ATM
- 9.1.3. Vending Machine
- 9.2. Market Analysis, Insights and Forecast - by End-user
- 9.2.1. BFSI
- 9.2.2. Retail & Fast Food Chain
- 9.2.3. Hospitality
- 9.2.4. Healthcare
- 9.2.5. Travel & Transportation
- 9.2.6. Other End-users
- 9.1. Market Analysis, Insights and Forecast - by Type
- 10. South America Self-Serve Industry Analysis, Insights and Forecast, 2020-2032
- 10.1. Market Analysis, Insights and Forecast - by Type
- 10.1.1. Kiosk
- 10.1.2. ATM
- 10.1.3. Vending Machine
- 10.2. Market Analysis, Insights and Forecast - by End-user
- 10.2.1. BFSI
- 10.2.2. Retail & Fast Food Chain
- 10.2.3. Hospitality
- 10.2.4. Healthcare
- 10.2.5. Travel & Transportation
- 10.2.6. Other End-users
- 10.1. Market Analysis, Insights and Forecast - by Type
- 11. Middle East and Africa Self-Serve Industry Analysis, Insights and Forecast, 2020-2032
- 11.1. Market Analysis, Insights and Forecast - by Type
- 11.1.1. Kiosk
- 11.1.2. ATM
- 11.1.3. Vending Machine
- 11.2. Market Analysis, Insights and Forecast - by End-user
- 11.2.1. BFSI
- 11.2.2. Retail & Fast Food Chain
- 11.2.3. Hospitality
- 11.2.4. Healthcare
- 11.2.5. Travel & Transportation
- 11.2.6. Other End-users
- 11.1. Market Analysis, Insights and Forecast - by Type
- 12. Competitive Analysis
- 12.1. Company Profiles
- 12.1.1 MaasInternationalEuropeB V*List Not Exhaustive
- 12.1.1.1. Company Overview
- 12.1.1.2. Products
- 12.1.1.3. Company Financials
- 12.1.1.4. SWOT Analysis
- 12.1.2 Fujitsu Ltd
- 12.1.2.1. Company Overview
- 12.1.2.2. Products
- 12.1.2.3. Company Financials
- 12.1.2.4. SWOT Analysis
- 12.1.3 Crane Co (USA)
- 12.1.3.1. Company Overview
- 12.1.3.2. Products
- 12.1.3.3. Company Financials
- 12.1.3.4. SWOT Analysis
- 12.1.4 NCR Corporation
- 12.1.4.1. Company Overview
- 12.1.4.2. Products
- 12.1.4.3. Company Financials
- 12.1.4.4. SWOT Analysis
- 12.1.5 SEDCO
- 12.1.5.1. Company Overview
- 12.1.5.2. Products
- 12.1.5.3. Company Financials
- 12.1.5.4. SWOT Analysis
- 12.1.6 Frank Mayer & Associates Inc
- 12.1.6.1. Company Overview
- 12.1.6.2. Products
- 12.1.6.3. Company Financials
- 12.1.6.4. SWOT Analysis
- 12.1.7 Advanced Kiosks
- 12.1.7.1. Company Overview
- 12.1.7.2. Products
- 12.1.7.3. Company Financials
- 12.1.7.4. SWOT Analysis
- 12.1.8 Azkoyen Group
- 12.1.8.1. Company Overview
- 12.1.8.2. Products
- 12.1.8.3. Company Financials
- 12.1.8.4. SWOT Analysis
- 12.1.9 Advantech Co Limited
- 12.1.9.1. Company Overview
- 12.1.9.2. Products
- 12.1.9.3. Company Financials
- 12.1.9.4. SWOT Analysis
- 12.1.10 ProtouchUK
- 12.1.10.1. Company Overview
- 12.1.10.2. Products
- 12.1.10.3. Company Financials
- 12.1.10.4. SWOT Analysis
- 12.1.11 Zebra Technologies
- 12.1.11.1. Company Overview
- 12.1.11.2. Products
- 12.1.11.3. Company Financials
- 12.1.11.4. SWOT Analysis
- 12.1.12 HESS Cash systems GmbH & Co
- 12.1.12.1. Company Overview
- 12.1.12.2. Products
- 12.1.12.3. Company Financials
- 12.1.12.4. SWOT Analysis
- 12.1.13 Diebold Nixdorf
- 12.1.13.1. Company Overview
- 12.1.13.2. Products
- 12.1.13.3. Company Financials
- 12.1.13.4. SWOT Analysis
- 12.1.14 Embross
- 12.1.14.1. Company Overview
- 12.1.14.2. Products
- 12.1.14.3. Company Financials
- 12.1.14.4. SWOT Analysis
- 12.1.15 IER Group
- 12.1.15.1. Company Overview
- 12.1.15.2. Products
- 12.1.15.3. Company Financials
- 12.1.15.4. SWOT Analysis
- 12.1.1 MaasInternationalEuropeB V*List Not Exhaustive
- 12.2. Market Entropy
- 12.2.1 Company's Key Areas Served
- 12.2.2 Recent Developments
- 12.3. Company Market Share Analysis 2025
- 12.3.1 Top 5 Companies Market Share Analysis
- 12.3.2 Top 3 Companies Market Share Analysis
- 12.4. List of Potential Customers
- 13. Research Methodology
List of Figures
- Figure 1: Global Self-Serve Industry Revenue Breakdown (Million, %) by Region 2025 & 2033
- Figure 2: North America Self-Serve Industry Revenue (Million), by Type 2025 & 2033
- Figure 3: North America Self-Serve Industry Revenue Share (%), by Type 2025 & 2033
- Figure 4: North America Self-Serve Industry Revenue (Million), by End-user 2025 & 2033
- Figure 5: North America Self-Serve Industry Revenue Share (%), by End-user 2025 & 2033
- Figure 6: North America Self-Serve Industry Revenue (Million), by Country 2025 & 2033
- Figure 7: North America Self-Serve Industry Revenue Share (%), by Country 2025 & 2033
- Figure 8: Europe Self-Serve Industry Revenue (Million), by Type 2025 & 2033
- Figure 9: Europe Self-Serve Industry Revenue Share (%), by Type 2025 & 2033
- Figure 10: Europe Self-Serve Industry Revenue (Million), by End-user 2025 & 2033
- Figure 11: Europe Self-Serve Industry Revenue Share (%), by End-user 2025 & 2033
- Figure 12: Europe Self-Serve Industry Revenue (Million), by Country 2025 & 2033
- Figure 13: Europe Self-Serve Industry Revenue Share (%), by Country 2025 & 2033
- Figure 14: Asia Pacific Self-Serve Industry Revenue (Million), by Type 2025 & 2033
- Figure 15: Asia Pacific Self-Serve Industry Revenue Share (%), by Type 2025 & 2033
- Figure 16: Asia Pacific Self-Serve Industry Revenue (Million), by End-user 2025 & 2033
- Figure 17: Asia Pacific Self-Serve Industry Revenue Share (%), by End-user 2025 & 2033
- Figure 18: Asia Pacific Self-Serve Industry Revenue (Million), by Country 2025 & 2033
- Figure 19: Asia Pacific Self-Serve Industry Revenue Share (%), by Country 2025 & 2033
- Figure 20: South America Self-Serve Industry Revenue (Million), by Type 2025 & 2033
- Figure 21: South America Self-Serve Industry Revenue Share (%), by Type 2025 & 2033
- Figure 22: South America Self-Serve Industry Revenue (Million), by End-user 2025 & 2033
- Figure 23: South America Self-Serve Industry Revenue Share (%), by End-user 2025 & 2033
- Figure 24: South America Self-Serve Industry Revenue (Million), by Country 2025 & 2033
- Figure 25: South America Self-Serve Industry Revenue Share (%), by Country 2025 & 2033
- Figure 26: Middle East and Africa Self-Serve Industry Revenue (Million), by Type 2025 & 2033
- Figure 27: Middle East and Africa Self-Serve Industry Revenue Share (%), by Type 2025 & 2033
- Figure 28: Middle East and Africa Self-Serve Industry Revenue (Million), by End-user 2025 & 2033
- Figure 29: Middle East and Africa Self-Serve Industry Revenue Share (%), by End-user 2025 & 2033
- Figure 30: Middle East and Africa Self-Serve Industry Revenue (Million), by Country 2025 & 2033
- Figure 31: Middle East and Africa Self-Serve Industry Revenue Share (%), by Country 2025 & 2033
List of Tables
- Table 1: Global Self-Serve Industry Revenue Million Forecast, by Type 2020 & 2033
- Table 2: Global Self-Serve Industry Revenue Million Forecast, by End-user 2020 & 2033
- Table 3: Global Self-Serve Industry Revenue Million Forecast, by Region 2020 & 2033
- Table 4: Global Self-Serve Industry Revenue Million Forecast, by Type 2020 & 2033
- Table 5: Global Self-Serve Industry Revenue Million Forecast, by End-user 2020 & 2033
- Table 6: Global Self-Serve Industry Revenue Million Forecast, by Country 2020 & 2033
- Table 7: Global Self-Serve Industry Revenue Million Forecast, by Type 2020 & 2033
- Table 8: Global Self-Serve Industry Revenue Million Forecast, by End-user 2020 & 2033
- Table 9: Global Self-Serve Industry Revenue Million Forecast, by Country 2020 & 2033
- Table 10: Global Self-Serve Industry Revenue Million Forecast, by Type 2020 & 2033
- Table 11: Global Self-Serve Industry Revenue Million Forecast, by End-user 2020 & 2033
- Table 12: Global Self-Serve Industry Revenue Million Forecast, by Country 2020 & 2033
- Table 13: Global Self-Serve Industry Revenue Million Forecast, by Type 2020 & 2033
- Table 14: Global Self-Serve Industry Revenue Million Forecast, by End-user 2020 & 2033
- Table 15: Global Self-Serve Industry Revenue Million Forecast, by Country 2020 & 2033
- Table 16: Global Self-Serve Industry Revenue Million Forecast, by Type 2020 & 2033
- Table 17: Global Self-Serve Industry Revenue Million Forecast, by End-user 2020 & 2033
- Table 18: Global Self-Serve Industry Revenue Million Forecast, by Country 2020 & 2033
Frequently Asked Questions
1. What is the projected Compound Annual Growth Rate (CAGR) of the Self-Serve Industry?
The projected CAGR is approximately 7.79%.
2. Which companies are prominent players in the Self-Serve Industry?
Key companies in the market include MaasInternationalEuropeB V*List Not Exhaustive, Fujitsu Ltd, Crane Co (USA), NCR Corporation, SEDCO, Frank Mayer & Associates Inc, Advanced Kiosks, Azkoyen Group, Advantech Co Limited, ProtouchUK, Zebra Technologies, HESS Cash systems GmbH & Co, Diebold Nixdorf, Embross, IER Group.
3. What are the main segments of the Self-Serve Industry?
The market segments include Type, End-user.
4. Can you provide details about the market size?
The market size is estimated to be USD 38.22 Million as of 2022.
5. What are some drivers contributing to market growth?
Growing emphasis on ensuring customer satisfaction to drive demand in the Retail & Food sector; High investments in the infrastructure developments (new & refurbishments) and smart city initiatives; Technological investments to enable greater support for the differently abled populace & new users.
6. What are the notable trends driving market growth?
Automated Teller Machine (ATM) to Witness the Growth.
7. Are there any restraints impacting market growth?
Cost and maintenance remains a key consideration.
8. Can you provide examples of recent developments in the market?
In Januray 2024 - NCR Corporation announced the launch of its Next Generation Self-Checkout Solution NCR Voyix commerce platform, WHere the NCR Voyix Next Generation Self-Checkout Solution is a significant evolution in the checkout experience for retailers and shoppers alike. It caters to changing shopper journeys, drives inclusion of demographics and payments, and provides an agile, modern software-as-a-service (SaaS) technology stack with a flexible, fabric-like hardware approach.
9. What pricing options are available for accessing the report?
Pricing options include single-user, multi-user, and enterprise licenses priced at USD 4750, USD 5250, and USD 8750 respectively.
10. Is the market size provided in terms of value or volume?
The market size is provided in terms of value, measured in Million.
11. Are there any specific market keywords associated with the report?
Yes, the market keyword associated with the report is "Self-Serve Industry," which aids in identifying and referencing the specific market segment covered.
12. How do I determine which pricing option suits my needs best?
The pricing options vary based on user requirements and access needs. Individual users may opt for single-user licenses, while businesses requiring broader access may choose multi-user or enterprise licenses for cost-effective access to the report.
13. Are there any additional resources or data provided in the Self-Serve Industry report?
While the report offers comprehensive insights, it's advisable to review the specific contents or supplementary materials provided to ascertain if additional resources or data are available.
14. How can I stay updated on further developments or reports in the Self-Serve Industry?
To stay informed about further developments, trends, and reports in the Self-Serve Industry, consider subscribing to industry newsletters, following relevant companies and organizations, or regularly checking reputable industry news sources and publications.
Methodology
Step 1 - Identification of Relevant Samples Size from Population Database


Step 2 - Approaches for Defining Global Market Size (Value, Volume* & Price*)

Note*: In applicable scenarios
Step 3 - Data Sources
Primary Research
- Web Analytics
- Survey Reports
- Research Institute
- Latest Research Reports
- Opinion Leaders
Secondary Research
- Annual Reports
- White Paper
- Latest Press Release
- Industry Association
- Paid Database
- Investor Presentations

Step 4 - Data Triangulation
Involves using different sources of information in order to increase the validity of a study
These sources are likely to be stakeholders in a program - participants, other researchers, program staff, other community members, and so on.
Then we put all data in single framework & apply various statistical tools to find out the dynamic on the market.
During the analysis stage, feedback from the stakeholder groups would be compared to determine areas of agreement as well as areas of divergence