Understanding Semiconductor Battery Industry Trends and Growth Dynamics

Semiconductor Battery Industry by Type (Lithium-Ion, Nickel-Metal Hydride, Lithium-Ion Polymer, Sodium-Ion Battery), by End-User Application (Consumer Electronics, Electric Vehicles, Energy Storage System, Other End-User Applications), by North America (United States, Canada, Rest of North America), by Asia Pacific (China, India, Japan, South Korea, Rest of Asia Pacific), by Europe (Germany, United Kingdom, France, Italy, Rest of Europe), by South America (Chile, Brazil, Argentina, Rest of South America), by Middle East and Africa (Saudi Arabia, United Arab Emirates, South Africa, Egypt, Rest of Middle East and Africa) Forecast 2025-2033

Jul 8 2025
Base Year: 2024

234 Pages
Main Logo

Understanding Semiconductor Battery Industry Trends and Growth Dynamics


Home
Industries
Energy & Power
sponsor image
sponsor image
sponsor image
sponsor image
sponsor image

Tailored for you

  • In-depth Analysis Tailored to Specified Regions or Segments
  • Company Profiles Customized to User Preferences
  • Comprehensive Insights Focused on Specific Segments or Regions
  • Customized Evaluation of Competitive Landscape to Meet Your Needs
  • Tailored Customization to Address Other Specific Requirements
Ask for customization


Key Insights

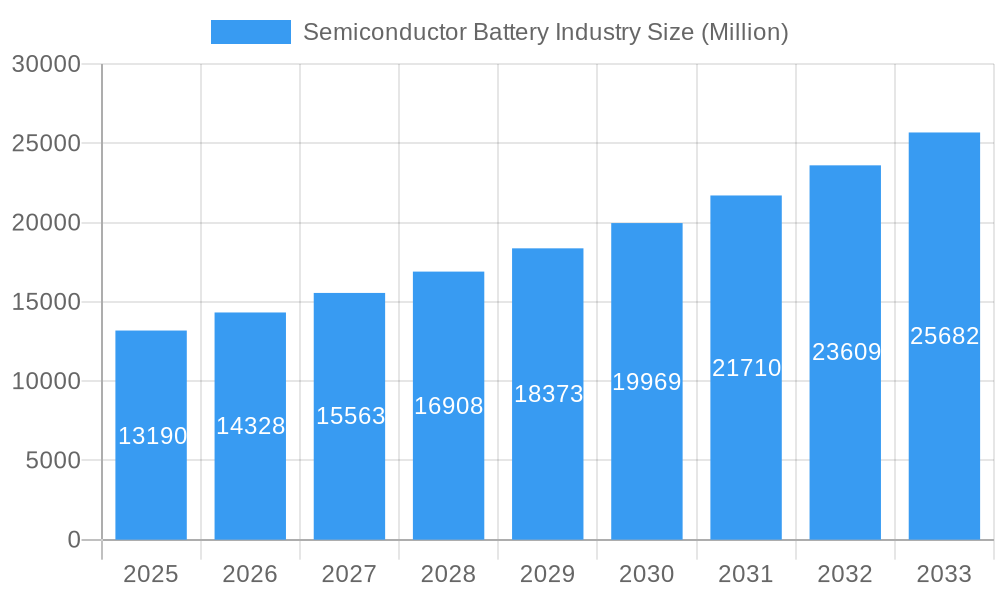
The semiconductor battery market, valued at $13.19 billion in 2025, is projected to experience robust growth, exhibiting a compound annual growth rate (CAGR) of 8.67% from 2025 to 2033. This expansion is driven by several key factors. The surging demand for electric vehicles (EVs) is a primary catalyst, necessitating high-performance and energy-dense batteries. Furthermore, the increasing adoption of renewable energy sources and the consequent need for efficient energy storage systems (ESS) are significantly bolstering market growth. Advancements in battery technology, particularly in lithium-ion polymer and sodium-ion batteries, are improving energy density, lifespan, and safety, further fueling market expansion. The consumer electronics sector also contributes substantially, with the proliferation of portable devices demanding compact and powerful batteries. While challenges such as raw material price volatility and environmental concerns related to battery production and disposal exist, the overall market outlook remains positive, driven by technological innovations and supportive government policies promoting sustainable energy solutions.
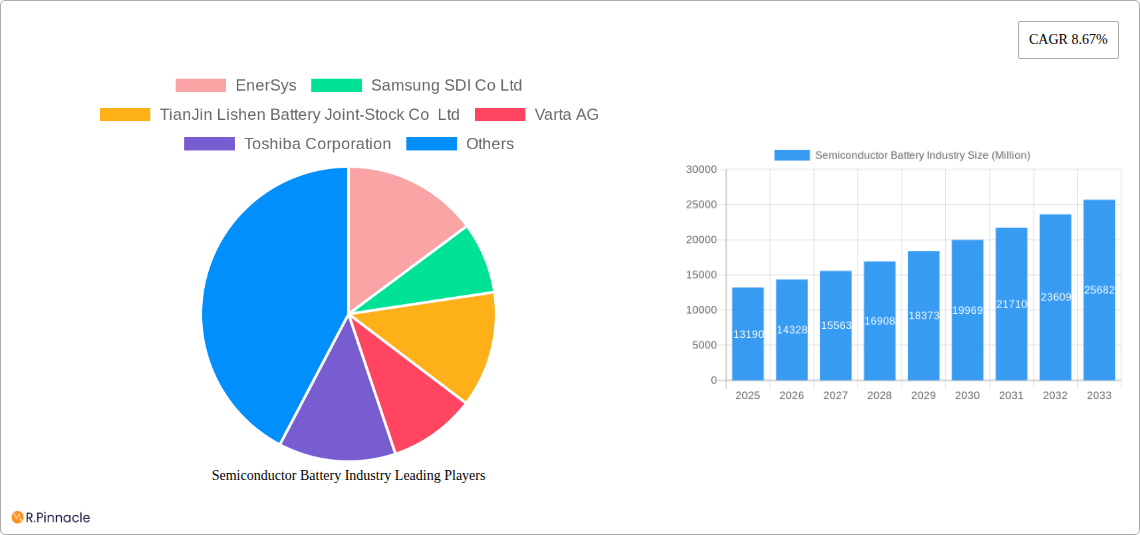
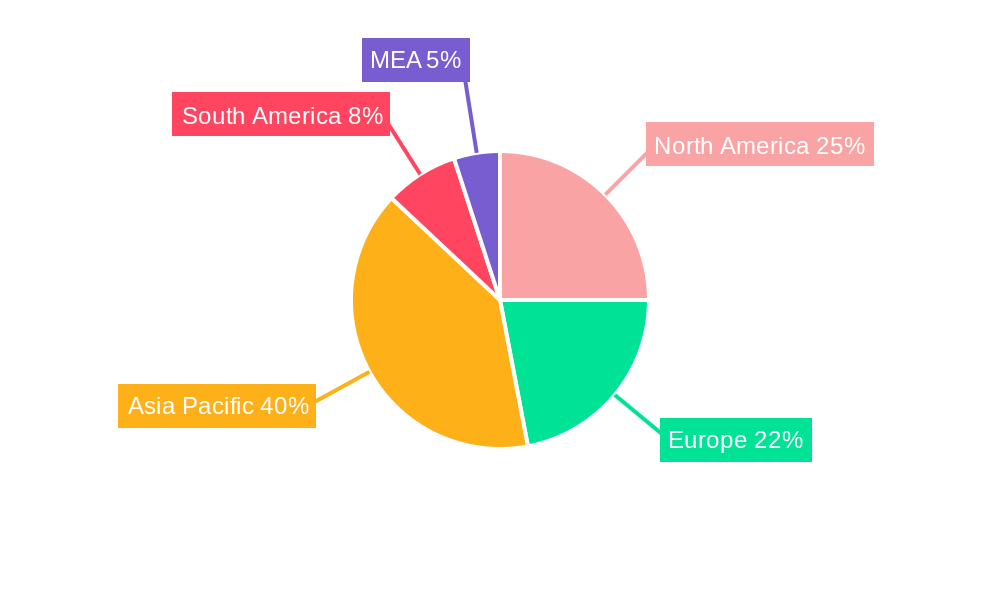
Market segmentation reveals lithium-ion batteries currently dominate, but sodium-ion batteries are emerging as a strong contender due to their lower cost and abundant raw materials. Geographical analysis indicates strong growth across all regions, with Asia-Pacific leading due to its significant manufacturing base and rapidly expanding EV market. North America and Europe follow closely, driven by robust consumer electronics demand and increasing investments in renewable energy infrastructure. Key players like EnerSys, Samsung SDI, and Panasonic are strategically investing in research and development, expanding production capacities, and forging strategic partnerships to capitalize on this lucrative market opportunity. The competitive landscape is dynamic, with companies focusing on innovation to enhance battery performance, reduce costs, and cater to the diverse needs of various end-user applications. The forecast period of 2025-2033 presents substantial opportunities for market players to innovate and capture market share within this rapidly evolving sector.

Semiconductor Battery Industry Research Report - Market Size, Growth & Forecast

Semiconductor Battery Industry Market Report: 2019-2033

This comprehensive report provides a detailed analysis of the semiconductor battery industry, offering invaluable insights for industry professionals, investors, and strategists. Covering the period from 2019 to 2033, with a base year of 2025 and a forecast period of 2025-2033, this report leverages extensive data analysis to illuminate market trends, growth drivers, and challenges. The report projects a xx Million market value by 2033, showcasing significant growth potential.

Semiconductor Battery Industry Market Structure & Innovation Trends

This section analyzes the competitive landscape of the semiconductor battery market, exploring market concentration, innovation drivers, regulatory frameworks, and M&A activities. The industry exhibits a moderately concentrated structure, with key players such as Panasonic, Samsung SDI, and Sony holding significant market share. However, the emergence of innovative companies like Faradion is disrupting the status quo.

  • Market Concentration: The top 5 players account for approximately xx% of the global market share in 2025.
  • Innovation Drivers: Miniaturization, increased energy density, and improved safety are driving innovation. Government initiatives promoting electric vehicles and renewable energy storage systems further fuel this.
  • Regulatory Frameworks: Stringent environmental regulations and safety standards significantly influence industry practices and technology development.
  • Product Substitutes: Competition exists from traditional battery technologies, but semiconductor batteries offer advantages in terms of efficiency and lifespan, creating a distinct market segment.
  • End-User Demographics: The growing demand for portable electronics, electric vehicles (EVs), and energy storage systems (ESS) is fueling market growth.
  • M&A Activities: The past five years have witnessed xx Million in M&A deals, primarily focused on acquiring technology and expanding market reach. Examples include (hypothetical examples, replace with actual data if available): Company A acquiring Company B for xx Million, enhancing its lithium-ion battery portfolio.
Semiconductor Battery Industry Growth

Semiconductor Battery Industry Market Dynamics & Trends

This section delves into the market's dynamic forces, examining growth drivers, technological disruptions, consumer preferences, and competitive dynamics. The market is experiencing robust growth, driven primarily by the increasing demand for EVs and ESS. Technological advancements, particularly in material science and battery management systems (BMS), are enhancing performance and reducing costs.

The compound annual growth rate (CAGR) for the semiconductor battery market is projected at xx% during the forecast period (2025-2033). Market penetration in the EV sector is expected to reach xx% by 2033, driven by the increasing adoption of EVs globally. Consumer preferences are shifting towards higher energy density, faster charging times, and enhanced safety features. Intense competition among established players and emerging startups is driving innovation and price reductions.

Semiconductor Battery Industry Growth

Dominant Regions & Segments in Semiconductor Battery Industry

This section identifies the leading regions and segments within the semiconductor battery market.

  • Leading Regions: Asia, particularly China, Japan, and South Korea, dominates the market due to robust manufacturing capabilities and strong demand for consumer electronics and EVs. North America and Europe are also experiencing significant growth, driven by government support for clean energy initiatives.

  • Leading Segments:

    • Type: Lithium-ion batteries hold the largest market share, owing to their high energy density and widespread adoption. However, sodium-ion batteries are gaining traction due to their lower cost and abundant raw materials. Nickel-metal hydride and lithium-ion polymer batteries continue to cater to niche applications.

    • End-User Application: The electric vehicle segment is the fastest-growing application, followed by energy storage systems. Consumer electronics remain a significant market, while other end-user applications are slowly expanding.

  • Key Drivers: Government incentives for EV adoption, investments in renewable energy infrastructure, and the growing awareness of climate change are crucial growth drivers. Stringent emission standards in various regions are also pushing the adoption of EVs and ESS.

Semiconductor Battery Industry Product Innovations

Recent product innovations focus on improving energy density, charging speed, and safety. Advancements in materials science, such as the development of solid-state batteries, promise significant performance improvements. The integration of advanced BMS further enhances battery life and safety. These innovations are tailored to meet the diverse needs of various end-user applications, from small portable devices to large-scale energy storage systems. Market fit is ensured through strategic partnerships and collaborations between battery manufacturers and semiconductor companies.

Report Scope & Segmentation Analysis

This report segments the semiconductor battery market by type (Lithium-ion, Nickel-Metal Hydride, Lithium-Ion Polymer, Sodium-Ion Battery) and end-user application (Consumer Electronics, Electric Vehicles, Energy Storage System, Other End-User Applications). Each segment's growth projections, market size, and competitive dynamics are analyzed in detail. The Lithium-ion segment is projected to maintain its dominance throughout the forecast period, with a xx% CAGR. The Electric Vehicle segment is poised for the fastest growth due to increasing EV adoption.

Key Drivers of Semiconductor Battery Industry Growth

Several factors fuel the growth of the semiconductor battery industry. Technological advancements, including improved energy density and lifespan, are key. Government policies promoting electric vehicles and renewable energy contribute significantly. The increasing demand for energy storage solutions from various sectors further boosts the market.

Challenges in the Semiconductor Battery Industry Sector

The industry faces challenges including high raw material costs, complex supply chains vulnerable to disruptions, and intense competition. Stringent safety and environmental regulations also present hurdles, influencing manufacturing costs and production processes. These factors impact profitability and market growth.

Emerging Opportunities in Semiconductor Battery Industry

Emerging opportunities include advancements in solid-state battery technology, the growing market for grid-scale energy storage, and the increasing integration of semiconductor batteries into smart devices and IoT applications. New markets in developing economies also present significant potential.

Leading Players in the Semiconductor Battery Industry Market

  • EnerSys
  • Samsung SDI Co Ltd
  • TianJin Lishen Battery Joint-Stock Co Ltd
  • Varta AG
  • Toshiba Corporation
  • Faradion Limited
  • GS Yuasa Corporation
  • Routejade
  • Panasonic Corporation
  • Sony Corporation

Key Developments in Semiconductor Battery Industry Industry

  • February 2022: ROHM Semiconductor launched the REFLVBMS001-EVK-001 evaluation board for ultra-efficient semiconductor battery operations in IoT devices. This enhances the efficiency and capabilities of semiconductor batteries in the growing IoT sector.

  • February 2022: Solus Advanced Materials announced plans to expand into semiconductor battery and battery foil production, signaling significant investment and a projected sales increase by 2026. This reflects the growing importance of semiconductor batteries and the potential for market expansion.

Future Outlook for Semiconductor Battery Industry Market

The semiconductor battery market is poised for continued strong growth, driven by technological advancements and increasing demand across various applications. Strategic partnerships, investments in R&D, and expansion into new markets will be crucial for success. The market is expected to reach xx Million by 2033, representing significant growth opportunities for industry players.

Semiconductor Battery Industry Segmentation

  • 1. Type
    • 1.1. Lithium-Ion
    • 1.2. Nickel-Metal Hydride
    • 1.3. Lithium-Ion Polymer
    • 1.4. Sodium-Ion Battery
  • 2. End-User Application
    • 2.1. Consumer Electronics
    • 2.2. Electric Vehicles
    • 2.3. Energy Storage System
    • 2.4. Other End-User Applications

Semiconductor Battery Industry Segmentation By Geography

  • 1. North America
    • 1.1. United States
    • 1.2. Canada
    • 1.3. Rest of North America
  • 2. Asia Pacific
    • 2.1. China
    • 2.2. India
    • 2.3. Japan
    • 2.4. South Korea
    • 2.5. Rest of Asia Pacific
  • 3. Europe
    • 3.1. Germany
    • 3.2. United Kingdom
    • 3.3. France
    • 3.4. Italy
    • 3.5. Rest of Europe
  • 4. South America
    • 4.1. Chile
    • 4.2. Brazil
    • 4.3. Argentina
    • 4.4. Rest of South America
  • 5. Middle East and Africa
    • 5.1. Saudi Arabia
    • 5.2. United Arab Emirates
    • 5.3. South Africa
    • 5.4. Egypt
    • 5.5. Rest of Middle East and Africa
Semiconductor Battery Industry Regional Share


Semiconductor Battery Industry REPORT HIGHLIGHTS

AspectsDetails
Study Period 2019-2033
Base Year 2024
Estimated Year 2025
Forecast Period2025-2033
Historical Period2019-2024
Growth RateCAGR of 8.67% from 2019-2033
Segmentation
    • By Type
      • Lithium-Ion
      • Nickel-Metal Hydride
      • Lithium-Ion Polymer
      • Sodium-Ion Battery
    • By End-User Application
      • Consumer Electronics
      • Electric Vehicles
      • Energy Storage System
      • Other End-User Applications
  • By Geography
    • North America
      • United States
      • Canada
      • Rest of North America
    • Asia Pacific
      • China
      • India
      • Japan
      • South Korea
      • Rest of Asia Pacific
    • Europe
      • Germany
      • United Kingdom
      • France
      • Italy
      • Rest of Europe
    • South America
      • Chile
      • Brazil
      • Argentina
      • Rest of South America
    • Middle East and Africa
      • Saudi Arabia
      • United Arab Emirates
      • South Africa
      • Egypt
      • Rest of Middle East and Africa


Table of Contents

  1. 1. Introduction
    • 1.1. Research Scope
    • 1.2. Market Segmentation
    • 1.3. Research Methodology
    • 1.4. Definitions and Assumptions
  2. 2. Executive Summary
    • 2.1. Introduction
  3. 3. Market Dynamics
    • 3.1. Introduction
      • 3.2. Market Drivers
        • 3.2.1. 4.; Increasing Demand for Mobile Devices4.; Rising Adaption of Electric Vehicles
      • 3.3. Market Restrains
        • 3.3.1. 4.; Availability of Technical Challenges
      • 3.4. Market Trends
        • 3.4.1. The Electric Vehicle Segment is Expected to Witness Significant Demand
  4. 4. Market Factor Analysis
    • 4.1. Porters Five Forces
    • 4.2. Supply/Value Chain
    • 4.3. PESTEL analysis
    • 4.4. Market Entropy
    • 4.5. Patent/Trademark Analysis
  5. 5. Global Semiconductor Battery Industry Analysis, Insights and Forecast, 2019-2031
    • 5.1. Market Analysis, Insights and Forecast - by Type
      • 5.1.1. Lithium-Ion
      • 5.1.2. Nickel-Metal Hydride
      • 5.1.3. Lithium-Ion Polymer
      • 5.1.4. Sodium-Ion Battery
    • 5.2. Market Analysis, Insights and Forecast - by End-User Application
      • 5.2.1. Consumer Electronics
      • 5.2.2. Electric Vehicles
      • 5.2.3. Energy Storage System
      • 5.2.4. Other End-User Applications
    • 5.3. Market Analysis, Insights and Forecast - by Region
      • 5.3.1. North America
      • 5.3.2. Asia Pacific
      • 5.3.3. Europe
      • 5.3.4. South America
      • 5.3.5. Middle East and Africa
  6. 6. North America Semiconductor Battery Industry Analysis, Insights and Forecast, 2019-2031
    • 6.1. Market Analysis, Insights and Forecast - by Type
      • 6.1.1. Lithium-Ion
      • 6.1.2. Nickel-Metal Hydride
      • 6.1.3. Lithium-Ion Polymer
      • 6.1.4. Sodium-Ion Battery
    • 6.2. Market Analysis, Insights and Forecast - by End-User Application
      • 6.2.1. Consumer Electronics
      • 6.2.2. Electric Vehicles
      • 6.2.3. Energy Storage System
      • 6.2.4. Other End-User Applications
  7. 7. Asia Pacific Semiconductor Battery Industry Analysis, Insights and Forecast, 2019-2031
    • 7.1. Market Analysis, Insights and Forecast - by Type
      • 7.1.1. Lithium-Ion
      • 7.1.2. Nickel-Metal Hydride
      • 7.1.3. Lithium-Ion Polymer
      • 7.1.4. Sodium-Ion Battery
    • 7.2. Market Analysis, Insights and Forecast - by End-User Application
      • 7.2.1. Consumer Electronics
      • 7.2.2. Electric Vehicles
      • 7.2.3. Energy Storage System
      • 7.2.4. Other End-User Applications
  8. 8. Europe Semiconductor Battery Industry Analysis, Insights and Forecast, 2019-2031
    • 8.1. Market Analysis, Insights and Forecast - by Type
      • 8.1.1. Lithium-Ion
      • 8.1.2. Nickel-Metal Hydride
      • 8.1.3. Lithium-Ion Polymer
      • 8.1.4. Sodium-Ion Battery
    • 8.2. Market Analysis, Insights and Forecast - by End-User Application
      • 8.2.1. Consumer Electronics
      • 8.2.2. Electric Vehicles
      • 8.2.3. Energy Storage System
      • 8.2.4. Other End-User Applications
  9. 9. South America Semiconductor Battery Industry Analysis, Insights and Forecast, 2019-2031
    • 9.1. Market Analysis, Insights and Forecast - by Type
      • 9.1.1. Lithium-Ion
      • 9.1.2. Nickel-Metal Hydride
      • 9.1.3. Lithium-Ion Polymer
      • 9.1.4. Sodium-Ion Battery
    • 9.2. Market Analysis, Insights and Forecast - by End-User Application
      • 9.2.1. Consumer Electronics
      • 9.2.2. Electric Vehicles
      • 9.2.3. Energy Storage System
      • 9.2.4. Other End-User Applications
  10. 10. Middle East and Africa Semiconductor Battery Industry Analysis, Insights and Forecast, 2019-2031
    • 10.1. Market Analysis, Insights and Forecast - by Type
      • 10.1.1. Lithium-Ion
      • 10.1.2. Nickel-Metal Hydride
      • 10.1.3. Lithium-Ion Polymer
      • 10.1.4. Sodium-Ion Battery
    • 10.2. Market Analysis, Insights and Forecast - by End-User Application
      • 10.2.1. Consumer Electronics
      • 10.2.2. Electric Vehicles
      • 10.2.3. Energy Storage System
      • 10.2.4. Other End-User Applications
  11. 11. North America Semiconductor Battery Industry Analysis, Insights and Forecast, 2019-2031
      • 11.1. Market Analysis, Insights and Forecast - By Country/Sub-region
        • 11.1.1 United States
        • 11.1.2 Canada
        • 11.1.3 Mexico
  12. 12. Europe Semiconductor Battery Industry Analysis, Insights and Forecast, 2019-2031
      • 12.1. Market Analysis, Insights and Forecast - By Country/Sub-region
        • 12.1.1 Germany
        • 12.1.2 United Kingdom
        • 12.1.3 France
        • 12.1.4 Spain
        • 12.1.5 Italy
        • 12.1.6 Spain
        • 12.1.7 Belgium
        • 12.1.8 Netherland
        • 12.1.9 Nordics
        • 12.1.10 Rest of Europe
  13. 13. Asia Pacific Semiconductor Battery Industry Analysis, Insights and Forecast, 2019-2031
      • 13.1. Market Analysis, Insights and Forecast - By Country/Sub-region
        • 13.1.1 China
        • 13.1.2 Japan
        • 13.1.3 India
        • 13.1.4 South Korea
        • 13.1.5 Southeast Asia
        • 13.1.6 Australia
        • 13.1.7 Indonesia
        • 13.1.8 Phillipes
        • 13.1.9 Singapore
        • 13.1.10 Thailandc
        • 13.1.11 Rest of Asia Pacific
  14. 14. South America Semiconductor Battery Industry Analysis, Insights and Forecast, 2019-2031
      • 14.1. Market Analysis, Insights and Forecast - By Country/Sub-region
        • 14.1.1 Brazil
        • 14.1.2 Argentina
        • 14.1.3 Peru
        • 14.1.4 Chile
        • 14.1.5 Colombia
        • 14.1.6 Ecuador
        • 14.1.7 Venezuela
        • 14.1.8 Rest of South America
  15. 15. MEA Semiconductor Battery Industry Analysis, Insights and Forecast, 2019-2031
      • 15.1. Market Analysis, Insights and Forecast - By Country/Sub-region
        • 15.1.1 United Arab Emirates
        • 15.1.2 Saudi Arabia
        • 15.1.3 South Africa
        • 15.1.4 Rest of Middle East and Africa
  16. 16. Competitive Analysis
    • 16.1. Global Market Share Analysis 2024
      • 16.2. Company Profiles
        • 16.2.1 EnerSys
          • 16.2.1.1. Overview
          • 16.2.1.2. Products
          • 16.2.1.3. SWOT Analysis
          • 16.2.1.4. Recent Developments
          • 16.2.1.5. Financials (Based on Availability)
        • 16.2.2 Samsung SDI Co Ltd
          • 16.2.2.1. Overview
          • 16.2.2.2. Products
          • 16.2.2.3. SWOT Analysis
          • 16.2.2.4. Recent Developments
          • 16.2.2.5. Financials (Based on Availability)
        • 16.2.3 TianJin Lishen Battery Joint-Stock Co Ltd
          • 16.2.3.1. Overview
          • 16.2.3.2. Products
          • 16.2.3.3. SWOT Analysis
          • 16.2.3.4. Recent Developments
          • 16.2.3.5. Financials (Based on Availability)
        • 16.2.4 Varta AG
          • 16.2.4.1. Overview
          • 16.2.4.2. Products
          • 16.2.4.3. SWOT Analysis
          • 16.2.4.4. Recent Developments
          • 16.2.4.5. Financials (Based on Availability)
        • 16.2.5 Toshiba Corporation
          • 16.2.5.1. Overview
          • 16.2.5.2. Products
          • 16.2.5.3. SWOT Analysis
          • 16.2.5.4. Recent Developments
          • 16.2.5.5. Financials (Based on Availability)
        • 16.2.6 Faradion Limited
          • 16.2.6.1. Overview
          • 16.2.6.2. Products
          • 16.2.6.3. SWOT Analysis
          • 16.2.6.4. Recent Developments
          • 16.2.6.5. Financials (Based on Availability)
        • 16.2.7 GS Yuasa Corporation
          • 16.2.7.1. Overview
          • 16.2.7.2. Products
          • 16.2.7.3. SWOT Analysis
          • 16.2.7.4. Recent Developments
          • 16.2.7.5. Financials (Based on Availability)
        • 16.2.8 Routejade
          • 16.2.8.1. Overview
          • 16.2.8.2. Products
          • 16.2.8.3. SWOT Analysis
          • 16.2.8.4. Recent Developments
          • 16.2.8.5. Financials (Based on Availability)
        • 16.2.9 Panasonic Corporation
          • 16.2.9.1. Overview
          • 16.2.9.2. Products
          • 16.2.9.3. SWOT Analysis
          • 16.2.9.4. Recent Developments
          • 16.2.9.5. Financials (Based on Availability)
        • 16.2.10 Sony Corporation
          • 16.2.10.1. Overview
          • 16.2.10.2. Products
          • 16.2.10.3. SWOT Analysis
          • 16.2.10.4. Recent Developments
          • 16.2.10.5. Financials (Based on Availability)

List of Figures

  1. Figure 1: Global Semiconductor Battery Industry Revenue Breakdown (Million, %) by Region 2024 & 2032
  2. Figure 2: Global Semiconductor Battery Industry Volume Breakdown (K Unit, %) by Region 2024 & 2032
  3. Figure 3: North America Semiconductor Battery Industry Revenue (Million), by Country 2024 & 2032
  4. Figure 4: North America Semiconductor Battery Industry Volume (K Unit), by Country 2024 & 2032
  5. Figure 5: North America Semiconductor Battery Industry Revenue Share (%), by Country 2024 & 2032
  6. Figure 6: North America Semiconductor Battery Industry Volume Share (%), by Country 2024 & 2032
  7. Figure 7: Europe Semiconductor Battery Industry Revenue (Million), by Country 2024 & 2032
  8. Figure 8: Europe Semiconductor Battery Industry Volume (K Unit), by Country 2024 & 2032
  9. Figure 9: Europe Semiconductor Battery Industry Revenue Share (%), by Country 2024 & 2032
  10. Figure 10: Europe Semiconductor Battery Industry Volume Share (%), by Country 2024 & 2032
  11. Figure 11: Asia Pacific Semiconductor Battery Industry Revenue (Million), by Country 2024 & 2032
  12. Figure 12: Asia Pacific Semiconductor Battery Industry Volume (K Unit), by Country 2024 & 2032
  13. Figure 13: Asia Pacific Semiconductor Battery Industry Revenue Share (%), by Country 2024 & 2032
  14. Figure 14: Asia Pacific Semiconductor Battery Industry Volume Share (%), by Country 2024 & 2032
  15. Figure 15: South America Semiconductor Battery Industry Revenue (Million), by Country 2024 & 2032
  16. Figure 16: South America Semiconductor Battery Industry Volume (K Unit), by Country 2024 & 2032
  17. Figure 17: South America Semiconductor Battery Industry Revenue Share (%), by Country 2024 & 2032
  18. Figure 18: South America Semiconductor Battery Industry Volume Share (%), by Country 2024 & 2032
  19. Figure 19: MEA Semiconductor Battery Industry Revenue (Million), by Country 2024 & 2032
  20. Figure 20: MEA Semiconductor Battery Industry Volume (K Unit), by Country 2024 & 2032
  21. Figure 21: MEA Semiconductor Battery Industry Revenue Share (%), by Country 2024 & 2032
  22. Figure 22: MEA Semiconductor Battery Industry Volume Share (%), by Country 2024 & 2032
  23. Figure 23: North America Semiconductor Battery Industry Revenue (Million), by Type 2024 & 2032
  24. Figure 24: North America Semiconductor Battery Industry Volume (K Unit), by Type 2024 & 2032
  25. Figure 25: North America Semiconductor Battery Industry Revenue Share (%), by Type 2024 & 2032
  26. Figure 26: North America Semiconductor Battery Industry Volume Share (%), by Type 2024 & 2032
  27. Figure 27: North America Semiconductor Battery Industry Revenue (Million), by End-User Application 2024 & 2032
  28. Figure 28: North America Semiconductor Battery Industry Volume (K Unit), by End-User Application 2024 & 2032
  29. Figure 29: North America Semiconductor Battery Industry Revenue Share (%), by End-User Application 2024 & 2032
  30. Figure 30: North America Semiconductor Battery Industry Volume Share (%), by End-User Application 2024 & 2032
  31. Figure 31: North America Semiconductor Battery Industry Revenue (Million), by Country 2024 & 2032
  32. Figure 32: North America Semiconductor Battery Industry Volume (K Unit), by Country 2024 & 2032
  33. Figure 33: North America Semiconductor Battery Industry Revenue Share (%), by Country 2024 & 2032
  34. Figure 34: North America Semiconductor Battery Industry Volume Share (%), by Country 2024 & 2032
  35. Figure 35: Asia Pacific Semiconductor Battery Industry Revenue (Million), by Type 2024 & 2032
  36. Figure 36: Asia Pacific Semiconductor Battery Industry Volume (K Unit), by Type 2024 & 2032
  37. Figure 37: Asia Pacific Semiconductor Battery Industry Revenue Share (%), by Type 2024 & 2032
  38. Figure 38: Asia Pacific Semiconductor Battery Industry Volume Share (%), by Type 2024 & 2032
  39. Figure 39: Asia Pacific Semiconductor Battery Industry Revenue (Million), by End-User Application 2024 & 2032
  40. Figure 40: Asia Pacific Semiconductor Battery Industry Volume (K Unit), by End-User Application 2024 & 2032
  41. Figure 41: Asia Pacific Semiconductor Battery Industry Revenue Share (%), by End-User Application 2024 & 2032
  42. Figure 42: Asia Pacific Semiconductor Battery Industry Volume Share (%), by End-User Application 2024 & 2032
  43. Figure 43: Asia Pacific Semiconductor Battery Industry Revenue (Million), by Country 2024 & 2032
  44. Figure 44: Asia Pacific Semiconductor Battery Industry Volume (K Unit), by Country 2024 & 2032
  45. Figure 45: Asia Pacific Semiconductor Battery Industry Revenue Share (%), by Country 2024 & 2032
  46. Figure 46: Asia Pacific Semiconductor Battery Industry Volume Share (%), by Country 2024 & 2032
  47. Figure 47: Europe Semiconductor Battery Industry Revenue (Million), by Type 2024 & 2032
  48. Figure 48: Europe Semiconductor Battery Industry Volume (K Unit), by Type 2024 & 2032
  49. Figure 49: Europe Semiconductor Battery Industry Revenue Share (%), by Type 2024 & 2032
  50. Figure 50: Europe Semiconductor Battery Industry Volume Share (%), by Type 2024 & 2032
  51. Figure 51: Europe Semiconductor Battery Industry Revenue (Million), by End-User Application 2024 & 2032
  52. Figure 52: Europe Semiconductor Battery Industry Volume (K Unit), by End-User Application 2024 & 2032
  53. Figure 53: Europe Semiconductor Battery Industry Revenue Share (%), by End-User Application 2024 & 2032
  54. Figure 54: Europe Semiconductor Battery Industry Volume Share (%), by End-User Application 2024 & 2032
  55. Figure 55: Europe Semiconductor Battery Industry Revenue (Million), by Country 2024 & 2032
  56. Figure 56: Europe Semiconductor Battery Industry Volume (K Unit), by Country 2024 & 2032
  57. Figure 57: Europe Semiconductor Battery Industry Revenue Share (%), by Country 2024 & 2032
  58. Figure 58: Europe Semiconductor Battery Industry Volume Share (%), by Country 2024 & 2032
  59. Figure 59: South America Semiconductor Battery Industry Revenue (Million), by Type 2024 & 2032
  60. Figure 60: South America Semiconductor Battery Industry Volume (K Unit), by Type 2024 & 2032
  61. Figure 61: South America Semiconductor Battery Industry Revenue Share (%), by Type 2024 & 2032
  62. Figure 62: South America Semiconductor Battery Industry Volume Share (%), by Type 2024 & 2032
  63. Figure 63: South America Semiconductor Battery Industry Revenue (Million), by End-User Application 2024 & 2032
  64. Figure 64: South America Semiconductor Battery Industry Volume (K Unit), by End-User Application 2024 & 2032
  65. Figure 65: South America Semiconductor Battery Industry Revenue Share (%), by End-User Application 2024 & 2032
  66. Figure 66: South America Semiconductor Battery Industry Volume Share (%), by End-User Application 2024 & 2032
  67. Figure 67: South America Semiconductor Battery Industry Revenue (Million), by Country 2024 & 2032
  68. Figure 68: South America Semiconductor Battery Industry Volume (K Unit), by Country 2024 & 2032
  69. Figure 69: South America Semiconductor Battery Industry Revenue Share (%), by Country 2024 & 2032
  70. Figure 70: South America Semiconductor Battery Industry Volume Share (%), by Country 2024 & 2032
  71. Figure 71: Middle East and Africa Semiconductor Battery Industry Revenue (Million), by Type 2024 & 2032
  72. Figure 72: Middle East and Africa Semiconductor Battery Industry Volume (K Unit), by Type 2024 & 2032
  73. Figure 73: Middle East and Africa Semiconductor Battery Industry Revenue Share (%), by Type 2024 & 2032
  74. Figure 74: Middle East and Africa Semiconductor Battery Industry Volume Share (%), by Type 2024 & 2032
  75. Figure 75: Middle East and Africa Semiconductor Battery Industry Revenue (Million), by End-User Application 2024 & 2032
  76. Figure 76: Middle East and Africa Semiconductor Battery Industry Volume (K Unit), by End-User Application 2024 & 2032
  77. Figure 77: Middle East and Africa Semiconductor Battery Industry Revenue Share (%), by End-User Application 2024 & 2032
  78. Figure 78: Middle East and Africa Semiconductor Battery Industry Volume Share (%), by End-User Application 2024 & 2032
  79. Figure 79: Middle East and Africa Semiconductor Battery Industry Revenue (Million), by Country 2024 & 2032
  80. Figure 80: Middle East and Africa Semiconductor Battery Industry Volume (K Unit), by Country 2024 & 2032
  81. Figure 81: Middle East and Africa Semiconductor Battery Industry Revenue Share (%), by Country 2024 & 2032
  82. Figure 82: Middle East and Africa Semiconductor Battery Industry Volume Share (%), by Country 2024 & 2032

List of Tables

  1. Table 1: Global Semiconductor Battery Industry Revenue Million Forecast, by Region 2019 & 2032
  2. Table 2: Global Semiconductor Battery Industry Volume K Unit Forecast, by Region 2019 & 2032
  3. Table 3: Global Semiconductor Battery Industry Revenue Million Forecast, by Type 2019 & 2032
  4. Table 4: Global Semiconductor Battery Industry Volume K Unit Forecast, by Type 2019 & 2032
  5. Table 5: Global Semiconductor Battery Industry Revenue Million Forecast, by End-User Application 2019 & 2032
  6. Table 6: Global Semiconductor Battery Industry Volume K Unit Forecast, by End-User Application 2019 & 2032
  7. Table 7: Global Semiconductor Battery Industry Revenue Million Forecast, by Region 2019 & 2032
  8. Table 8: Global Semiconductor Battery Industry Volume K Unit Forecast, by Region 2019 & 2032
  9. Table 9: Global Semiconductor Battery Industry Revenue Million Forecast, by Country 2019 & 2032
  10. Table 10: Global Semiconductor Battery Industry Volume K Unit Forecast, by Country 2019 & 2032
  11. Table 11: United States Semiconductor Battery Industry Revenue (Million) Forecast, by Application 2019 & 2032
  12. Table 12: United States Semiconductor Battery Industry Volume (K Unit) Forecast, by Application 2019 & 2032
  13. Table 13: Canada Semiconductor Battery Industry Revenue (Million) Forecast, by Application 2019 & 2032
  14. Table 14: Canada Semiconductor Battery Industry Volume (K Unit) Forecast, by Application 2019 & 2032
  15. Table 15: Mexico Semiconductor Battery Industry Revenue (Million) Forecast, by Application 2019 & 2032
  16. Table 16: Mexico Semiconductor Battery Industry Volume (K Unit) Forecast, by Application 2019 & 2032
  17. Table 17: Global Semiconductor Battery Industry Revenue Million Forecast, by Country 2019 & 2032
  18. Table 18: Global Semiconductor Battery Industry Volume K Unit Forecast, by Country 2019 & 2032
  19. Table 19: Germany Semiconductor Battery Industry Revenue (Million) Forecast, by Application 2019 & 2032
  20. Table 20: Germany Semiconductor Battery Industry Volume (K Unit) Forecast, by Application 2019 & 2032
  21. Table 21: United Kingdom Semiconductor Battery Industry Revenue (Million) Forecast, by Application 2019 & 2032
  22. Table 22: United Kingdom Semiconductor Battery Industry Volume (K Unit) Forecast, by Application 2019 & 2032
  23. Table 23: France Semiconductor Battery Industry Revenue (Million) Forecast, by Application 2019 & 2032
  24. Table 24: France Semiconductor Battery Industry Volume (K Unit) Forecast, by Application 2019 & 2032
  25. Table 25: Spain Semiconductor Battery Industry Revenue (Million) Forecast, by Application 2019 & 2032
  26. Table 26: Spain Semiconductor Battery Industry Volume (K Unit) Forecast, by Application 2019 & 2032
  27. Table 27: Italy Semiconductor Battery Industry Revenue (Million) Forecast, by Application 2019 & 2032
  28. Table 28: Italy Semiconductor Battery Industry Volume (K Unit) Forecast, by Application 2019 & 2032
  29. Table 29: Spain Semiconductor Battery Industry Revenue (Million) Forecast, by Application 2019 & 2032
  30. Table 30: Spain Semiconductor Battery Industry Volume (K Unit) Forecast, by Application 2019 & 2032
  31. Table 31: Belgium Semiconductor Battery Industry Revenue (Million) Forecast, by Application 2019 & 2032
  32. Table 32: Belgium Semiconductor Battery Industry Volume (K Unit) Forecast, by Application 2019 & 2032
  33. Table 33: Netherland Semiconductor Battery Industry Revenue (Million) Forecast, by Application 2019 & 2032
  34. Table 34: Netherland Semiconductor Battery Industry Volume (K Unit) Forecast, by Application 2019 & 2032
  35. Table 35: Nordics Semiconductor Battery Industry Revenue (Million) Forecast, by Application 2019 & 2032
  36. Table 36: Nordics Semiconductor Battery Industry Volume (K Unit) Forecast, by Application 2019 & 2032
  37. Table 37: Rest of Europe Semiconductor Battery Industry Revenue (Million) Forecast, by Application 2019 & 2032
  38. Table 38: Rest of Europe Semiconductor Battery Industry Volume (K Unit) Forecast, by Application 2019 & 2032
  39. Table 39: Global Semiconductor Battery Industry Revenue Million Forecast, by Country 2019 & 2032
  40. Table 40: Global Semiconductor Battery Industry Volume K Unit Forecast, by Country 2019 & 2032
  41. Table 41: China Semiconductor Battery Industry Revenue (Million) Forecast, by Application 2019 & 2032
  42. Table 42: China Semiconductor Battery Industry Volume (K Unit) Forecast, by Application 2019 & 2032
  43. Table 43: Japan Semiconductor Battery Industry Revenue (Million) Forecast, by Application 2019 & 2032
  44. Table 44: Japan Semiconductor Battery Industry Volume (K Unit) Forecast, by Application 2019 & 2032
  45. Table 45: India Semiconductor Battery Industry Revenue (Million) Forecast, by Application 2019 & 2032
  46. Table 46: India Semiconductor Battery Industry Volume (K Unit) Forecast, by Application 2019 & 2032
  47. Table 47: South Korea Semiconductor Battery Industry Revenue (Million) Forecast, by Application 2019 & 2032
  48. Table 48: South Korea Semiconductor Battery Industry Volume (K Unit) Forecast, by Application 2019 & 2032
  49. Table 49: Southeast Asia Semiconductor Battery Industry Revenue (Million) Forecast, by Application 2019 & 2032
  50. Table 50: Southeast Asia Semiconductor Battery Industry Volume (K Unit) Forecast, by Application 2019 & 2032
  51. Table 51: Australia Semiconductor Battery Industry Revenue (Million) Forecast, by Application 2019 & 2032
  52. Table 52: Australia Semiconductor Battery Industry Volume (K Unit) Forecast, by Application 2019 & 2032
  53. Table 53: Indonesia Semiconductor Battery Industry Revenue (Million) Forecast, by Application 2019 & 2032
  54. Table 54: Indonesia Semiconductor Battery Industry Volume (K Unit) Forecast, by Application 2019 & 2032
  55. Table 55: Phillipes Semiconductor Battery Industry Revenue (Million) Forecast, by Application 2019 & 2032
  56. Table 56: Phillipes Semiconductor Battery Industry Volume (K Unit) Forecast, by Application 2019 & 2032
  57. Table 57: Singapore Semiconductor Battery Industry Revenue (Million) Forecast, by Application 2019 & 2032
  58. Table 58: Singapore Semiconductor Battery Industry Volume (K Unit) Forecast, by Application 2019 & 2032
  59. Table 59: Thailandc Semiconductor Battery Industry Revenue (Million) Forecast, by Application 2019 & 2032
  60. Table 60: Thailandc Semiconductor Battery Industry Volume (K Unit) Forecast, by Application 2019 & 2032
  61. Table 61: Rest of Asia Pacific Semiconductor Battery Industry Revenue (Million) Forecast, by Application 2019 & 2032
  62. Table 62: Rest of Asia Pacific Semiconductor Battery Industry Volume (K Unit) Forecast, by Application 2019 & 2032
  63. Table 63: Global Semiconductor Battery Industry Revenue Million Forecast, by Country 2019 & 2032
  64. Table 64: Global Semiconductor Battery Industry Volume K Unit Forecast, by Country 2019 & 2032
  65. Table 65: Brazil Semiconductor Battery Industry Revenue (Million) Forecast, by Application 2019 & 2032
  66. Table 66: Brazil Semiconductor Battery Industry Volume (K Unit) Forecast, by Application 2019 & 2032
  67. Table 67: Argentina Semiconductor Battery Industry Revenue (Million) Forecast, by Application 2019 & 2032
  68. Table 68: Argentina Semiconductor Battery Industry Volume (K Unit) Forecast, by Application 2019 & 2032
  69. Table 69: Peru Semiconductor Battery Industry Revenue (Million) Forecast, by Application 2019 & 2032
  70. Table 70: Peru Semiconductor Battery Industry Volume (K Unit) Forecast, by Application 2019 & 2032
  71. Table 71: Chile Semiconductor Battery Industry Revenue (Million) Forecast, by Application 2019 & 2032
  72. Table 72: Chile Semiconductor Battery Industry Volume (K Unit) Forecast, by Application 2019 & 2032
  73. Table 73: Colombia Semiconductor Battery Industry Revenue (Million) Forecast, by Application 2019 & 2032
  74. Table 74: Colombia Semiconductor Battery Industry Volume (K Unit) Forecast, by Application 2019 & 2032
  75. Table 75: Ecuador Semiconductor Battery Industry Revenue (Million) Forecast, by Application 2019 & 2032
  76. Table 76: Ecuador Semiconductor Battery Industry Volume (K Unit) Forecast, by Application 2019 & 2032
  77. Table 77: Venezuela Semiconductor Battery Industry Revenue (Million) Forecast, by Application 2019 & 2032
  78. Table 78: Venezuela Semiconductor Battery Industry Volume (K Unit) Forecast, by Application 2019 & 2032
  79. Table 79: Rest of South America Semiconductor Battery Industry Revenue (Million) Forecast, by Application 2019 & 2032
  80. Table 80: Rest of South America Semiconductor Battery Industry Volume (K Unit) Forecast, by Application 2019 & 2032
  81. Table 81: Global Semiconductor Battery Industry Revenue Million Forecast, by Country 2019 & 2032
  82. Table 82: Global Semiconductor Battery Industry Volume K Unit Forecast, by Country 2019 & 2032
  83. Table 83: United Arab Emirates Semiconductor Battery Industry Revenue (Million) Forecast, by Application 2019 & 2032
  84. Table 84: United Arab Emirates Semiconductor Battery Industry Volume (K Unit) Forecast, by Application 2019 & 2032
  85. Table 85: Saudi Arabia Semiconductor Battery Industry Revenue (Million) Forecast, by Application 2019 & 2032
  86. Table 86: Saudi Arabia Semiconductor Battery Industry Volume (K Unit) Forecast, by Application 2019 & 2032
  87. Table 87: South Africa Semiconductor Battery Industry Revenue (Million) Forecast, by Application 2019 & 2032
  88. Table 88: South Africa Semiconductor Battery Industry Volume (K Unit) Forecast, by Application 2019 & 2032
  89. Table 89: Rest of Middle East and Africa Semiconductor Battery Industry Revenue (Million) Forecast, by Application 2019 & 2032
  90. Table 90: Rest of Middle East and Africa Semiconductor Battery Industry Volume (K Unit) Forecast, by Application 2019 & 2032
  91. Table 91: Global Semiconductor Battery Industry Revenue Million Forecast, by Type 2019 & 2032
  92. Table 92: Global Semiconductor Battery Industry Volume K Unit Forecast, by Type 2019 & 2032
  93. Table 93: Global Semiconductor Battery Industry Revenue Million Forecast, by End-User Application 2019 & 2032
  94. Table 94: Global Semiconductor Battery Industry Volume K Unit Forecast, by End-User Application 2019 & 2032
  95. Table 95: Global Semiconductor Battery Industry Revenue Million Forecast, by Country 2019 & 2032
  96. Table 96: Global Semiconductor Battery Industry Volume K Unit Forecast, by Country 2019 & 2032
  97. Table 97: United States Semiconductor Battery Industry Revenue (Million) Forecast, by Application 2019 & 2032
  98. Table 98: United States Semiconductor Battery Industry Volume (K Unit) Forecast, by Application 2019 & 2032
  99. Table 99: Canada Semiconductor Battery Industry Revenue (Million) Forecast, by Application 2019 & 2032
  100. Table 100: Canada Semiconductor Battery Industry Volume (K Unit) Forecast, by Application 2019 & 2032
  101. Table 101: Rest of North America Semiconductor Battery Industry Revenue (Million) Forecast, by Application 2019 & 2032
  102. Table 102: Rest of North America Semiconductor Battery Industry Volume (K Unit) Forecast, by Application 2019 & 2032
  103. Table 103: Global Semiconductor Battery Industry Revenue Million Forecast, by Type 2019 & 2032
  104. Table 104: Global Semiconductor Battery Industry Volume K Unit Forecast, by Type 2019 & 2032
  105. Table 105: Global Semiconductor Battery Industry Revenue Million Forecast, by End-User Application 2019 & 2032
  106. Table 106: Global Semiconductor Battery Industry Volume K Unit Forecast, by End-User Application 2019 & 2032
  107. Table 107: Global Semiconductor Battery Industry Revenue Million Forecast, by Country 2019 & 2032
  108. Table 108: Global Semiconductor Battery Industry Volume K Unit Forecast, by Country 2019 & 2032
  109. Table 109: China Semiconductor Battery Industry Revenue (Million) Forecast, by Application 2019 & 2032
  110. Table 110: China Semiconductor Battery Industry Volume (K Unit) Forecast, by Application 2019 & 2032
  111. Table 111: India Semiconductor Battery Industry Revenue (Million) Forecast, by Application 2019 & 2032
  112. Table 112: India Semiconductor Battery Industry Volume (K Unit) Forecast, by Application 2019 & 2032
  113. Table 113: Japan Semiconductor Battery Industry Revenue (Million) Forecast, by Application 2019 & 2032
  114. Table 114: Japan Semiconductor Battery Industry Volume (K Unit) Forecast, by Application 2019 & 2032
  115. Table 115: South Korea Semiconductor Battery Industry Revenue (Million) Forecast, by Application 2019 & 2032
  116. Table 116: South Korea Semiconductor Battery Industry Volume (K Unit) Forecast, by Application 2019 & 2032
  117. Table 117: Rest of Asia Pacific Semiconductor Battery Industry Revenue (Million) Forecast, by Application 2019 & 2032
  118. Table 118: Rest of Asia Pacific Semiconductor Battery Industry Volume (K Unit) Forecast, by Application 2019 & 2032
  119. Table 119: Global Semiconductor Battery Industry Revenue Million Forecast, by Type 2019 & 2032
  120. Table 120: Global Semiconductor Battery Industry Volume K Unit Forecast, by Type 2019 & 2032
  121. Table 121: Global Semiconductor Battery Industry Revenue Million Forecast, by End-User Application 2019 & 2032
  122. Table 122: Global Semiconductor Battery Industry Volume K Unit Forecast, by End-User Application 2019 & 2032
  123. Table 123: Global Semiconductor Battery Industry Revenue Million Forecast, by Country 2019 & 2032
  124. Table 124: Global Semiconductor Battery Industry Volume K Unit Forecast, by Country 2019 & 2032
  125. Table 125: Germany Semiconductor Battery Industry Revenue (Million) Forecast, by Application 2019 & 2032
  126. Table 126: Germany Semiconductor Battery Industry Volume (K Unit) Forecast, by Application 2019 & 2032
  127. Table 127: United Kingdom Semiconductor Battery Industry Revenue (Million) Forecast, by Application 2019 & 2032
  128. Table 128: United Kingdom Semiconductor Battery Industry Volume (K Unit) Forecast, by Application 2019 & 2032
  129. Table 129: France Semiconductor Battery Industry Revenue (Million) Forecast, by Application 2019 & 2032
  130. Table 130: France Semiconductor Battery Industry Volume (K Unit) Forecast, by Application 2019 & 2032
  131. Table 131: Italy Semiconductor Battery Industry Revenue (Million) Forecast, by Application 2019 & 2032
  132. Table 132: Italy Semiconductor Battery Industry Volume (K Unit) Forecast, by Application 2019 & 2032
  133. Table 133: Rest of Europe Semiconductor Battery Industry Revenue (Million) Forecast, by Application 2019 & 2032
  134. Table 134: Rest of Europe Semiconductor Battery Industry Volume (K Unit) Forecast, by Application 2019 & 2032
  135. Table 135: Global Semiconductor Battery Industry Revenue Million Forecast, by Type 2019 & 2032
  136. Table 136: Global Semiconductor Battery Industry Volume K Unit Forecast, by Type 2019 & 2032
  137. Table 137: Global Semiconductor Battery Industry Revenue Million Forecast, by End-User Application 2019 & 2032
  138. Table 138: Global Semiconductor Battery Industry Volume K Unit Forecast, by End-User Application 2019 & 2032
  139. Table 139: Global Semiconductor Battery Industry Revenue Million Forecast, by Country 2019 & 2032
  140. Table 140: Global Semiconductor Battery Industry Volume K Unit Forecast, by Country 2019 & 2032
  141. Table 141: Chile Semiconductor Battery Industry Revenue (Million) Forecast, by Application 2019 & 2032
  142. Table 142: Chile Semiconductor Battery Industry Volume (K Unit) Forecast, by Application 2019 & 2032
  143. Table 143: Brazil Semiconductor Battery Industry Revenue (Million) Forecast, by Application 2019 & 2032
  144. Table 144: Brazil Semiconductor Battery Industry Volume (K Unit) Forecast, by Application 2019 & 2032
  145. Table 145: Argentina Semiconductor Battery Industry Revenue (Million) Forecast, by Application 2019 & 2032
  146. Table 146: Argentina Semiconductor Battery Industry Volume (K Unit) Forecast, by Application 2019 & 2032
  147. Table 147: Rest of South America Semiconductor Battery Industry Revenue (Million) Forecast, by Application 2019 & 2032
  148. Table 148: Rest of South America Semiconductor Battery Industry Volume (K Unit) Forecast, by Application 2019 & 2032
  149. Table 149: Global Semiconductor Battery Industry Revenue Million Forecast, by Type 2019 & 2032
  150. Table 150: Global Semiconductor Battery Industry Volume K Unit Forecast, by Type 2019 & 2032
  151. Table 151: Global Semiconductor Battery Industry Revenue Million Forecast, by End-User Application 2019 & 2032
  152. Table 152: Global Semiconductor Battery Industry Volume K Unit Forecast, by End-User Application 2019 & 2032
  153. Table 153: Global Semiconductor Battery Industry Revenue Million Forecast, by Country 2019 & 2032
  154. Table 154: Global Semiconductor Battery Industry Volume K Unit Forecast, by Country 2019 & 2032
  155. Table 155: Saudi Arabia Semiconductor Battery Industry Revenue (Million) Forecast, by Application 2019 & 2032
  156. Table 156: Saudi Arabia Semiconductor Battery Industry Volume (K Unit) Forecast, by Application 2019 & 2032
  157. Table 157: United Arab Emirates Semiconductor Battery Industry Revenue (Million) Forecast, by Application 2019 & 2032
  158. Table 158: United Arab Emirates Semiconductor Battery Industry Volume (K Unit) Forecast, by Application 2019 & 2032
  159. Table 159: South Africa Semiconductor Battery Industry Revenue (Million) Forecast, by Application 2019 & 2032
  160. Table 160: South Africa Semiconductor Battery Industry Volume (K Unit) Forecast, by Application 2019 & 2032
  161. Table 161: Egypt Semiconductor Battery Industry Revenue (Million) Forecast, by Application 2019 & 2032
  162. Table 162: Egypt Semiconductor Battery Industry Volume (K Unit) Forecast, by Application 2019 & 2032
  163. Table 163: Rest of Middle East and Africa Semiconductor Battery Industry Revenue (Million) Forecast, by Application 2019 & 2032
  164. Table 164: Rest of Middle East and Africa Semiconductor Battery Industry Volume (K Unit) Forecast, by Application 2019 & 2032


Frequently Asked Questions

1. What is the projected Compound Annual Growth Rate (CAGR) of the Semiconductor Battery Industry?

The projected CAGR is approximately 8.67%.

2. Which companies are prominent players in the Semiconductor Battery Industry?

Key companies in the market include EnerSys, Samsung SDI Co Ltd, TianJin Lishen Battery Joint-Stock Co Ltd, Varta AG, Toshiba Corporation, Faradion Limited, GS Yuasa Corporation, Routejade, Panasonic Corporation, Sony Corporation.

3. What are the main segments of the Semiconductor Battery Industry?

The market segments include Type, End-User Application.

4. Can you provide details about the market size?

The market size is estimated to be USD 13.19 Million as of 2022.

5. What are some drivers contributing to market growth?

4.; Increasing Demand for Mobile Devices4.; Rising Adaption of Electric Vehicles.

6. What are the notable trends driving market growth?

The Electric Vehicle Segment is Expected to Witness Significant Demand.

7. Are there any restraints impacting market growth?

4.; Availability of Technical Challenges.

8. Can you provide examples of recent developments in the market?

February 2022: ROHM Semiconductor announced that the company developed a new evaluation board for ultra-efficient semiconductor battery operations for the newly developed Internet of Things devices called REFLVBMS001-EVK-001.

9. What pricing options are available for accessing the report?

Pricing options include single-user, multi-user, and enterprise licenses priced at USD 4750, USD 5250, and USD 8750 respectively.

10. Is the market size provided in terms of value or volume?

The market size is provided in terms of value, measured in Million and volume, measured in K Unit.

11. Are there any specific market keywords associated with the report?

Yes, the market keyword associated with the report is "Semiconductor Battery Industry," which aids in identifying and referencing the specific market segment covered.

12. How do I determine which pricing option suits my needs best?

The pricing options vary based on user requirements and access needs. Individual users may opt for single-user licenses, while businesses requiring broader access may choose multi-user or enterprise licenses for cost-effective access to the report.

13. Are there any additional resources or data provided in the Semiconductor Battery Industry report?

While the report offers comprehensive insights, it's advisable to review the specific contents or supplementary materials provided to ascertain if additional resources or data are available.

14. How can I stay updated on further developments or reports in the Semiconductor Battery Industry?

To stay informed about further developments, trends, and reports in the Semiconductor Battery Industry, consider subscribing to industry newsletters, following relevant companies and organizations, or regularly checking reputable industry news sources and publications.


Methodology

Step 1 - Identification of Relevant Samples Size from Population Database

Step Chart
Bar Chart
Method Chart

Step 2 - Approaches for Defining Global Market Size (Value, Volume* & Price*)

Approach Chart
Top-down and bottom-up approaches are used to validate the global market size and estimate the market size for manufactures, regional segments, product, and application.

Note*: In applicable scenarios

Step 3 - Data Sources

Primary Research

  • Web Analytics
  • Survey Reports
  • Research Institute
  • Latest Research Reports
  • Opinion Leaders

Secondary Research

  • Annual Reports
  • White Paper
  • Latest Press Release
  • Industry Association
  • Paid Database
  • Investor Presentations
Analyst Chart

Step 4 - Data Triangulation

Involves using different sources of information in order to increase the validity of a study

These sources are likely to be stakeholders in a program - participants, other researchers, program staff, other community members, and so on.

Then we put all data in single framework & apply various statistical tools to find out the dynamic on the market.

During the analysis stage, feedback from the stakeholder groups would be compared to determine areas of agreement as well as areas of divergence

Additionally, after gathering mixed and scattered data from a wide range of sources, data is triangulated and correlated to come up with estimated figures which are further validated through primary mediums or industry experts, opinion leaders.

About Report Pinnacle

Report Pinnacle provides top-tier market research, industry intelligence, and actionable insights for finance, technology, healthcare, and consumer sectors. Our reports empower you to make informed decisions and achieve business success.

Our expert team combines primary research, data analytics, and industry knowledge to deliver insights you can trust. We offer syndicated reports, custom research, and consulting services tailored to your unique business needs.

At Report Pinnacle, we are committed to quality, transparency, and client satisfaction. Every report is rigorously validated to ensure accuracy and relevance. Our global perspective and local expertise help you understand both broad trends and detailed market shifts.

Stay ahead with Report Pinnacle. Subscribe to our newsletter for the latest insights and research highlights, and follow us on social media for real-time updates.

Report Pinnacle – Your Partner for Reaching the Top in Market Intelligence.

artwork spiralartwork spiralRelated Reports
artwork underline

Asia-Pacific Coal Market Strategic Dynamics: Competitor Analysis 2025-2033

Discover the latest insights on the booming Asia-Pacific coal market. This comprehensive analysis reveals a CAGR exceeding 3%, driven by energy demand in China and India, yet facing constraints from environmental regulations. Explore market segmentation, key players, and future growth projections until 2033.

September 2025
Base Year: 2024
No Of Pages: 234
Price: $4750

Consumer Trends in Power Market in Japan Market 2025-2033

Discover the dynamic Japanese power market forecast to 2033, analyzing its 1.27% CAGR, key players (Tokyo Electric Power, Kansai Electric Power, etc.), growth drivers, and regional trends. Explore the shift towards renewables and the challenges impacting this vital sector.

September 2025
Base Year: 2024
No Of Pages: 197
Price: $3800

Air Quality Monitoring Device Market Strategic Insights: Analysis 2025 and Forecasts 2033

The Air Quality Monitoring Device market is booming, projected to reach \$5.08 billion by 2025, with a 5.79% CAGR. Driven by stricter regulations, technological advancements, and growing environmental concerns, this market offers lucrative opportunities across residential, commercial, and industrial sectors. Explore key trends, market segments, and leading companies shaping this dynamic landscape.

September 2025
Base Year: 2024
No Of Pages: 234
Price: $4750

PDC Drill Bits Industry Navigating Dynamics Comprehensive Analysis and Forecasts 2025-2033

The global PDC drill bit market is booming, with a CAGR exceeding 4% and a projected value exceeding $7 billion by 2033. Driven by oil & gas exploration, technological advancements, and unconventional resource development, this market analysis explores key trends, segments (matrix body, steel body, onshore/offshore), and leading companies like Schlumberger and Halliburton.

August 2025
Base Year: 2024
No Of Pages: 234
Price: $4750

South America Pumped Hydro Storage Market Growth Projections: Trends to Watch

Discover the booming South American Pumped Hydro Storage market! This comprehensive analysis reveals a CAGR of 5.40% through 2033, driven by renewable energy growth and government initiatives. Explore market size, segmentation, key players, and challenges in Brazil, Argentina, Colombia, and beyond.

August 2025
Base Year: 2024
No Of Pages: 234
Price: $4750

India Micro Batteries Market 2025 Trends and Forecasts 2033: Analyzing Growth Opportunities

Discover the booming India micro batteries market! Projected to reach $80.64 million by 2033 with a 17.09% CAGR, this report analyzes key drivers, trends, restraints, and leading companies across segments like lithium-ion and automotive applications. Get insights into regional market share and future growth potential.

August 2025
Base Year: 2024
No Of Pages: 180
Price: $3800

South Korea Smart Grid Technology Market Market’s Evolution: Key Growth Drivers 2025-2033

Discover the booming South Korea smart grid technology market! This comprehensive analysis reveals market size, CAGR, key drivers, trends, and restraints, along with insights into leading companies and regional growth projections through 2033. Explore the impact of smart meters, smart grid software, and renewable energy integration on the future of energy in South Korea.

August 2025
Base Year: 2024
No Of Pages: 197
Price: $3800

Middle-East Enhanced Oil Recovery Market Trends and Forecasts: Comprehensive Insights

Discover the booming Middle East Enhanced Oil Recovery (EOR) market! This report analyzes market size, growth (CAGR >6%), key drivers, trends, and regional breakdowns (Saudi Arabia, UAE, etc.), featuring leading companies and innovative techniques like thermal, gas, and chemical injection. Explore the opportunities and challenges in this lucrative sector projected to reach [estimated 2033 market size] by 2033.

August 2025
Base Year: 2024
No Of Pages: 234
Price: $4750

Nuclear Power Reactor Decommissioning Market Growth Forecast and Consumer Insights

The global Nuclear Power Reactor Decommissioning market is booming, with a 13.80% CAGR. Explore market trends, key players (Aecom, Orano, Westinghouse), regional insights, and future projections for this rapidly expanding sector. Learn about the challenges and opportunities in nuclear plant dismantling and waste management.

August 2025
Base Year: 2024
No Of Pages: 234
Price: $4750

Middle East and Africa Compressor Industry Strategic Market Opportunities: Trends 2025-2033

The Middle East & Africa compressor market is booming, projected to surpass $5.25 billion by 2033, driven by oil & gas, manufacturing, and power sectors. Discover key trends, regional insights, and leading companies shaping this dynamic industry.

August 2025
Base Year: 2024
No Of Pages: 234
Price: $4750

Japan Combined Heat and Power Market in Emerging Markets: Analysis and Projections 2025-2033

Discover the booming Japan Combined Heat and Power (CHP) market. This in-depth analysis reveals a CAGR exceeding 3.77%, driven by energy efficiency goals and government initiatives. Explore market size, key players (ABB, Mitsubishi, Siemens), regional trends (Kanto, Kansai), and future projections through 2033.

August 2025
Base Year: 2024
No Of Pages: 197
Price: $3800

UAE Oil and Gas Upstream Market Analysis Report 2025: Market to Grow by a CAGR of XX to 2033, Driven by Government Incentives, Popularity of Virtual Assistants, and Strategic Partnerships

The UAE Oil & Gas Upstream Market is booming, projected to reach $14.26 billion by 2033 with a 5.20% CAGR. This in-depth analysis covers market size, key players (ADNOC, ExxonMobil, Schlumberger), growth drivers, and future trends in onshore and offshore projects. Discover investment opportunities and market insights now.

August 2025
Base Year: 2024
No Of Pages: 197
Price: $3800

Seismic Survey Equipment Market Trends and Forecast 2025-2033

Discover the future of the seismic survey equipment market. This comprehensive analysis reveals a $XX million market poised for 2.80% CAGR growth through 2033, driven by energy exploration, mining, and technological advancements. Explore key trends, regional insights, and leading companies shaping this dynamic industry.

August 2025
Base Year: 2024
No Of Pages: 234
Price: $4750

Navigating Gas Generator Industry Market Trends: Competitor Analysis and Growth 2025-2033

Discover the booming gas generator market forecast to 2033! This comprehensive analysis reveals key drivers, trends, restraints, and regional market shares, including insights into major players like Cummins, Caterpillar, and Generac. Explore the growth opportunities in industrial, commercial, and residential sectors.

August 2025
Base Year: 2024
No Of Pages: 234
Price: $4750

Russia Hydro Power Plants Market Size, Share, and Growth Report: In-Depth Analysis and Forecast to 2033

Discover the booming Russia Hydro Power Plants market, projected to reach $16.25 billion by 2033. Analyze market drivers, trends, and restraints impacting growth, along with key players and regional insights. Explore the potential of hydroelectric power in Russia and its implications for renewable energy.

August 2025
Base Year: 2024
No Of Pages: 197
Price: $3800

Drivers of Change in Indonesia Oil and Gas Midstream Market Market 2025-2033

Discover the booming Indonesia Oil & Gas Midstream Market! Explore market size, growth projections (2025-2033), regional insights, and key drivers fueling this dynamic sector. Learn about investment opportunities and challenges in this crucial energy market.

August 2025
Base Year: 2024
No Of Pages: 197
Price: $3800

Market Projections for Excitation Systems Industry Industry 2025-2033

Discover the booming excitation systems market! Learn about its 4.35%+ CAGR, key drivers (renewable energy, grid modernization), regional trends (North America, Europe, Asia-Pacific), leading companies (ABB, Siemens, GE), and future growth projections to 2033. Explore market segmentation and investment opportunities in this vital sector of the power generation industry.

August 2025
Base Year: 2024
No Of Pages: 234
Price: $4750

Opportunities in Emerging Commercial Aircraft Aviation Fuel Market Industry Markets

The Commercial Aircraft Aviation Fuel market is booming, projected to reach \$220.1 billion by 2025 with a CAGR exceeding 20.86%. Discover key trends driving growth, including the rise of sustainable aviation fuels (SAFs) and the leading players shaping this dynamic industry. Explore regional market shares and future projections for this rapidly expanding sector.

August 2025
Base Year: 2024
No Of Pages: 180
Price: $4750

Strategic Growth Drivers for Myanmar Battery Industry Market

Discover the booming Myanmar battery market! This comprehensive analysis reveals a $50M (2025) industry with a CAGR >1.5%, driven by automotive, industrial, and consumer electronics growth. Explore market trends, key players, and future forecasts for lead-acid and lithium-ion batteries in Myanmar (2019-2033).

August 2025
Base Year: 2024
No Of Pages: 197
Price: $3800

Spain Solar Rooftop Industry Growth Opportunities and Market Forecast 2025-2033: A Strategic Analysis

Discover the booming Spain solar rooftop industry! This in-depth analysis reveals a €37.27B market in 2025, growing at a CAGR exceeding 9.50% through 2033. Learn about key drivers, trends, and leading companies shaping this dynamic sector.

August 2025
Base Year: 2024
No Of Pages: 180
Price: $3800

Technological Advances in Equatorial Guinea Power EPC Market Market: Trends and Opportunities 2025-2033

Discover the booming Equatorial Guinea power EPC market! Projected to reach $71.26 million by 2033 with a CAGR exceeding 4.5%, this report analyzes market drivers, trends, and key players like Wärtsilä and Power Construction Corporation of China. Learn about investment opportunities in this rapidly expanding African energy sector.

August 2025
Base Year: 2024
No Of Pages: 197
Price: $3800

Strategic Growth Drivers for India Transformer Market Market

Discover the booming India Transformer Market! This in-depth analysis reveals a $4.26 billion market in 2025, projected to exceed $6 billion by 2033, driven by infrastructure development and renewable energy adoption. Explore market segments, key players (ABB, CG Power, Siemens), and regional growth trends.

August 2025
Base Year: 2024
No Of Pages: 197
Price: $3800

Future-Ready Strategies for Pumped Hydro Storage Industry Market Growth

The Pumped Hydro Storage (PHS) market is booming, projected to reach $XX million by 2033, driven by renewable energy integration and grid stability needs. Learn about market trends, key players (Siemens, GE, EDF), and regional growth in this comprehensive analysis.

August 2025
Base Year: 2024
No Of Pages: 234
Price: $4750

Brazil Biofuel Market Insightful Analysis: Trends, Competitor Dynamics, and Opportunities 2025-2033

Discover the booming Brazil biofuel market! Our comprehensive analysis reveals a steady CAGR of 3.49% through 2033, driven by government initiatives and growing environmental awareness. Explore key players, market segments (biodiesel, ethanol, feedstocks), and future growth projections for this dynamic sector.

August 2025
Base Year: 2024
No Of Pages: 197
Price: $3800

Japan Uninterrupted Power Supply (UPS) Market Strategic Insights for 2025 and Forecasts to 2033: Market Trends

Discover the booming Japan Uninterrupted Power Supply (UPS) market. This in-depth analysis reveals key growth drivers, market segmentation, leading companies, and regional trends from 2019-2033. Learn about the CAGR, market size, and future projections for this essential technology sector in Japan.

August 2025
Base Year: 2024
No Of Pages: 197
Price: $3800

Exploring Growth Avenues in Denmark Geothermal Energy Market Market

Discover the booming Denmark geothermal energy market forecast to 2033! Explore market size, CAGR, key drivers, restraints, and leading companies. Learn about lithium-ion, flow, and other battery technologies driving growth in EV, energy storage, and consumer electronics sectors.

August 2025
Base Year: 2024
No Of Pages: 197
Price: $3800

Exploring Opportunities in Middle East And Africa Internal Combustion Engines Market Sector

The Middle East & Africa Internal Combustion Engine (ICE) market is booming, projected to reach $76.6 million by 2033 with a 16.30% CAGR. Discover key drivers, trends, and restraints shaping this dynamic market, including regional breakdowns and leading companies. Learn more about ICE engine capacity segments, fuel types (gasoline, diesel), and future projections.

August 2025
Base Year: 2024
No Of Pages: 234
Price: $4750

Europe Turbo Generator Market: Disruptive Technologies Driving Market Growth 2025-2033

The European turbo generator market is booming, with a CAGR exceeding 3.5% through 2033. Driven by rising electricity demand and power infrastructure upgrades, this market is segmented by end-user and type (steam & gas). Key players like Siemens and GE are navigating challenges like environmental regulations to capitalize on this growth. Explore market trends, forecasts, and key players in this detailed analysis.

August 2025
Base Year: 2024
No Of Pages: 234
Price: $4750

Emerging Natural Gas Distribution Market Trends and Opportunities

The global natural gas distribution market is booming, with a CAGR exceeding 3.20% and projected growth to $XXX million by 2033. Driven by rising energy demand and the shift to cleaner fuels, this market analysis explores key trends, challenges, and regional variations, highlighting major players like TC Energy and National Grid. Discover insights on CNG, PNG, and future growth projections.

August 2025
Base Year: 2024
No Of Pages: 234
Price: $4750

Asia-Pacific Steam Turbine Market Market Dynamics and Growth Analysis

The Asia-Pacific steam turbine market is booming, projected to reach $11 billion by 2033, driven by rising energy demands and industrialization. Explore market trends, key players (GE, Siemens, Mitsubishi), and regional breakdowns in this comprehensive analysis. Discover growth opportunities in this dynamic sector.

August 2025
Base Year: 2024
No Of Pages: 234
Price: $4750

Well Testing Services Industry Market’s Consumer Preferences: Trends and Analysis 2025-2033

The Well Testing Services market is booming, with a CAGR exceeding 2.00% and a projected value of $15 Billion+ by 2025. Explore key trends, drivers, restraints, and regional analysis in this comprehensive market report covering major players like Schlumberger and Halliburton. Discover growth opportunities in onshore and offshore exploration and production.

August 2025
Base Year: 2024
No Of Pages: 234
Price: $4750

Decoding North America FLNG Market’s Market Size Potential by 2033

Discover the booming North American Floating LNG (FLNG) market. This in-depth analysis reveals projected growth exceeding 3% CAGR to 2033, driven by offshore gas exploration and energy diversification. Learn about key players, market segmentation (by capacity, propulsion, and deployment), and future trends.

August 2025
Base Year: 2024
No Of Pages: 234
Price: $4750

Strategic Trends in North America Rotor Blade Market Market 2025-2033

The North American rotor blade market is booming, projected to exceed a CAGR of 6% through 2033. Driven by renewable energy adoption and technological advancements, key players like Vestas and Siemens Gamesa are shaping a dynamic landscape of onshore and offshore wind energy. Learn more about market trends, segmentation (carbon fiber, glass fiber), and key growth drivers.

August 2025
Base Year: 2024
No Of Pages: 234
Price: $4750

Strategic Projections for France Electric Vehicles Market Market Expansion

Discover the booming France electric vehicle market! This comprehensive analysis reveals key trends, market size projections (2025-2033), leading players (Tesla, Renault, Volkswagen, etc.), and growth drivers. Explore the segmentations by propulsion, vehicle type, and charging type, and understand the future of electric mobility in France.

August 2025
Base Year: 2024
No Of Pages: 197
Price: $3800

Emerging Markets for Shale Gas Industry Industry

Discover the booming shale gas market! This comprehensive analysis reveals key trends, drivers, and challenges shaping the industry's growth through 2033, with insights into regional market shares, major players (Equinor, Shell, ExxonMobil), and technological advancements in shale gas extraction. Explore the future of shale gas and its impact on the global energy landscape.

August 2025
Base Year: 2024
No Of Pages: 234
Price: $4750

Strategic Roadmap for India Retail Fuel Market Industry

Discover the latest insights on the booming India retail fuel market. This comprehensive analysis reveals market size, CAGR, key drivers, trends, and regional breakdowns, profiling major players like Indian Oil, Reliance Industries, and Shell. Explore growth projections to 2033 and understand the competitive landscape.

August 2025
Base Year: 2024
No Of Pages: 197
Price: $3800

Air Filters Market Market Consumption Trends: Growth Analysis 2025-2033

The global air filter market is booming, driven by rising pollution, IAQ concerns, and stricter regulations. Explore market size, CAGR, key segments (HEPA filters, cartridge filters, etc.), top players (Whirlpool, Daikin, Donaldson), and regional trends (North America, Europe, Asia-Pacific) in this comprehensive analysis projecting growth to 2033.

August 2025
Base Year: 2024
No Of Pages: 234
Price: $4750

Regional Insights into Egypt Oil And Gas Upstream Market Market Growth

Discover the promising future of the Egypt Oil and Gas Upstream Market. This in-depth analysis reveals key growth drivers, market segmentation, and leading companies, projecting substantial growth from 2025-2033. Learn about market size, CAGR, and investment opportunities in Egypt's energy sector.

August 2025
Base Year: 2024
No Of Pages: 197
Price: $3800

Process Gas Compressors Industry Market Demand and Consumption Trends: Outlook 2025-2033

The process gas compressor market is booming, projected to reach $XX million by 2033 with a CAGR of 3.71%. Discover key market drivers, trends, and restraints shaping this dynamic industry, including regional analysis and insights from leading players like Howden Group and Ingersoll Rand. Explore oil-injected vs. oil-free compressors and their applications across diverse sectors.

August 2025
Base Year: 2024
No Of Pages: 234
Price: $4750

South Korea Renewable Energy Industry Projected to Grow at XX CAGR: Insights and Forecasts 2025-2033

South Korea's renewable energy market is booming, with a projected CAGR exceeding 5.5% through 2033. Driven by government initiatives and technological advancements, solar and wind power lead the charge. Learn about market size, key players, and growth projections in this comprehensive analysis.

August 2025
Base Year: 2024
No Of Pages: 197
Price: $3800

Emerging Trends in APAC Floating Production Industry: A Technology Perspective 2025-2033

Discover the booming APAC floating production industry! This in-depth analysis reveals market size, CAGR, key drivers, and trends shaping the future of FPSO, SPAR, and other offshore platforms in Asia-Pacific, with forecasts to 2033. Learn about leading companies and regional market shares.

August 2025
Base Year: 2024
No Of Pages: 234
Price: $4750

Africa Oil Refining Market Projected to Grow at XX CAGR: Insights and Forecasts 2025-2033

The Africa Oil Refining Market, projected at $31.8B in 2025, is booming, driven by rising energy demand & industrialization. Discover key trends, major players (Oryx Energies, Midoil Refining), and regional insights in this comprehensive market analysis forecasting growth to 2033.

August 2025
Base Year: 2024
No Of Pages: 180
Price: $4750

Power Transformer Market in India Navigating Dynamics Comprehensive Analysis and Forecasts 2025-2033

The Indian power transformer market is booming, projected to reach [estimated 2033 market size based on CAGR] by 2033. Driven by renewable energy expansion and infrastructure development, this market offers lucrative opportunities for players like ABB, Siemens, and CG Power. Explore key trends, regional insights, and segment analysis in our comprehensive report.

August 2025
Base Year: 2024
No Of Pages: 197
Price: $3800

Market Deep Dive: Exploring Brazil Combined Heat and Power Market Trends 2025-2033

Discover the booming Brazilian Combined Heat & Power (CHP) market! Learn about its impressive growth (CAGR >2%), key drivers, major players (Cummins, Caterpillar, GE), and future trends in this insightful market analysis covering the period 2019-2033. Explore the potential of natural gas, biomass, and other fuel types across residential, commercial, and industrial sectors.

August 2025
Base Year: 2024
No Of Pages: 197
Price: $3800

Drill Pipe Industry Market Expansion: Growth Outlook 2025-2033

Discover the booming global drill pipe market forecast to 2033! This comprehensive analysis reveals key drivers, trends, restraints, and regional insights, including North America, Europe, Asia-Pacific, and more. Learn about leading companies and explore the growth opportunities within standard, heavy-weight, and drill collar segments.

August 2025
Base Year: 2024
No Of Pages: 234
Price: $4750

SLI Battery Market Industry Growth Trends and Analysis

The global SLI battery market is booming, projected to reach \$50.17 billion by 2033, fueled by automotive growth and technological advancements. Explore key trends, market drivers, leading companies (GS Yuasa, Exide, Clarios), and regional analysis in this comprehensive market report.

August 2025
Base Year: 2024
No Of Pages: 234
Price: $4750

East Africa Petroleum Product Industry Strategic Market Roadmap: Analysis and Forecasts 2025-2033

Discover the booming East African petroleum product market! This in-depth analysis reveals a CAGR exceeding 3.5% driven by industrialization and urbanization, impacting demand for light, middle, and heavy distillates. Learn about key players, regional trends, and growth projections through 2033.

August 2025
Base Year: 2024
No Of Pages: 234
Price: $4750

Market Projections for Indonesia Oilfield Equipment Rental Industry Industry 2025-2033

Discover the booming Indonesian oilfield equipment rental market! This in-depth analysis reveals a market projected to reach significant value by 2033, driven by rising energy demand and technological advancements. Explore market size, growth forecasts, key players, and segment trends.

August 2025
Base Year: 2024
No Of Pages: 197
Price: $3800

Europe AUV and ROV Market Growth Opportunities and Market Forecast 2025-2033: A Strategic Analysis

Discover the booming European AUV & ROV market! This comprehensive analysis reveals key trends, growth drivers, and leading companies in underwater robotics, projecting substantial expansion through 2033. Learn about market segmentation by activity, vehicle type, application (oil & gas, defense), and regional insights.

August 2025
Base Year: 2024
No Of Pages: 234
Price: $4750

Frac Stack Industry Market’s Strategic Roadmap: Insights for 2025-2033

Discover the booming frac stack market analysis and forecast to 2033. Explore key drivers, restraints, and regional trends in this comprehensive report covering onshore, offshore, and various well types. Learn about leading companies and investment opportunities in the hydraulic fracturing industry.

August 2025
Base Year: 2024
No Of Pages: 234
Price: $4750
  • Home
  • About Us
  • Industries
    • Aerospace & Defense
    • Agriculture
    • Animal Nutrition & Wellness
    • Automotive
    • Chemicals & Materials
    • Consumer Goods and Services
    • Energy & Power
    • Financial Services and Investment Intelligence
    • Food & Beverage
    • Home and Property Improvement
    • Hospitality and Tourism
    • Logistics
    • Manufacturing Products and Services
    • Packaging
    • Professional and Commercial Services
    • Real Estate and Construction
    • Retail
    • Technology, Media and Telecom
    • Healthcare
  • Services
  • Contact
Main Logo
  • Home
  • About Us
  • Industries
    • Aerospace & Defense
    • Agriculture
    • Animal Nutrition & Wellness
    • Automotive
    • Chemicals & Materials
    • Consumer Goods and Services
    • Energy & Power
    • Financial Services and Investment Intelligence
    • Food & Beverage
    • Home and Property Improvement
    • Hospitality and Tourism
    • Logistics
    • Manufacturing Products and Services
    • Packaging
    • Professional and Commercial Services
    • Real Estate and Construction
    • Retail
    • Technology, Media and Telecom
    • Healthcare
  • Services
  • Contact
+17162654855
[email protected]

+17162654855

[email protected]

Business Address

Head Office

Ansec House 3 rd floor Tank Road, Yerwada, Pune, Maharashtra 411014

Contact Information

Craig Francis

Business Development Head

+17162654855

[email protected]

Secure Payment Partners

payment image
RetailLogisticsPackagingAutomotiveHealthcareAgricultureEnergy & PowerFood & BeverageAerospace & DefenseChemicals & MaterialsHospitality and TourismAnimal Nutrition & WellnessConsumer Goods and ServicesReal Estate and ConstructionHome and Property ImprovementTechnology, Media and TelecomManufacturing Products and ServicesFinancial Services and Investment Intelligence

© 2025 PRDUA Research & Media Private Limited, All rights reserved

Privacy Policy
Terms and Conditions
FAQ