

Key Insights
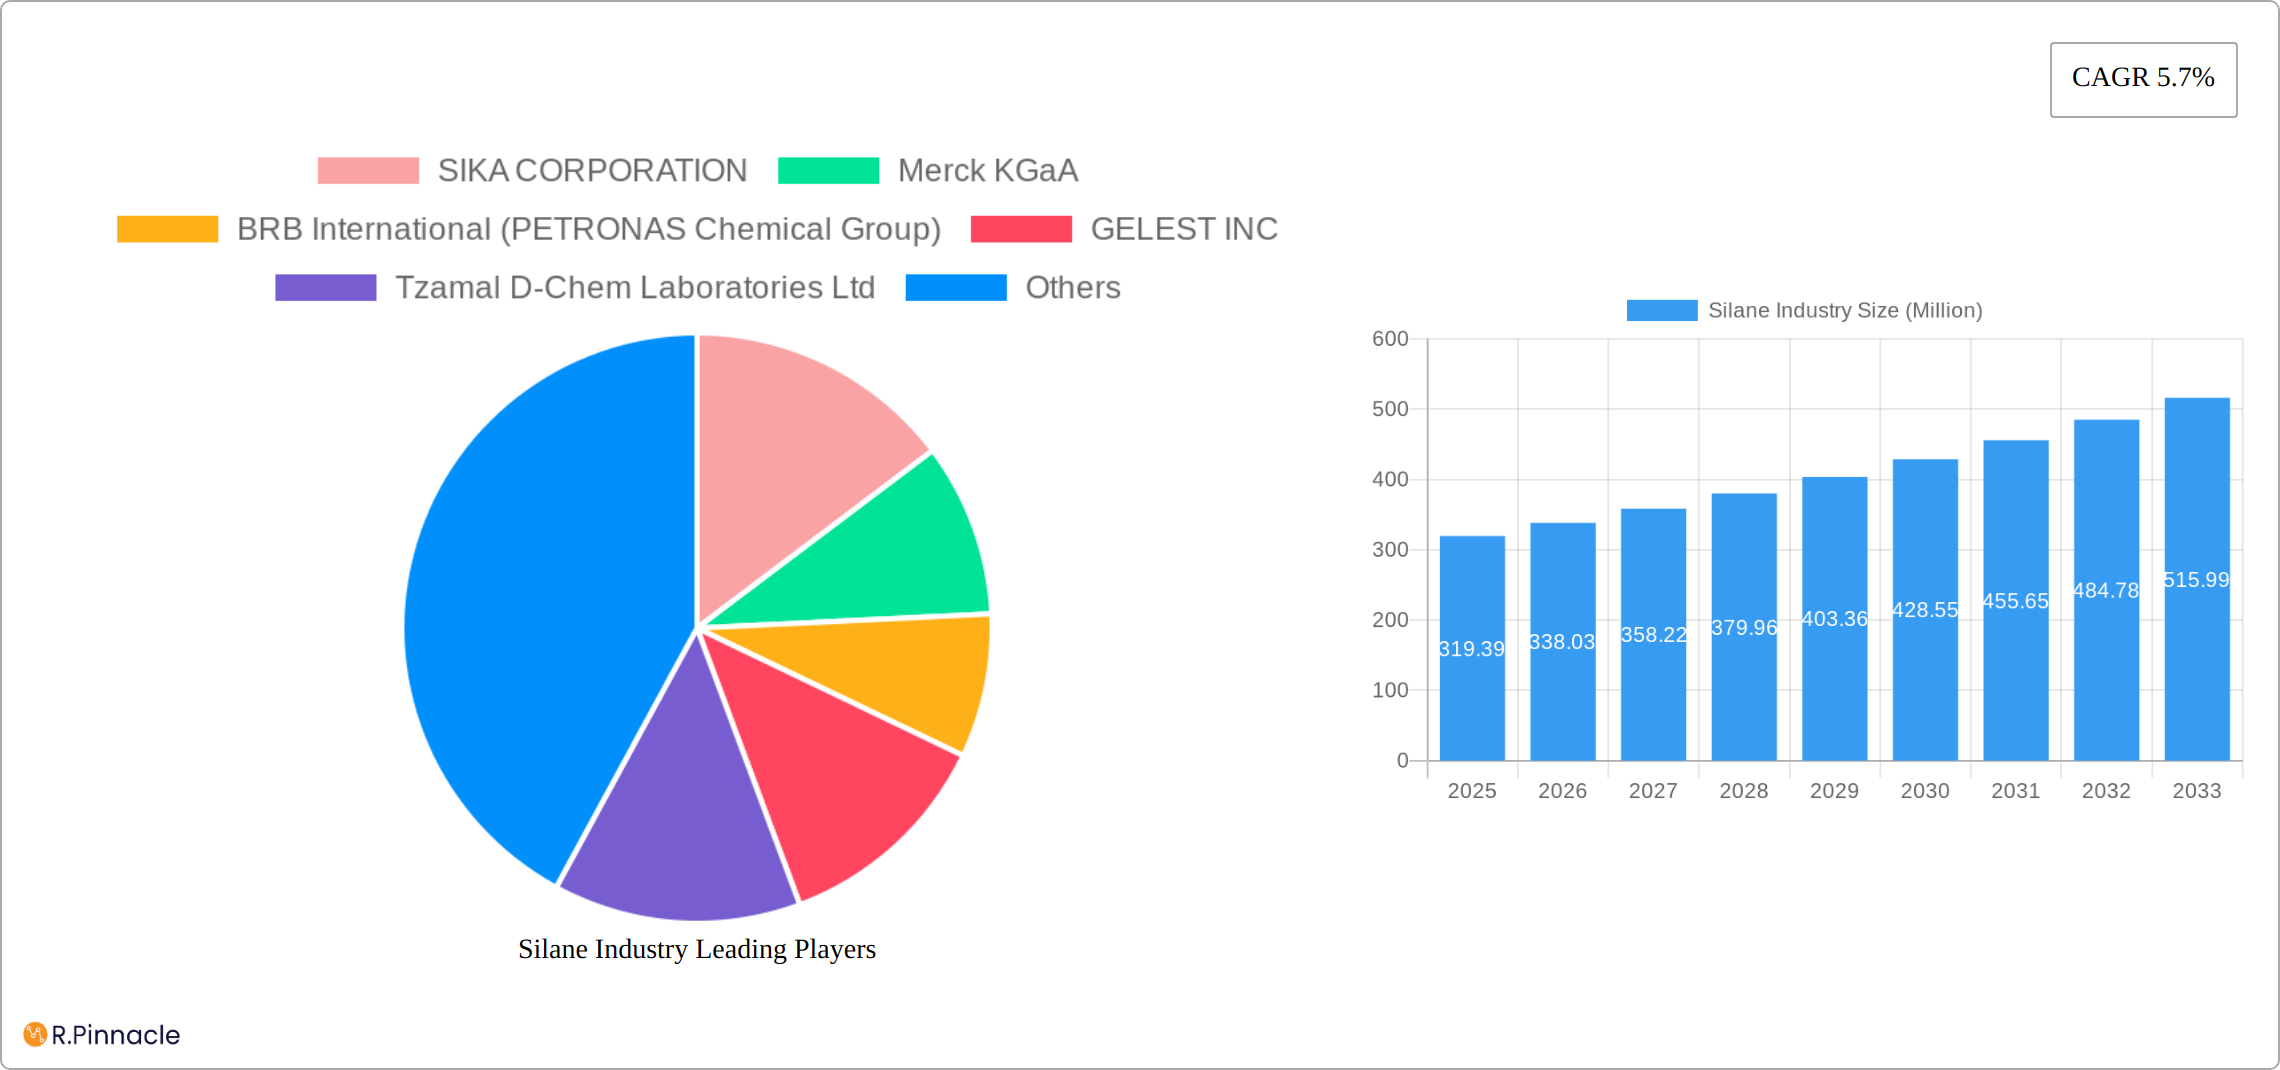
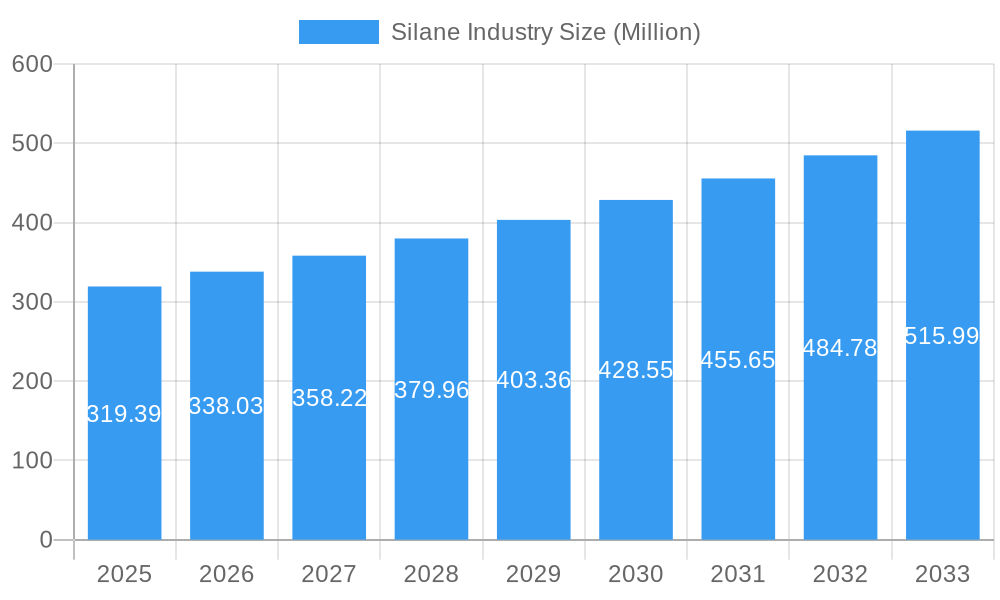
The global silane market, valued at $319.39 million in 2025, is projected to experience robust growth, driven by a compound annual growth rate (CAGR) of 5.7% from 2025 to 2033. This expansion is fueled by several key factors. The increasing demand for silanes in diverse applications, particularly in the construction, plastics, and coatings industries, is a significant driver. Growth in the construction sector, spurred by infrastructure development globally and the rising need for durable and high-performance building materials, significantly contributes to the silane market's expansion. Furthermore, the automotive industry's increasing adoption of advanced materials and composites, which often incorporate silanes for improved properties like adhesion and durability, fuels market growth. The rising demand for energy-efficient solutions in buildings also boosts the demand for silane-based sealants and coatings. Technological advancements leading to the development of novel silane-based products with enhanced performance characteristics further contribute to market expansion. Specific segments like alkyl and amino silanes are anticipated to witness particularly strong growth due to their versatility and widespread application across various industries. Geographical regions such as Asia-Pacific, driven by rapid industrialization and infrastructure development in countries like China and India, are expected to show significant growth potential.
Silane Industry Market Size (In Million)
However, the market also faces certain restraints. Fluctuations in raw material prices, particularly for silicon-based materials, can impact silane production costs and profitability. Stricter environmental regulations related to the manufacturing and use of certain silanes could also pose challenges. Competitive pressures from alternative materials and the need for continuous innovation to meet evolving industry demands are also factors that influence market dynamics. Despite these challenges, the overall outlook for the silane market remains positive, with sustained growth projected across various segments and regions throughout the forecast period. The diverse applications of silanes across numerous industries, coupled with ongoing research and development efforts, are expected to drive the market's continued expansion in the coming years.
Silane Industry Company Market Share
Silane Industry Market Report: 2019-2033 Forecast
This comprehensive report provides an in-depth analysis of the global silane industry, offering invaluable insights for industry professionals, investors, and strategic decision-makers. Covering the period from 2019 to 2033, with a focus on 2025, this report meticulously examines market dynamics, segmentation, key players, and future growth potential. The report leverages a wealth of data to deliver actionable intelligence, helping you navigate the complexities of this dynamic market and capitalize on emerging opportunities. The total market size in 2025 is estimated at $XX Million.
Silane Industry Market Structure & Innovation Trends
The silane market's competitive landscape is characterized by moderate consolidation, significant innovation, and evolving regulatory pressures. This analysis examines market concentration, key innovation drivers, and the impact of regulatory influences, with a focus on the period 2019-2024. The market demonstrates a moderate level of consolidation, with leading players commanding substantial market shares. For instance, in 2024, the top three companies—SIKA CORPORATION, Merck KGaA, and BRB International (PETRONAS Chemical Group)—held an estimated xx% of the market. Mergers and acquisitions (M&A) activity during this period reached approximately $XX million, largely driven by strategic acquisitions aimed at expanding product portfolios and global reach. This activity has significantly shaped the competitive dynamics and market structure.
- Market Concentration: A moderately consolidated market with leading players holding substantial market shares, influencing pricing and product development strategies.
- Innovation Drivers: The demand for high-performance materials in key end-use sectors, such as construction, automotive, and electronics, is a primary driver of innovation. Research and development efforts are focused on improving silane properties, expanding applications, and addressing sustainability concerns.
- Regulatory Framework: A growing emphasis on sustainability and stricter environmental regulations is impacting product development and manufacturing processes. Companies are increasingly focusing on eco-friendly silane solutions to meet regulatory compliance and consumer demand.
- Product Substitutes: While limited direct substitutes exist, competition arises from alternative technologies offering similar functionalities. Companies need to continuously innovate to maintain a competitive edge.
- End-User Demographics: The construction, automotive, and electronics industries remain significant end-use sectors, driving substantial demand for silanes with specific performance characteristics tailored to these applications.
- M&A Activities: Strategic acquisitions continue to reshape the market landscape, leading to consolidation and expansion of product portfolios and geographical reach. This trend is likely to continue as companies seek to enhance their market position and competitiveness.
Silane Industry Market Dynamics & Trends
The global silane market is experiencing robust growth, driven by several key factors. The Compound Annual Growth Rate (CAGR) from 2019 to 2024 is estimated at xx%, with a projected CAGR of xx% from 2025 to 2033. This growth is fueled by increasing demand across various end-use applications, particularly in the construction, automotive, and electronics sectors. Technological advancements leading to the development of novel silane-based materials with enhanced properties are further accelerating market expansion. The market penetration of silanes in emerging applications like renewable energy is also contributing to growth. Competitive dynamics are shaped by product differentiation, pricing strategies, and geographical expansion efforts by major players. The market is characterized by a mix of established players and emerging innovative companies.
Dominant Regions & Segments in Silane Industry
The Asia-Pacific region is currently the dominant market for silanes, driven by rapid industrialization, robust infrastructure development, and increasing demand from key end-use sectors like construction and electronics.
Key Drivers for Asia-Pacific Dominance:
- Rapid economic growth and industrialization.
- Expanding construction and infrastructure projects.
- Increasing demand from the electronics and automotive industries.
- Favorable government policies and initiatives.
Dominant Segments:
- Type: Alkyl silanes currently hold the largest market share due to their wide applications in various industries.
- Application: The plastics, rubber, and composites segment exhibits significant growth due to the rising demand for lightweight, high-performance materials. The Building & Construction segment is also a major driver, fueled by infrastructural development worldwide.
The detailed dominance analysis within this section provides insights into the specific factors driving growth in each region and segment.
Silane Industry Product Innovations
Recent years have witnessed significant advancements in silane technology, leading to the development of novel silanes with enhanced performance characteristics. These innovations include improved adhesion properties, enhanced water resistance, and superior durability. This has broadened the applications of silanes into new areas, such as advanced composites, high-performance coatings, and biomedical devices. This ongoing innovation cycle ensures that silanes remain a valuable material in a wide array of industries.
Report Scope & Segmentation Analysis
This report offers a comprehensive segmentation of the silane market based on type (Alkyl, Amino, Epoxy, Methacryloxy, Phenyl, Vinyl, Others) and application (Plastics, Rubber & Composites, Building & Construction, Paints & Coatings, Adhesives & Sealants, Mineral & Filler Treatment, Others). Each segment's growth projections, market size, and competitive dynamics are analyzed in detail. The report also encompasses a thorough regional breakdown, identifying key growth markets and their respective drivers.
Key Drivers of Silane Industry Growth
The growth of the silane industry is fueled by several key factors: increasing demand from construction, automotive, and electronics sectors, technological advancements leading to improved material properties, and government initiatives promoting sustainable construction materials. The rising focus on energy efficiency and the development of green building materials also contributes significantly to market expansion.
Challenges in the Silane Industry Sector
The silane industry faces challenges such as fluctuations in raw material prices, stringent environmental regulations, and intense competition. Supply chain disruptions can also impact production and delivery timelines. These factors can influence pricing strategies and overall profitability.
Emerging Opportunities in Silane Industry
Emerging opportunities lie in expanding applications of silanes in renewable energy technologies, advanced composites, and biomedical devices. Further innovation in silane chemistry, leading to more specialized and high-performance materials, is likely to unlock new market segments and drive growth in the future.
Leading Players in the Silane Industry Market
- SIKA CORPORATION
- Merck KGaA
- BRB International (PETRONAS Chemical Group)
- GELEST INC
- Tzamal D-Chem Laboratories Ltd
- Momentive
- Genesee Polymers Corporation
- Dow
- Alfa Aesar (Thermo Fisher Scientific)
- Shin-Etsu Chemical Co Ltd
- Prochimia Surfaces
- United Chemical Technologies
- Wacker Chemie AG
- Evonik
Key Developments in Silane Industry
- 2022 Q4: SIKA CORPORATION launched a new line of high-performance silanes for the construction industry.
- 2023 Q1: Merck KGaA announced a strategic partnership to expand its silane product portfolio.
- (Add further developments with year/month and impact)
Future Outlook for Silane Industry Market
The future outlook for the silane industry remains positive, with continued growth driven by technological advancements, expanding applications, and increasing demand across various end-use sectors. Strategic investments in research and development, coupled with a focus on sustainability, will further shape the industry's trajectory, creating significant opportunities for both established players and new entrants.
Silane Industry Segmentation
-
1. Type
- 1.1. Alkyl
- 1.2. Amino
- 1.3. Epoxy
- 1.4. Methacryloxy
- 1.5. Phenyl
- 1.6. Vinyl
- 1.7. Others
-
2. Application
- 2.1. Plastics, Rubber and Composites
- 2.2. Building & Construction
- 2.3. Paints & Coatings
- 2.4. Adhesives & Sealants
- 2.5. Mineral & Filler Treatment
- 2.6. Others (Semi-Conductors, Pharmaceutical, etc.,)
Silane Industry Segmentation By Geography
-
1. Asia Pacific
- 1.1. China
- 1.2. India
- 1.3. Japan
- 1.4. South Korea
- 1.5. Rest of Asia Pacific
-
2. North America
- 2.1. United States
- 2.2. Canada
- 2.3. Mexico
-
3. Europe
- 3.1. Germany
- 3.2. United Kingdom
- 3.3. Italy
- 3.4. France
- 3.5. Rest of Europe
-
4. South America
- 4.1. Brazil
- 4.2. Argentina
- 4.3. Rest of South America
-
5. Middle East and Africa
- 5.1. Saudi Arabia
- 5.2. South Africa
- 5.3. Rest of Middle East and Africa
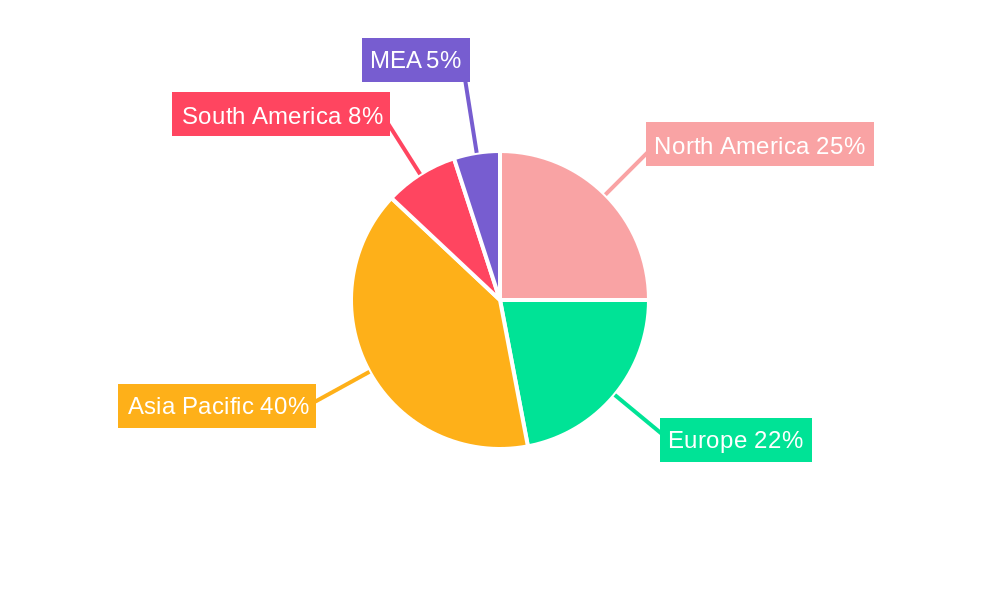
Silane Industry Regional Market Share
Geographic Coverage of Silane Industry
Silane Industry REPORT HIGHLIGHTS
| Aspects | Details |
|---|---|
| Study Period | 2020-2034 |
| Base Year | 2025 |
| Estimated Year | 2026 |
| Forecast Period | 2026-2034 |
| Historical Period | 2020-2025 |
| Growth Rate | CAGR of 5.7% from 2020-2034 |
| Segmentation |
|
Table of Contents
- 1. Introduction
- 1.1. Research Scope
- 1.2. Market Segmentation
- 1.3. Research Objective
- 1.4. Definitions and Assumptions
- 2. Executive Summary
- 2.1. Market Snapshot
- 3. Market Dynamics
- 3.1. Market Drivers
- 3.2. Market Restrains
- 3.3. Market Trends
- 3.4. Market Opportunities
- 4. Market Factor Analysis
- 4.1. Porters Five Forces
- 4.1.1. Bargaining Power of Suppliers
- 4.1.2. Bargaining Power of Buyers
- 4.1.3. Threat of New Entrants
- 4.1.4. Threat of Substitutes
- 4.1.5. Competitive Rivalry
- 4.2. PESTEL analysis
- 4.3. BCG Analysis
- 4.3.1. Stars (High Growth, High Market Share)
- 4.3.2. Cash Cows (Low Growth, High Market Share)
- 4.3.3. Question Mark (High Growth, Low Market Share)
- 4.3.4. Dogs (Low Growth, Low Market Share)
- 4.4. Ansoff Matrix Analysis
- 4.5. Supply Chain Analysis
- 4.6. Regulatory Landscape
- 4.7. Current Market Potential and Opportunity Assessment (TAM–SAM–SOM Framework)
- 4.8. PRI Analyst Note
- 4.1. Porters Five Forces
- 5. Market Analysis, Insights and Forecast 2021-2033
- 5.1. Market Analysis, Insights and Forecast - by Type
- 5.1.1. Alkyl
- 5.1.2. Amino
- 5.1.3. Epoxy
- 5.1.4. Methacryloxy
- 5.1.5. Phenyl
- 5.1.6. Vinyl
- 5.1.7. Others
- 5.2. Market Analysis, Insights and Forecast - by Application
- 5.2.1. Plastics, Rubber and Composites
- 5.2.2. Building & Construction
- 5.2.3. Paints & Coatings
- 5.2.4. Adhesives & Sealants
- 5.2.5. Mineral & Filler Treatment
- 5.2.6. Others (Semi-Conductors, Pharmaceutical, etc.,)
- 5.3. Market Analysis, Insights and Forecast - by Region
- 5.3.1. Asia Pacific
- 5.3.2. North America
- 5.3.3. Europe
- 5.3.4. South America
- 5.3.5. Middle East and Africa
- 5.1. Market Analysis, Insights and Forecast - by Type
- 6. Global Silane Industry Analysis, Insights and Forecast, 2021-2033
- 6.1. Market Analysis, Insights and Forecast - by Type
- 6.1.1. Alkyl
- 6.1.2. Amino
- 6.1.3. Epoxy
- 6.1.4. Methacryloxy
- 6.1.5. Phenyl
- 6.1.6. Vinyl
- 6.1.7. Others
- 6.2. Market Analysis, Insights and Forecast - by Application
- 6.2.1. Plastics, Rubber and Composites
- 6.2.2. Building & Construction
- 6.2.3. Paints & Coatings
- 6.2.4. Adhesives & Sealants
- 6.2.5. Mineral & Filler Treatment
- 6.2.6. Others (Semi-Conductors, Pharmaceutical, etc.,)
- 6.1. Market Analysis, Insights and Forecast - by Type
- 7. Asia Pacific Silane Industry Analysis, Insights and Forecast, 2020-2032
- 7.1. Market Analysis, Insights and Forecast - by Type
- 7.1.1. Alkyl
- 7.1.2. Amino
- 7.1.3. Epoxy
- 7.1.4. Methacryloxy
- 7.1.5. Phenyl
- 7.1.6. Vinyl
- 7.1.7. Others
- 7.2. Market Analysis, Insights and Forecast - by Application
- 7.2.1. Plastics, Rubber and Composites
- 7.2.2. Building & Construction
- 7.2.3. Paints & Coatings
- 7.2.4. Adhesives & Sealants
- 7.2.5. Mineral & Filler Treatment
- 7.2.6. Others (Semi-Conductors, Pharmaceutical, etc.,)
- 7.1. Market Analysis, Insights and Forecast - by Type
- 8. North America Silane Industry Analysis, Insights and Forecast, 2020-2032
- 8.1. Market Analysis, Insights and Forecast - by Type
- 8.1.1. Alkyl
- 8.1.2. Amino
- 8.1.3. Epoxy
- 8.1.4. Methacryloxy
- 8.1.5. Phenyl
- 8.1.6. Vinyl
- 8.1.7. Others
- 8.2. Market Analysis, Insights and Forecast - by Application
- 8.2.1. Plastics, Rubber and Composites
- 8.2.2. Building & Construction
- 8.2.3. Paints & Coatings
- 8.2.4. Adhesives & Sealants
- 8.2.5. Mineral & Filler Treatment
- 8.2.6. Others (Semi-Conductors, Pharmaceutical, etc.,)
- 8.1. Market Analysis, Insights and Forecast - by Type
- 9. Europe Silane Industry Analysis, Insights and Forecast, 2020-2032
- 9.1. Market Analysis, Insights and Forecast - by Type
- 9.1.1. Alkyl
- 9.1.2. Amino
- 9.1.3. Epoxy
- 9.1.4. Methacryloxy
- 9.1.5. Phenyl
- 9.1.6. Vinyl
- 9.1.7. Others
- 9.2. Market Analysis, Insights and Forecast - by Application
- 9.2.1. Plastics, Rubber and Composites
- 9.2.2. Building & Construction
- 9.2.3. Paints & Coatings
- 9.2.4. Adhesives & Sealants
- 9.2.5. Mineral & Filler Treatment
- 9.2.6. Others (Semi-Conductors, Pharmaceutical, etc.,)
- 9.1. Market Analysis, Insights and Forecast - by Type
- 10. South America Silane Industry Analysis, Insights and Forecast, 2020-2032
- 10.1. Market Analysis, Insights and Forecast - by Type
- 10.1.1. Alkyl
- 10.1.2. Amino
- 10.1.3. Epoxy
- 10.1.4. Methacryloxy
- 10.1.5. Phenyl
- 10.1.6. Vinyl
- 10.1.7. Others
- 10.2. Market Analysis, Insights and Forecast - by Application
- 10.2.1. Plastics, Rubber and Composites
- 10.2.2. Building & Construction
- 10.2.3. Paints & Coatings
- 10.2.4. Adhesives & Sealants
- 10.2.5. Mineral & Filler Treatment
- 10.2.6. Others (Semi-Conductors, Pharmaceutical, etc.,)
- 10.1. Market Analysis, Insights and Forecast - by Type
- 11. Middle East and Africa Silane Industry Analysis, Insights and Forecast, 2020-2032
- 11.1. Market Analysis, Insights and Forecast - by Type
- 11.1.1. Alkyl
- 11.1.2. Amino
- 11.1.3. Epoxy
- 11.1.4. Methacryloxy
- 11.1.5. Phenyl
- 11.1.6. Vinyl
- 11.1.7. Others
- 11.2. Market Analysis, Insights and Forecast - by Application
- 11.2.1. Plastics, Rubber and Composites
- 11.2.2. Building & Construction
- 11.2.3. Paints & Coatings
- 11.2.4. Adhesives & Sealants
- 11.2.5. Mineral & Filler Treatment
- 11.2.6. Others (Semi-Conductors, Pharmaceutical, etc.,)
- 11.1. Market Analysis, Insights and Forecast - by Type
- 12. Competitive Analysis
- 12.1. Company Profiles
- 12.1.1 SIKA CORPORATION
- 12.1.1.1. Company Overview
- 12.1.1.2. Products
- 12.1.1.3. Company Financials
- 12.1.1.4. SWOT Analysis
- 12.1.2 Merck KGaA
- 12.1.2.1. Company Overview
- 12.1.2.2. Products
- 12.1.2.3. Company Financials
- 12.1.2.4. SWOT Analysis
- 12.1.3 BRB International (PETRONAS Chemical Group)
- 12.1.3.1. Company Overview
- 12.1.3.2. Products
- 12.1.3.3. Company Financials
- 12.1.3.4. SWOT Analysis
- 12.1.4 GELEST INC
- 12.1.4.1. Company Overview
- 12.1.4.2. Products
- 12.1.4.3. Company Financials
- 12.1.4.4. SWOT Analysis
- 12.1.5 Tzamal D-Chem Laboratories Ltd
- 12.1.5.1. Company Overview
- 12.1.5.2. Products
- 12.1.5.3. Company Financials
- 12.1.5.4. SWOT Analysis
- 12.1.6 Momentive
- 12.1.6.1. Company Overview
- 12.1.6.2. Products
- 12.1.6.3. Company Financials
- 12.1.6.4. SWOT Analysis
- 12.1.7 Genesee Polymers Corporation
- 12.1.7.1. Company Overview
- 12.1.7.2. Products
- 12.1.7.3. Company Financials
- 12.1.7.4. SWOT Analysis
- 12.1.8 Dow
- 12.1.8.1. Company Overview
- 12.1.8.2. Products
- 12.1.8.3. Company Financials
- 12.1.8.4. SWOT Analysis
- 12.1.9 Alfa Aesar (Thermo Fisher Scientific)
- 12.1.9.1. Company Overview
- 12.1.9.2. Products
- 12.1.9.3. Company Financials
- 12.1.9.4. SWOT Analysis
- 12.1.10 Shin-Etsu Chemical Co Ltd
- 12.1.10.1. Company Overview
- 12.1.10.2. Products
- 12.1.10.3. Company Financials
- 12.1.10.4. SWOT Analysis
- 12.1.11 Prochimia Surfaces
- 12.1.11.1. Company Overview
- 12.1.11.2. Products
- 12.1.11.3. Company Financials
- 12.1.11.4. SWOT Analysis
- 12.1.12 United Chemical Technologies
- 12.1.12.1. Company Overview
- 12.1.12.2. Products
- 12.1.12.3. Company Financials
- 12.1.12.4. SWOT Analysis
- 12.1.13 Wacker Chemie AG
- 12.1.13.1. Company Overview
- 12.1.13.2. Products
- 12.1.13.3. Company Financials
- 12.1.13.4. SWOT Analysis
- 12.1.14 Evonik
- 12.1.14.1. Company Overview
- 12.1.14.2. Products
- 12.1.14.3. Company Financials
- 12.1.14.4. SWOT Analysis
- 12.1.1 SIKA CORPORATION
- 12.2. Market Entropy
- 12.2.1 Company's Key Areas Served
- 12.2.2 Recent Developments
- 12.3. Company Market Share Analysis 2025
- 12.3.1 Top 5 Companies Market Share Analysis
- 12.3.2 Top 3 Companies Market Share Analysis
- 12.4. List of Potential Customers
- 13. Research Methodology
List of Figures
- Figure 1: Global Silane Industry Revenue Breakdown (Million, %) by Region 2025 & 2033
- Figure 2: Global Silane Industry Volume Breakdown (K Tons, %) by Region 2025 & 2033
- Figure 3: Asia Pacific Silane Industry Revenue (Million), by Type 2025 & 2033
- Figure 4: Asia Pacific Silane Industry Volume (K Tons), by Type 2025 & 2033
- Figure 5: Asia Pacific Silane Industry Revenue Share (%), by Type 2025 & 2033
- Figure 6: Asia Pacific Silane Industry Volume Share (%), by Type 2025 & 2033
- Figure 7: Asia Pacific Silane Industry Revenue (Million), by Application 2025 & 2033
- Figure 8: Asia Pacific Silane Industry Volume (K Tons), by Application 2025 & 2033
- Figure 9: Asia Pacific Silane Industry Revenue Share (%), by Application 2025 & 2033
- Figure 10: Asia Pacific Silane Industry Volume Share (%), by Application 2025 & 2033
- Figure 11: Asia Pacific Silane Industry Revenue (Million), by Country 2025 & 2033
- Figure 12: Asia Pacific Silane Industry Volume (K Tons), by Country 2025 & 2033
- Figure 13: Asia Pacific Silane Industry Revenue Share (%), by Country 2025 & 2033
- Figure 14: Asia Pacific Silane Industry Volume Share (%), by Country 2025 & 2033
- Figure 15: North America Silane Industry Revenue (Million), by Type 2025 & 2033
- Figure 16: North America Silane Industry Volume (K Tons), by Type 2025 & 2033
- Figure 17: North America Silane Industry Revenue Share (%), by Type 2025 & 2033
- Figure 18: North America Silane Industry Volume Share (%), by Type 2025 & 2033
- Figure 19: North America Silane Industry Revenue (Million), by Application 2025 & 2033
- Figure 20: North America Silane Industry Volume (K Tons), by Application 2025 & 2033
- Figure 21: North America Silane Industry Revenue Share (%), by Application 2025 & 2033
- Figure 22: North America Silane Industry Volume Share (%), by Application 2025 & 2033
- Figure 23: North America Silane Industry Revenue (Million), by Country 2025 & 2033
- Figure 24: North America Silane Industry Volume (K Tons), by Country 2025 & 2033
- Figure 25: North America Silane Industry Revenue Share (%), by Country 2025 & 2033
- Figure 26: North America Silane Industry Volume Share (%), by Country 2025 & 2033
- Figure 27: Europe Silane Industry Revenue (Million), by Type 2025 & 2033
- Figure 28: Europe Silane Industry Volume (K Tons), by Type 2025 & 2033
- Figure 29: Europe Silane Industry Revenue Share (%), by Type 2025 & 2033
- Figure 30: Europe Silane Industry Volume Share (%), by Type 2025 & 2033
- Figure 31: Europe Silane Industry Revenue (Million), by Application 2025 & 2033
- Figure 32: Europe Silane Industry Volume (K Tons), by Application 2025 & 2033
- Figure 33: Europe Silane Industry Revenue Share (%), by Application 2025 & 2033
- Figure 34: Europe Silane Industry Volume Share (%), by Application 2025 & 2033
- Figure 35: Europe Silane Industry Revenue (Million), by Country 2025 & 2033
- Figure 36: Europe Silane Industry Volume (K Tons), by Country 2025 & 2033
- Figure 37: Europe Silane Industry Revenue Share (%), by Country 2025 & 2033
- Figure 38: Europe Silane Industry Volume Share (%), by Country 2025 & 2033
- Figure 39: South America Silane Industry Revenue (Million), by Type 2025 & 2033
- Figure 40: South America Silane Industry Volume (K Tons), by Type 2025 & 2033
- Figure 41: South America Silane Industry Revenue Share (%), by Type 2025 & 2033
- Figure 42: South America Silane Industry Volume Share (%), by Type 2025 & 2033
- Figure 43: South America Silane Industry Revenue (Million), by Application 2025 & 2033
- Figure 44: South America Silane Industry Volume (K Tons), by Application 2025 & 2033
- Figure 45: South America Silane Industry Revenue Share (%), by Application 2025 & 2033
- Figure 46: South America Silane Industry Volume Share (%), by Application 2025 & 2033
- Figure 47: South America Silane Industry Revenue (Million), by Country 2025 & 2033
- Figure 48: South America Silane Industry Volume (K Tons), by Country 2025 & 2033
- Figure 49: South America Silane Industry Revenue Share (%), by Country 2025 & 2033
- Figure 50: South America Silane Industry Volume Share (%), by Country 2025 & 2033
- Figure 51: Middle East and Africa Silane Industry Revenue (Million), by Type 2025 & 2033
- Figure 52: Middle East and Africa Silane Industry Volume (K Tons), by Type 2025 & 2033
- Figure 53: Middle East and Africa Silane Industry Revenue Share (%), by Type 2025 & 2033
- Figure 54: Middle East and Africa Silane Industry Volume Share (%), by Type 2025 & 2033
- Figure 55: Middle East and Africa Silane Industry Revenue (Million), by Application 2025 & 2033
- Figure 56: Middle East and Africa Silane Industry Volume (K Tons), by Application 2025 & 2033
- Figure 57: Middle East and Africa Silane Industry Revenue Share (%), by Application 2025 & 2033
- Figure 58: Middle East and Africa Silane Industry Volume Share (%), by Application 2025 & 2033
- Figure 59: Middle East and Africa Silane Industry Revenue (Million), by Country 2025 & 2033
- Figure 60: Middle East and Africa Silane Industry Volume (K Tons), by Country 2025 & 2033
- Figure 61: Middle East and Africa Silane Industry Revenue Share (%), by Country 2025 & 2033
- Figure 62: Middle East and Africa Silane Industry Volume Share (%), by Country 2025 & 2033
List of Tables
- Table 1: Global Silane Industry Revenue Million Forecast, by Type 2020 & 2033
- Table 2: Global Silane Industry Volume K Tons Forecast, by Type 2020 & 2033
- Table 3: Global Silane Industry Revenue Million Forecast, by Application 2020 & 2033
- Table 4: Global Silane Industry Volume K Tons Forecast, by Application 2020 & 2033
- Table 5: Global Silane Industry Revenue Million Forecast, by Region 2020 & 2033
- Table 6: Global Silane Industry Volume K Tons Forecast, by Region 2020 & 2033
- Table 7: Global Silane Industry Revenue Million Forecast, by Type 2020 & 2033
- Table 8: Global Silane Industry Volume K Tons Forecast, by Type 2020 & 2033
- Table 9: Global Silane Industry Revenue Million Forecast, by Application 2020 & 2033
- Table 10: Global Silane Industry Volume K Tons Forecast, by Application 2020 & 2033
- Table 11: Global Silane Industry Revenue Million Forecast, by Country 2020 & 2033
- Table 12: Global Silane Industry Volume K Tons Forecast, by Country 2020 & 2033
- Table 13: China Silane Industry Revenue (Million) Forecast, by Application 2020 & 2033
- Table 14: China Silane Industry Volume (K Tons) Forecast, by Application 2020 & 2033
- Table 15: India Silane Industry Revenue (Million) Forecast, by Application 2020 & 2033
- Table 16: India Silane Industry Volume (K Tons) Forecast, by Application 2020 & 2033
- Table 17: Japan Silane Industry Revenue (Million) Forecast, by Application 2020 & 2033
- Table 18: Japan Silane Industry Volume (K Tons) Forecast, by Application 2020 & 2033
- Table 19: South Korea Silane Industry Revenue (Million) Forecast, by Application 2020 & 2033
- Table 20: South Korea Silane Industry Volume (K Tons) Forecast, by Application 2020 & 2033
- Table 21: Rest of Asia Pacific Silane Industry Revenue (Million) Forecast, by Application 2020 & 2033
- Table 22: Rest of Asia Pacific Silane Industry Volume (K Tons) Forecast, by Application 2020 & 2033
- Table 23: Global Silane Industry Revenue Million Forecast, by Type 2020 & 2033
- Table 24: Global Silane Industry Volume K Tons Forecast, by Type 2020 & 2033
- Table 25: Global Silane Industry Revenue Million Forecast, by Application 2020 & 2033
- Table 26: Global Silane Industry Volume K Tons Forecast, by Application 2020 & 2033
- Table 27: Global Silane Industry Revenue Million Forecast, by Country 2020 & 2033
- Table 28: Global Silane Industry Volume K Tons Forecast, by Country 2020 & 2033
- Table 29: United States Silane Industry Revenue (Million) Forecast, by Application 2020 & 2033
- Table 30: United States Silane Industry Volume (K Tons) Forecast, by Application 2020 & 2033
- Table 31: Canada Silane Industry Revenue (Million) Forecast, by Application 2020 & 2033
- Table 32: Canada Silane Industry Volume (K Tons) Forecast, by Application 2020 & 2033
- Table 33: Mexico Silane Industry Revenue (Million) Forecast, by Application 2020 & 2033
- Table 34: Mexico Silane Industry Volume (K Tons) Forecast, by Application 2020 & 2033
- Table 35: Global Silane Industry Revenue Million Forecast, by Type 2020 & 2033
- Table 36: Global Silane Industry Volume K Tons Forecast, by Type 2020 & 2033
- Table 37: Global Silane Industry Revenue Million Forecast, by Application 2020 & 2033
- Table 38: Global Silane Industry Volume K Tons Forecast, by Application 2020 & 2033
- Table 39: Global Silane Industry Revenue Million Forecast, by Country 2020 & 2033
- Table 40: Global Silane Industry Volume K Tons Forecast, by Country 2020 & 2033
- Table 41: Germany Silane Industry Revenue (Million) Forecast, by Application 2020 & 2033
- Table 42: Germany Silane Industry Volume (K Tons) Forecast, by Application 2020 & 2033
- Table 43: United Kingdom Silane Industry Revenue (Million) Forecast, by Application 2020 & 2033
- Table 44: United Kingdom Silane Industry Volume (K Tons) Forecast, by Application 2020 & 2033
- Table 45: Italy Silane Industry Revenue (Million) Forecast, by Application 2020 & 2033
- Table 46: Italy Silane Industry Volume (K Tons) Forecast, by Application 2020 & 2033
- Table 47: France Silane Industry Revenue (Million) Forecast, by Application 2020 & 2033
- Table 48: France Silane Industry Volume (K Tons) Forecast, by Application 2020 & 2033
- Table 49: Rest of Europe Silane Industry Revenue (Million) Forecast, by Application 2020 & 2033
- Table 50: Rest of Europe Silane Industry Volume (K Tons) Forecast, by Application 2020 & 2033
- Table 51: Global Silane Industry Revenue Million Forecast, by Type 2020 & 2033
- Table 52: Global Silane Industry Volume K Tons Forecast, by Type 2020 & 2033
- Table 53: Global Silane Industry Revenue Million Forecast, by Application 2020 & 2033
- Table 54: Global Silane Industry Volume K Tons Forecast, by Application 2020 & 2033
- Table 55: Global Silane Industry Revenue Million Forecast, by Country 2020 & 2033
- Table 56: Global Silane Industry Volume K Tons Forecast, by Country 2020 & 2033
- Table 57: Brazil Silane Industry Revenue (Million) Forecast, by Application 2020 & 2033
- Table 58: Brazil Silane Industry Volume (K Tons) Forecast, by Application 2020 & 2033
- Table 59: Argentina Silane Industry Revenue (Million) Forecast, by Application 2020 & 2033
- Table 60: Argentina Silane Industry Volume (K Tons) Forecast, by Application 2020 & 2033
- Table 61: Rest of South America Silane Industry Revenue (Million) Forecast, by Application 2020 & 2033
- Table 62: Rest of South America Silane Industry Volume (K Tons) Forecast, by Application 2020 & 2033
- Table 63: Global Silane Industry Revenue Million Forecast, by Type 2020 & 2033
- Table 64: Global Silane Industry Volume K Tons Forecast, by Type 2020 & 2033
- Table 65: Global Silane Industry Revenue Million Forecast, by Application 2020 & 2033
- Table 66: Global Silane Industry Volume K Tons Forecast, by Application 2020 & 2033
- Table 67: Global Silane Industry Revenue Million Forecast, by Country 2020 & 2033
- Table 68: Global Silane Industry Volume K Tons Forecast, by Country 2020 & 2033
- Table 69: Saudi Arabia Silane Industry Revenue (Million) Forecast, by Application 2020 & 2033
- Table 70: Saudi Arabia Silane Industry Volume (K Tons) Forecast, by Application 2020 & 2033
- Table 71: South Africa Silane Industry Revenue (Million) Forecast, by Application 2020 & 2033
- Table 72: South Africa Silane Industry Volume (K Tons) Forecast, by Application 2020 & 2033
- Table 73: Rest of Middle East and Africa Silane Industry Revenue (Million) Forecast, by Application 2020 & 2033
- Table 74: Rest of Middle East and Africa Silane Industry Volume (K Tons) Forecast, by Application 2020 & 2033
Frequently Asked Questions
1. What is the projected Compound Annual Growth Rate (CAGR) of the Silane Industry?
The projected CAGR is approximately 5.7%.
2. Which companies are prominent players in the Silane Industry?
Key companies in the market include SIKA CORPORATION, Merck KGaA, BRB International (PETRONAS Chemical Group), GELEST INC, Tzamal D-Chem Laboratories Ltd, Momentive, Genesee Polymers Corporation, Dow, Alfa Aesar (Thermo Fisher Scientific), Shin-Etsu Chemical Co Ltd, Prochimia Surfaces, United Chemical Technologies, Wacker Chemie AG, Evonik.
3. What are the main segments of the Silane Industry?
The market segments include Type, Application.
4. Can you provide details about the market size?
The market size is estimated to be USD 319.39 Million as of 2022.
5. What are some drivers contributing to market growth?
; Growing Demand form the Construction Industry; Growing Demand for Light-Weight Composites; Increasing Demand from Automotive Industry.
6. What are the notable trends driving market growth?
Growing Demand from the Construction Industry.
7. Are there any restraints impacting market growth?
; Higher Production Costs; Unfavorable Conditions Arising Due to the COVID-19 Outbreak.
8. Can you provide examples of recent developments in the market?
N/A
9. What pricing options are available for accessing the report?
Pricing options include single-user, multi-user, and enterprise licenses priced at USD 4750, USD 5250, and USD 8750 respectively.
10. Is the market size provided in terms of value or volume?
The market size is provided in terms of value, measured in Million and volume, measured in K Tons.
11. Are there any specific market keywords associated with the report?
Yes, the market keyword associated with the report is "Silane Industry," which aids in identifying and referencing the specific market segment covered.
12. How do I determine which pricing option suits my needs best?
The pricing options vary based on user requirements and access needs. Individual users may opt for single-user licenses, while businesses requiring broader access may choose multi-user or enterprise licenses for cost-effective access to the report.
13. Are there any additional resources or data provided in the Silane Industry report?
While the report offers comprehensive insights, it's advisable to review the specific contents or supplementary materials provided to ascertain if additional resources or data are available.
14. How can I stay updated on further developments or reports in the Silane Industry?
To stay informed about further developments, trends, and reports in the Silane Industry, consider subscribing to industry newsletters, following relevant companies and organizations, or regularly checking reputable industry news sources and publications.
Methodology
Step 1 - Identification of Relevant Samples Size from Population Database


Step 2 - Approaches for Defining Global Market Size (Value, Volume* & Price*)

Note*: In applicable scenarios
Step 3 - Data Sources
Primary Research
- Web Analytics
- Survey Reports
- Research Institute
- Latest Research Reports
- Opinion Leaders
Secondary Research
- Annual Reports
- White Paper
- Latest Press Release
- Industry Association
- Paid Database
- Investor Presentations

Step 4 - Data Triangulation
Involves using different sources of information in order to increase the validity of a study
These sources are likely to be stakeholders in a program - participants, other researchers, program staff, other community members, and so on.
Then we put all data in single framework & apply various statistical tools to find out the dynamic on the market.
During the analysis stage, feedback from the stakeholder groups would be compared to determine areas of agreement as well as areas of divergence